

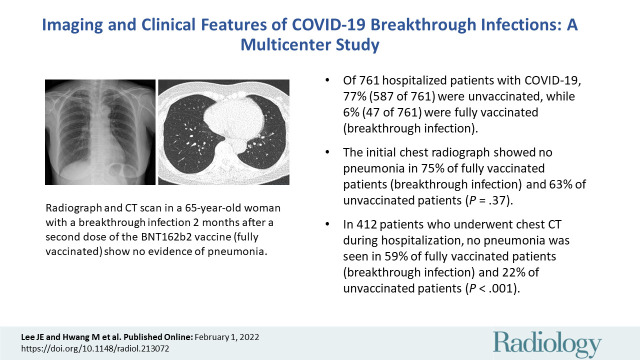
Imaging and Clinical Features of COVID-19 Breakthrough Infections: A Multicenter Study
- PMID: 35103535
- PMCID: PMC9131173
- DOI: 10.1148/radiol.213072
Imaging and Clinical Features of COVID-19 Breakthrough Infections: A Multicenter Study
Abstract
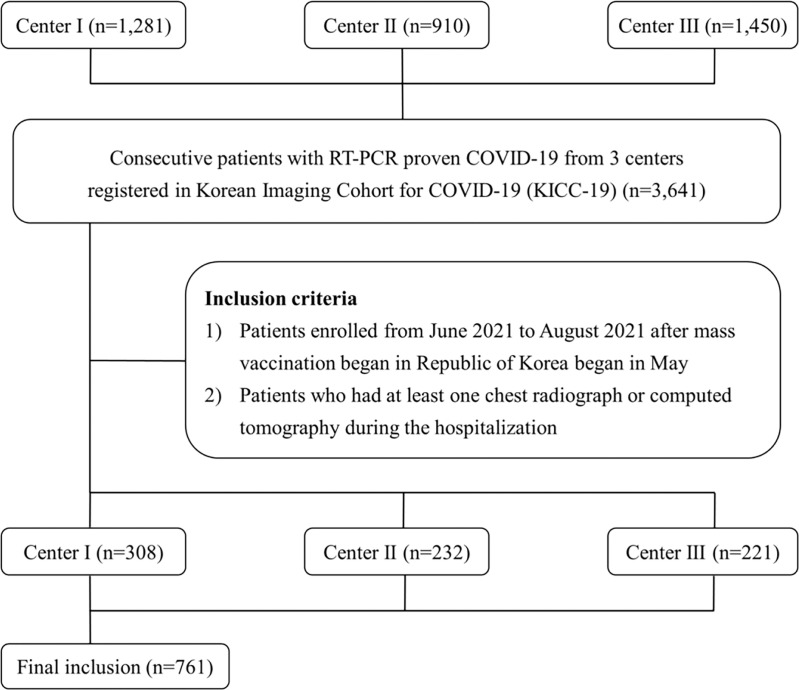
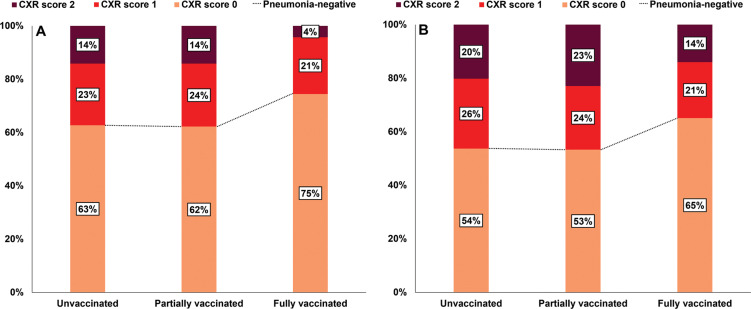
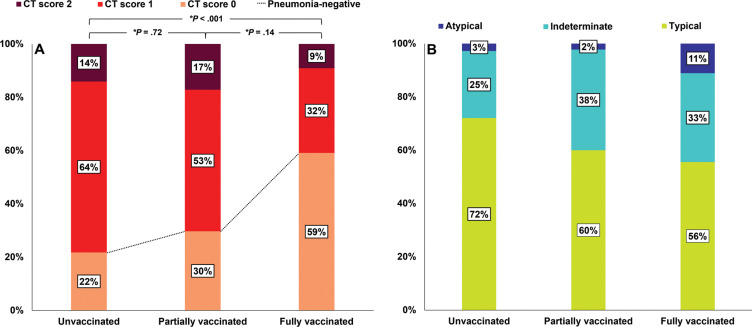
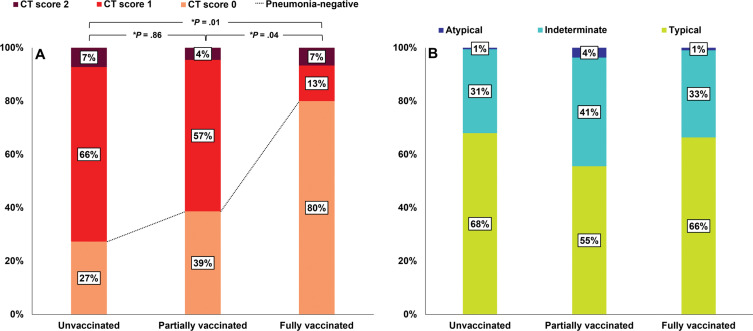
Background Since vaccines against COVID-19 became available, rare breakthrough infections have been reported despite their high efficacies. Purpose To evaluate the clinical and imaging characteristics of patients with COVID-19 breakthrough infections and compare them with those of unvaccinated patients with COVID-19. Materials and Methods In this retrospective multicenter cohort study, the authors analyzed patient (aged ≥18 years) data from three centers that were registered in an open data repository for COVID-19 between June and August 2021. Hospitalized patients with baseline chest radiographs were divided into three groups according to their vaccination status. Differences between clinical and imaging features were analyzed using the Pearson χ2 test, Fisher exact test, and analysis of variance. Univariable and multivariable logistic regression analyses were used to evaluate associations between clinical factors, including vaccination status and clinical outcomes. Results Of the 761 hospitalized patients with COVID-19, the mean age was 47 years and 385 (51%) were women; 47 patients (6%) were fully vaccinated (breakthrough infection), 127 (17%) were partially vaccinated, and 587 (77%) were unvaccinated. Of the 761 patients, 412 (54%) underwent chest CT during hospitalization. Among the patients who underwent CT, the proportions without pneumonia were 22% of unvaccinated patients (71 of 326), 30% of partially vaccinated patients (19 of 64), and 59% of fully vaccinated patients (13 of 22) (P < .001). Fully vaccinated status was associated with a lower risk of requiring supplemental oxygen (odds ratio [OR], 0.24 [95% CI: 0.09, 0.64; P = .005]) and lower risk of intensive care unit admission (OR, 0.08 [95% CI: 0.09, 0.78; P = .02]) compared with unvaccinated status. Conclusion Patients with COVID-19 breakthrough infections had a significantly higher proportion of CT scans without pneumonia compared with unvaccinated patients. Vaccinated patients with breakthrough infections had a lower likelihood of requiring supplemental oxygen and intensive care unit admission. © RSNA, 2022 Online supplemental material is available for this article. See also the editorial by Schiebler and Bluemke in this issue.
Conflict of interest statement
Figures
Comment in
-
Seeing Is Believing: COVID-19 Vaccination Leads to Less Pneumonia at Chest CT.Radiology. 2022 Jun;303(3):693-695. doi: 10.1148/radiol.220129. Epub 2022 Feb 1. Radiology. 2022. PMID: 35103545 Free PMC article. No abstract available.
-
Vaccination and Reduced Severity of COVID-19 Pneumonia Viewed at Chest Radiography.Radiology. 2022 Sep;304(3):E47. doi: 10.1148/radiol.220309. Epub 2022 Jun 7. Radiology. 2022. PMID: 35994398 Free PMC article. No abstract available.
References
-
- World Health Organization . Weekly epidemiological update on COVID-19 . https://www.who.int/publications/m/item/weekly-epidemiological-update-on.... Published December 28, 2021. Accessed December 29, 2021.
-
- World Health Organization . Coronavirus (COVID-19) dashboard . https://covid19.who.int/. Accessed December 29, 2021.
-
- Centers for Disease Control and Prevention . The possibility of COVID-19 after vaccination: breakthrough infections . https://www.cdc.gov/coronavirus/2019-ncov/vaccines/effectiveness/why-mea.... Published September 7, 2021. Accessed November 3, 2021 .
Publication types
MeSH terms
Substances
Supplementary concepts
LinkOut - more resources
Full Text Sources
Medical
