. 2022 Mar 7;219(3):e20210042.
doi: 10.1084/jem.20210042. Epub 2022 Feb 1.

Suppressive effects of the obese tumor microenvironment on CD8 T cell infiltration and effector function

Affiliations

Suppressive effects of the obese tumor microenvironment on CD8 T cell infiltration and effector function

Lydia Dyck et al. J Exp Med. .

Erratum in

Abstract

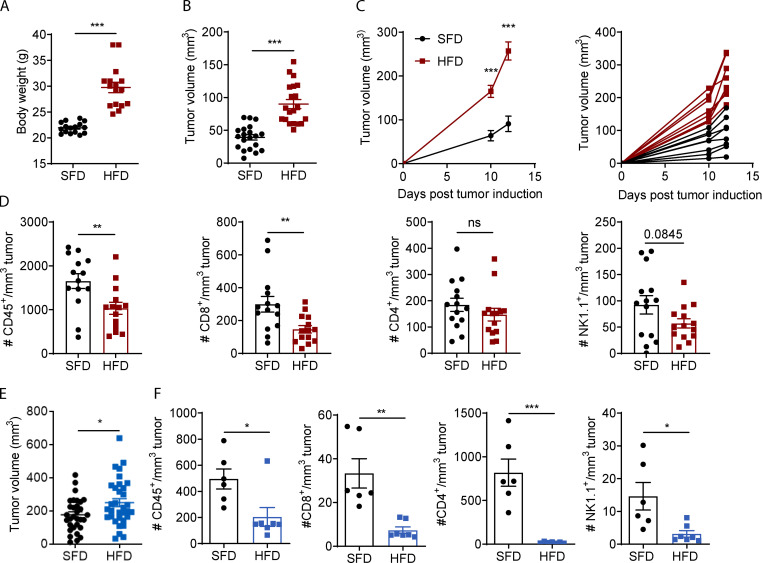
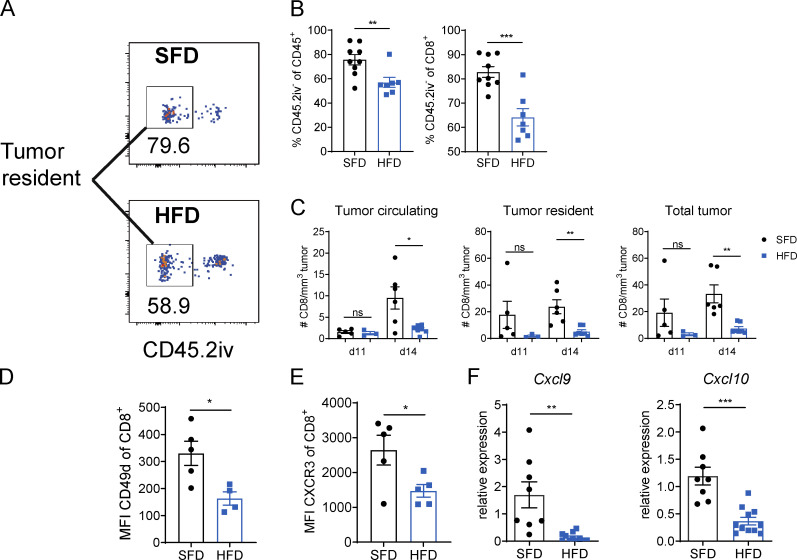
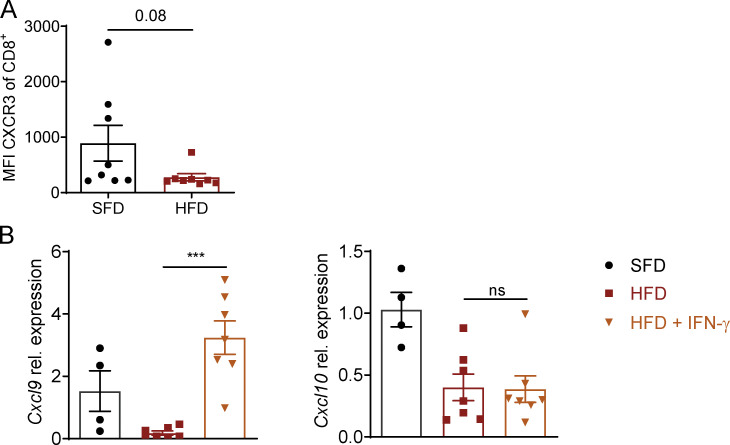
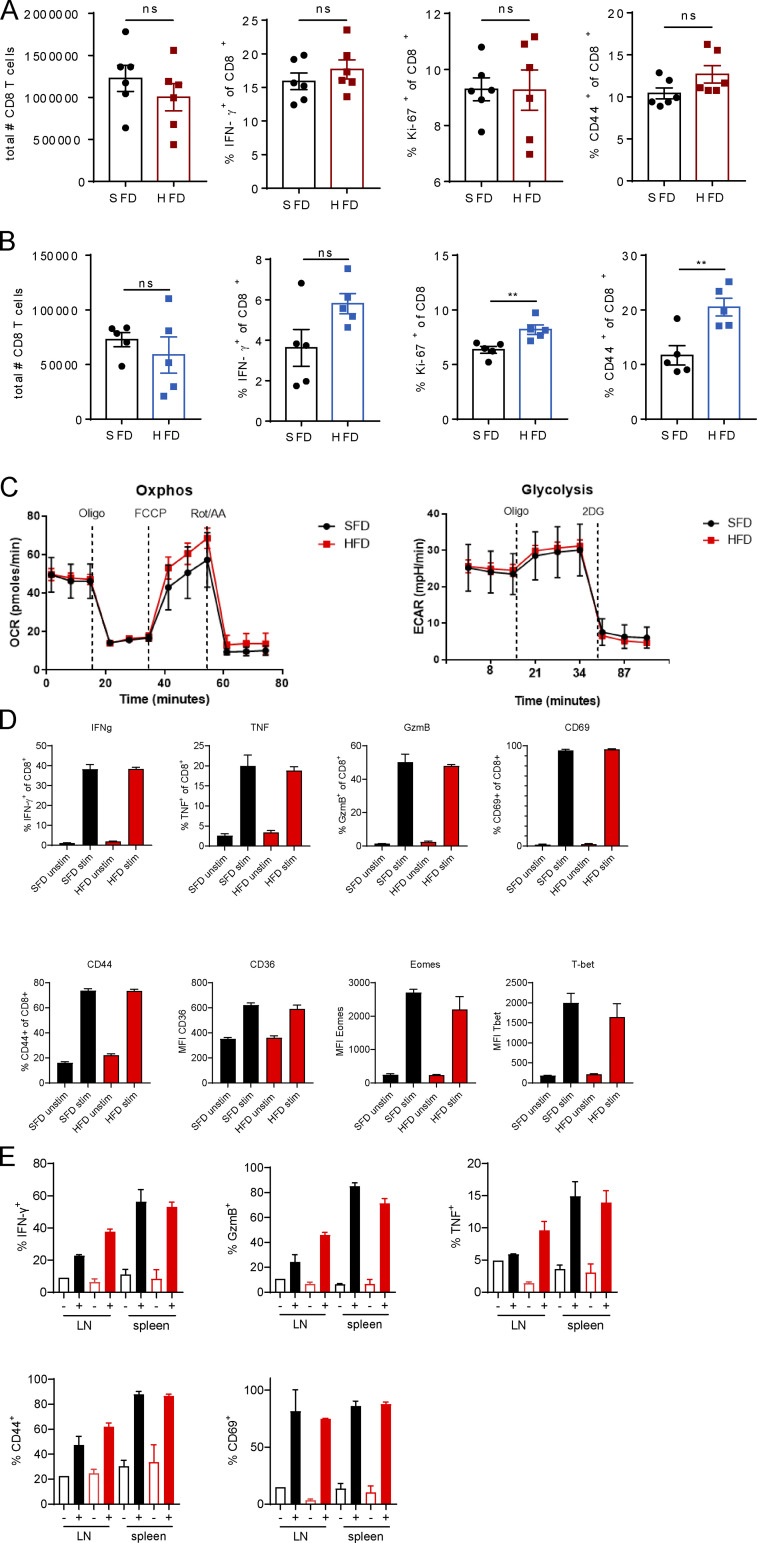
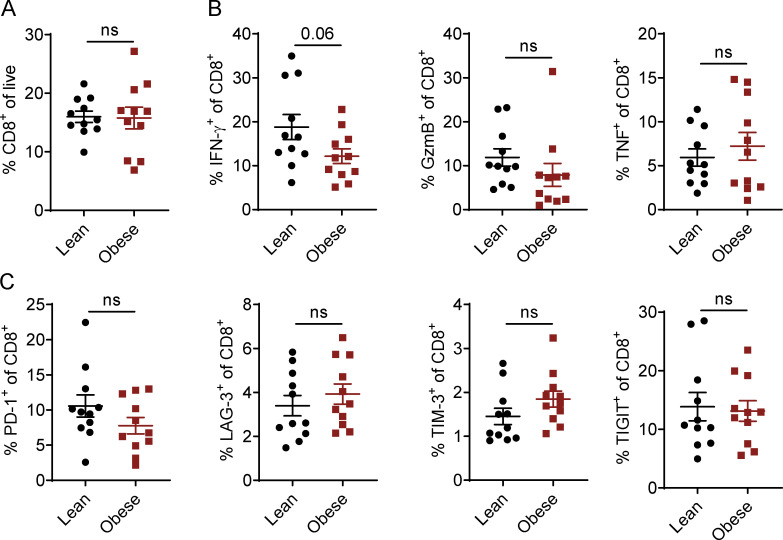
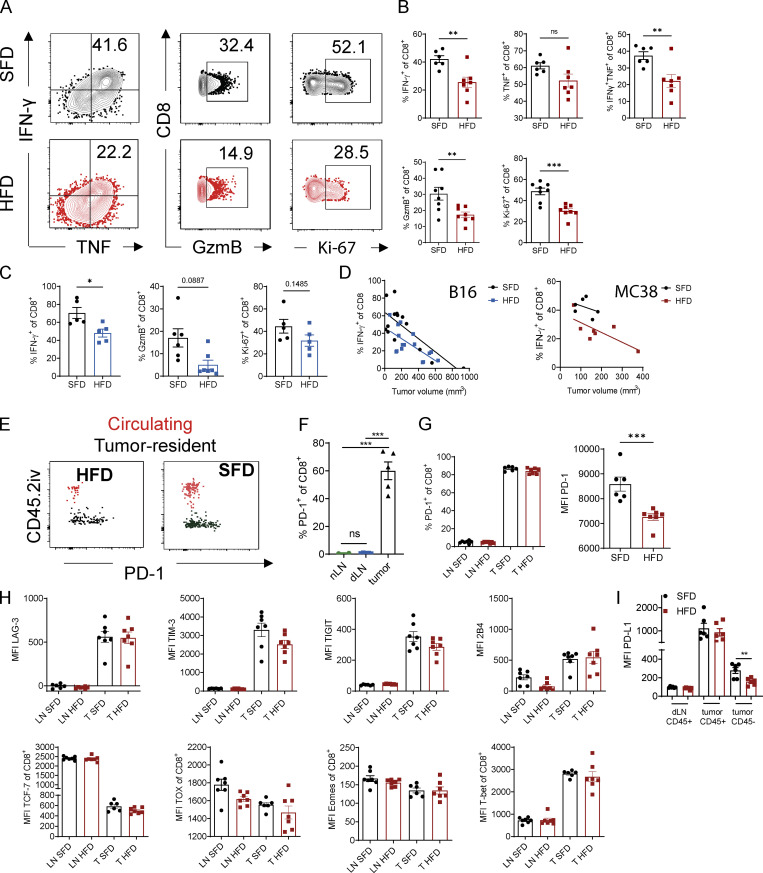
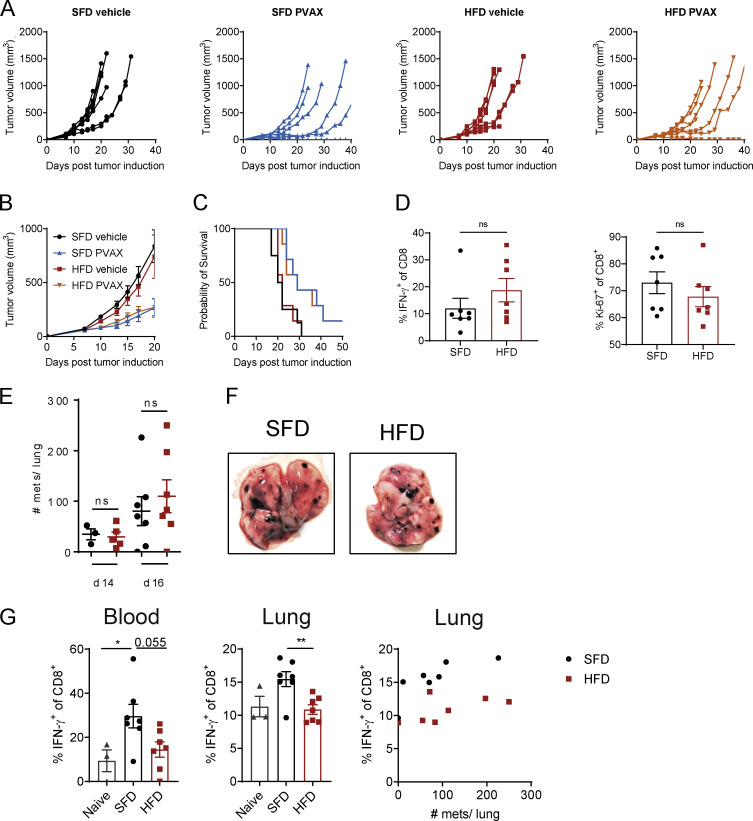
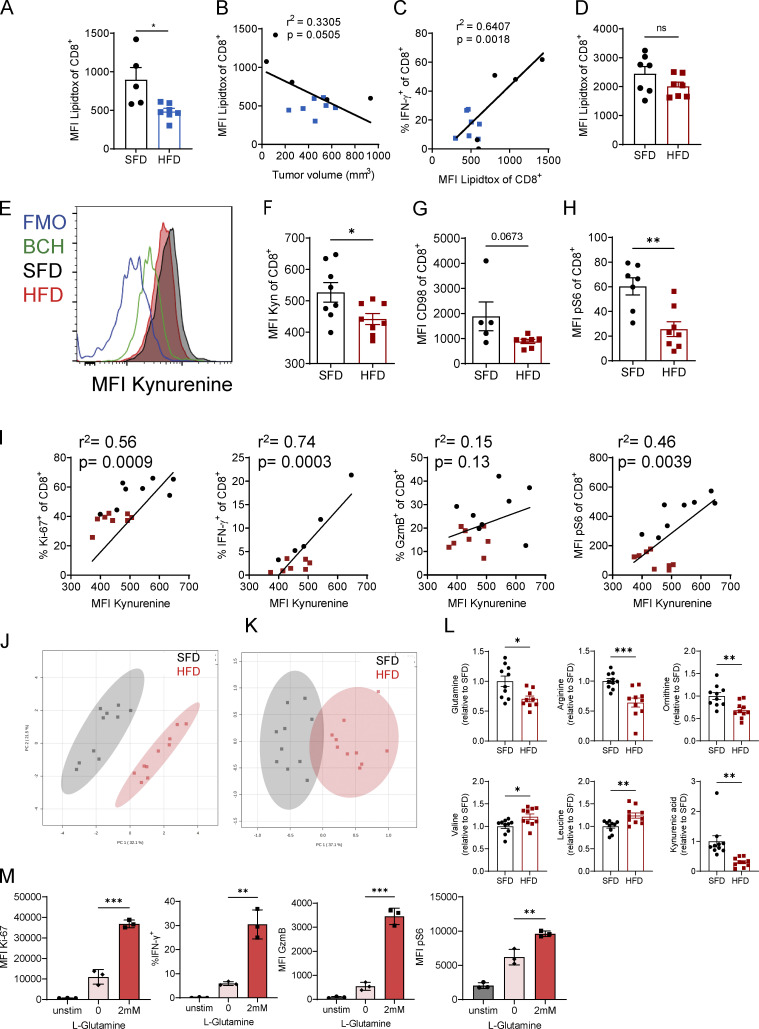
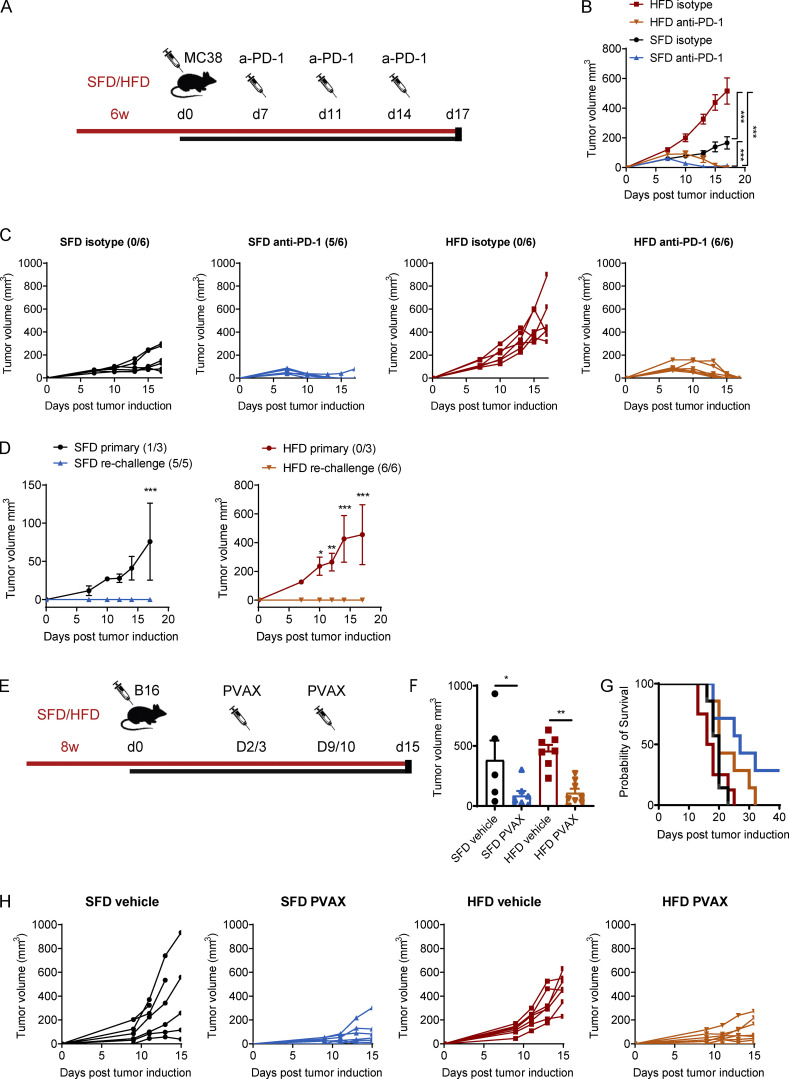
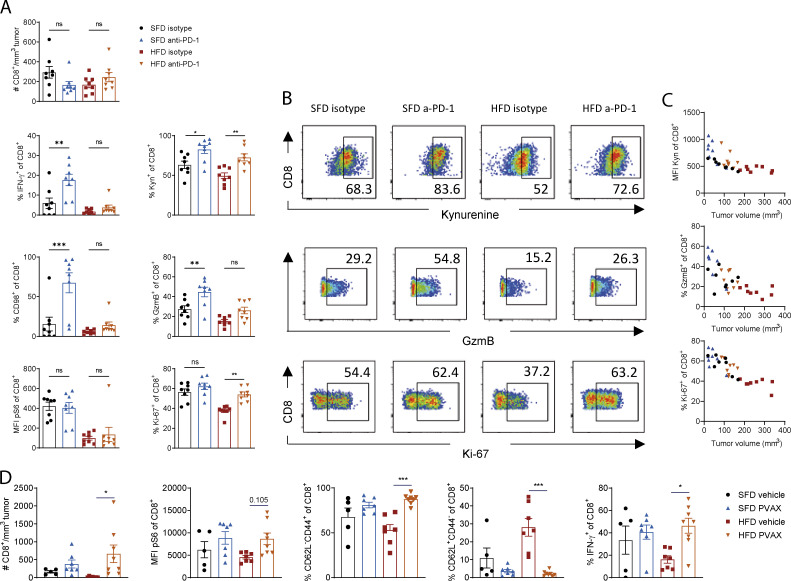
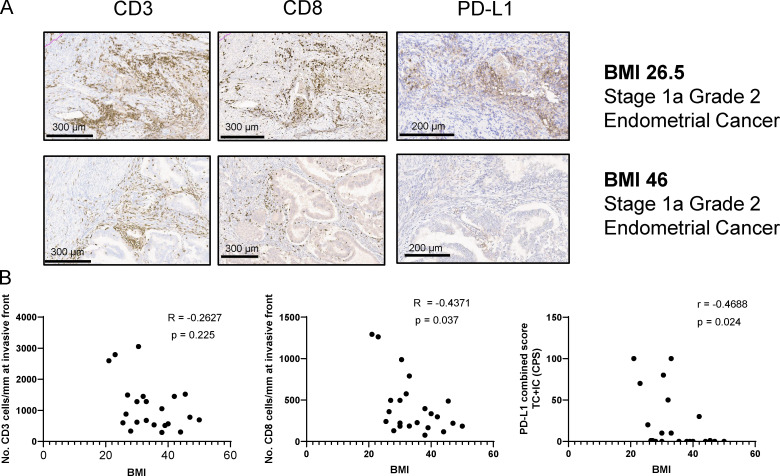
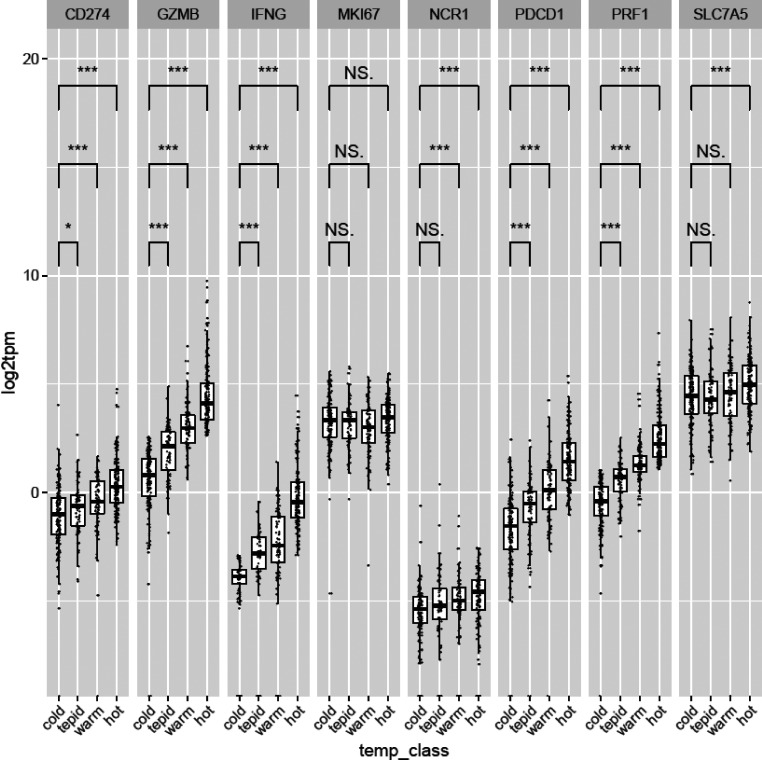
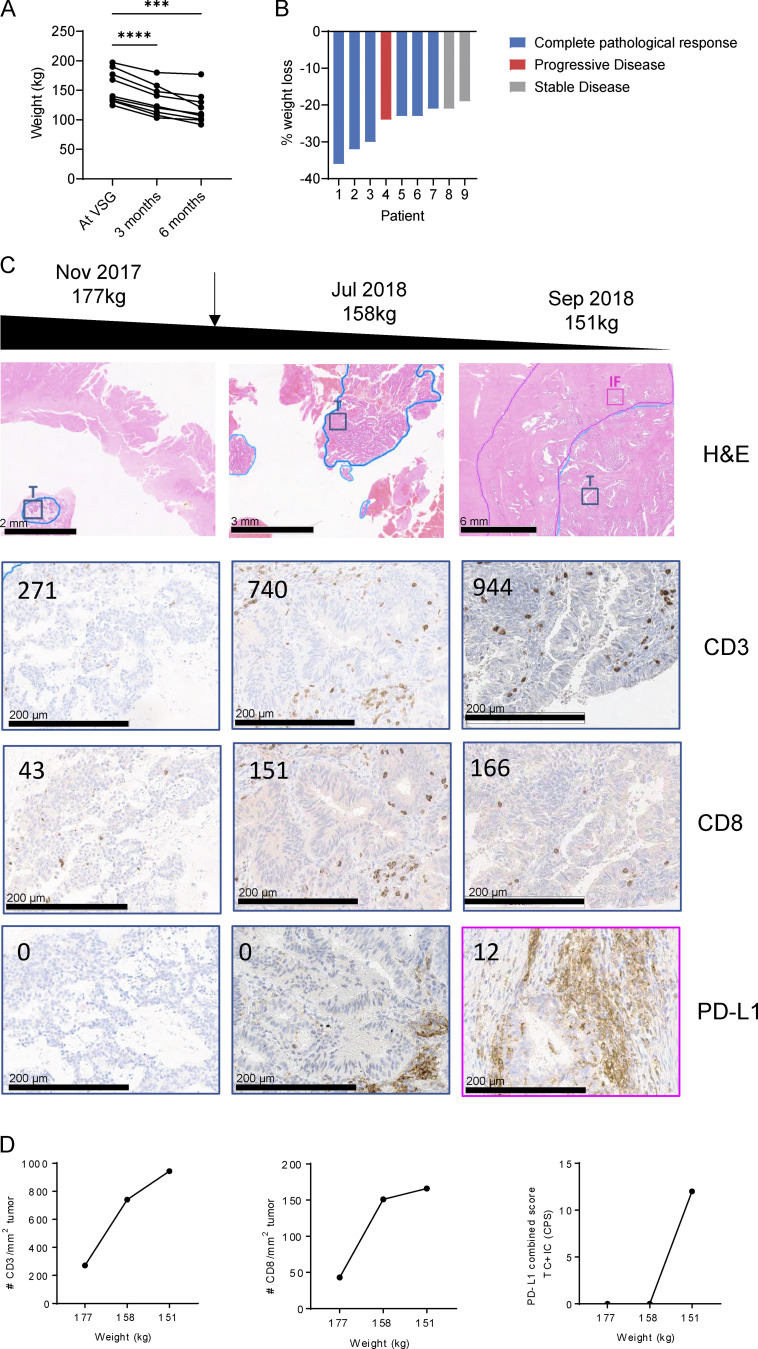
Obesity is one of the leading preventable causes of cancer; however, little is known about the effects of obesity on anti-tumor immunity. Here, we investigated the effects of obesity on CD8 T cells in mouse models and patients with endometrial cancer. Our findings revealed that CD8 T cell infiltration is suppressed in obesity, which was associated with a decrease in chemokine production. Tumor-resident CD8 T cells were also functionally suppressed in obese mice, which was associated with a suppression of amino acid metabolism. Similarly, we found that a high BMI negatively correlated with CD8 infiltration in human endometrial cancer and that weight loss was associated with a complete pathological response in six of nine patients. Moreover, immunotherapy using anti-PD-1 led to tumor rejection in lean and obese mice and partially restored CD8 metabolism and anti-tumor immunity. These findings highlight the suppressive effects of obesity on CD8 T cell anti-tumor immunity, which can partially be reversed by weight loss and/or immunotherapy.


Conflict of interest statement

Disclosures: C. LeRoux reported personal fees from NovoNordisk, Herbalife, GI Dynamics, Keyron, Johnson&Johnson, Boehringer Ingelheim, and Lilly outside the submitted work. E.T. Chouchani is a founder, board member, and equity holder in EoCys Therapeutics. L. Lynch reported personal fees from AgenTus Therapeutics outside the submitted work. No other disclosures were reported.

Figures

Figure 1.
Figure 1.
HFD-induced obesity increases tumor growth and decreases immune cell infiltration in mice. (A–D) C57BL/6 mice were fed an HFD (n = 14–16) or an SFD (n = 14–16) for 6–9 wk, and MC38 tumors were injected. Graphs depict weight at 9 wk for HFD (A), tumor volume on day 7 after tumor inoculation (B), and tumor growth progression (C). (D) Tumors from C were dissected, and immune cell infiltration was analyzed by flow cytometry. (E) C57BL/6 mice were fed an HFD or SFD for 10–13 wk, and mice were injected s.c. with B16-F10 tumor cells. Graph indicates tumor volume on day 11 after tumor inoculation from five pooled experiments (SFD, n = 31; HFD, n = 33). (F) Tumors from one experiment in E were dissected, and immune cell infiltration was analyzed by flow cytometry (SFD, n = 6; HFD, n = 7). Data are shown as individual mice (dots) and mean ± SEM. (A, B, D, and E) Unpaired Student’s t test. (C) Two-way ANOVA. *, P < 0.05; **, P < 0.01; ***, P < 0.001. This experiment was performed five times in the MC38 model and six times in the B16 model.
Figure 2.
Figure 2.
HFD-induced obesity suppresses immune cell trafficking to the tumor. C57BL/6 mice were fed an HFD or SFD for 9–12 wk, and B16-F10 tumors were injected. CD45.2-PE was injected i.v. 10 min before culling. This experiment was performed twice. (A) Exemplary image of flow cytometric analysis of tumors from SFD- and HFD-fed mice. Boxes indicate CD45.2iv tumor-resident population. (B) Proportion of tumor-resident leukocytes (CD45.2iv) and CD8+ T cells in B16-F10 tumors. (C) Number of tumor-circulating, tumor-resident, and total CD8+ T cells in B16-F10 tumors. (D and E) Flow cytometric analysis of CXCR3 and CD49d expression on CD8+ T cells in B16.F10 tumors. (F) qPCR on total B16-F10 tumors from SFD-fed (n = 8) and HFD-fed (n = 11) mice from two pooled experiments. Data are shown as individual mice (dots) and mean ± SEM. Significance was calculated using an unpaired Student’s t test. *, P < 0.05; **, P < 0.01; ***, P < 0.001.
Figure S1.
Figure S1.
Chemokine and chemokine receptor expression in tumors of HFD-fed mice. (A) Flow cytometric analysis of CXCR3 expression by CD8+ T cells on day 17 after tumor injection in MC38 tumors of SFD-fed (n = 7) or HFD-fed (n = 8) mice. Dots represent individual mice. P = 0.08 using unpaired Student’s t test. (B) SFD and HFD mice were injected with B16-F10 tumors, and HFD mice were injected s.c. with rmIFN-γ on days 5, 8, 11, and 13. Experiment was performed twice (n = 4–7 per group). Relative expression of Cxcl9 and Cxcl10 from total tumors on day 14 after tumor injection. Data are shown as individual mice and mean ± SEM; one-way ANOVA. ***, P < 0.001.
Figure S2.
Figure S2.
CD8 T cell activation in dLNs is not impaired in obese mice. (A and B) C57BL/6 mice were fed an SFD or HFD, and MC38 (A) or B16-F10 (B) tumor cells were injected s.c. Results depict flow cytometric analysis of CD8+ T cells in dLNs of tumor-bearing mice. Data are shown as individual mice and mean ± SEM; unpaired Student’s t test. **, P < 0.01 for three independent experiments for each tumor model. (C and D) CD8 T cells isolated from SFD-fed (n = 3; pooled) or HFD-fed (n = 3; pooled) mice were activated with anti-CD3/anti-CD28 and analyzed by Seahorse flux assay (C) or flow cytometry (D). Oxphos, oxidative phosphorylation. (E) CD8 T cells isolated from dLNs or spleens from SFD-fed (black; n = 3 technical replicates from 7 pooled mice) or HFD-fed (red; n = 3 technical replicates from 7 pooled mice) mice were activated with anti-CD3/anti-CD28 (+) or unstimulated (−) and analyzed by flow cytometry. Representative data from at least two independent experiments.
Figure S3.
Figure S3.
Activation profile of human CD8 T cells from lean and obese donors. (A–C) Flow cytometric analysis of CD8+ T cells in PBMCs of lean (n = 11) or obese (n = 11) donors. PBMCs were either stained directly (A and C) or stimulated with PMA, ionomycin, and BFA for 3.5 h before staining (B). Data are shown as individual donors and mean ± SEM; unpaired Student’s t test.
Figure 3.
Figure 3.
HFD-induced obesity impairs CD8 T cell effector function in tumors independent of PD-1 expression. (A and B) Flow cytometric analysis of intracellular IFN-γ, TNF, GzmB, and Ki-67 expression by CD8+ T cells in MC38 tumors of SFD-fed (n = 6) and HFD-fed (n = 7) mice. Results are shown as representative FACS plots (A) and percentage of cells (B). (C) Flow cytometric analysis of intracellular IFN-γ, GzmB, and Ki-67 expression by CD8+ T cells in subcutaneous B16-F10 tumors (n = 5 or 6 mice per group). Results are shown as percentage of cells. (D) Correlation between tumor volume and IFN-γ expression in CD8 T cells. Lines represent simple linear regression for each group. Pooled data from three experiments in B16 model (n = 14–16 mice per group) and one representative experiment for MC38 model (n = 6 mice per group). (E) Exemplary FACS plot of PD-1 expression on B16-F10 tumor-resident CD8+ T cells (CD45.2iv; black) and tumor-circulating CD8 T cells (CD45.2iv+; red). (F) Flow cytometric analysis of PD-1 expression on CD8+ T cells from naive lymph nodes (nLNs), tumor dLNs, and MC38 tumors. (G) Flow cytometric analysis of PD-1 expression on CD8+ T cells from SFD- and HFD-fed mice in dLNs and MC38 tumors. (H) Flow cytometric analysis of surface markers and transcription factors on CD8 T cells from LNs and MC38 tumors. (I) Flow cytometric analysis of PD-L1 expression on CD45+ and CD45 cells in dLNs and MC38 tumors from SFD- and HFD-fed mice. Data are shown as individual mice (dots) and mean ± SEM. (B, C, F, and G) Unpaired Student’s t test. (E) One-way ANOVA. *, P < 0.05; **, P < 0.01; ***, P < 0.001. This experiment was performed three times (B16 model) and at least twice for each graph (MC38 model).
Figure S4.
Figure S4.
Effect of HFD-induced obesity in the B16-F10 metastatic model. (A–C) BALB/c mice were fed an SFD or HFD for 8 wk, and mice were injected s.c. with CT26 tumor cells (n = 7 or 8 mice per group; experiment was performed twice). On days 2 and 9, mice were injected i.p. with anti–PD-1 (200 µg/mouse), and, on days 3 and 10, mice were injected s.c. with a vaccine (hs/irr CT26 + R848) peritumorally. Figure depicts mean tumor growth ± SEM (A), percentage survival (i.e., mouse reached experimental endpoint; B), and individual tumor growth curves (C). (D) Tumor-infiltrating CD8 T cells were analyzed by flow cytometry. (E–G) C57BL/6 mice were fed an HFD or SFD for 8 wk, and mice were injected i.v. with B16-F10 tumor cells (combined data from two experiments; n = 3–7 per group). Graph shows number of lung metastases (mets) on days 14 and 16 after tumor injection (A) and exemplary images of lungs from SFD- and HFD-fed mice (B). (C) Flow cytometric analysis of IFN-γ expression by CD8+ T cells in the blood and lungs of non–tumor-bearing (naive) or SFD- or HFD-fed tumor-bearing mice. Data are shown as individual mice and mean ± SEM; unpaired Student’s t test (E and D) and one-way ANOVA (C). *, P < 0.05; **, P < 0.01.
Figure 4.
Figure 4.
Obesity-induced functional defects in CD8 T cells are associated with impaired amino acid metabolism. (A–D) C57BL/6 mice were fed an HFD or SFD, and B16-F10 (A–C; n = 5 SFD, n = 7 HFD) and MC38 (D; n = 7 per group) tumors were injected. LipidTOX uptake by CD8+ T cells from tumors was analyzed by flow cytometry. Graphs depict MFI (A and D), correlation of LipidTOX versus tumor volume (B), and correlation of LipidTOX versus IFN-γ expression by CD8+ T cells (C). (E–I) C57BL/6 mice were fed an HFD (n = 8) or SFD (n = 8) for 6 wk, and MC38 tumors were injected s.c. On day 12 after tumor inoculation, tumors were dissected and stained for flow cytometry. (E and F) Representative graph, and quantification of kynurenine uptake by CD8+ T cells in tumors. Cells were treated with the system L blocker BCH or not treated with kynurenine (fluorescence minus one control [FMO]) as negative controls. (G and H) MFI or frequency of kynurenine, CD98, and pS6 in CD8+ T cells. (I) Correlation between kynurenine uptake and expression of intracellular molecules in CD8 T cells. Black dots indicate SFD-fed mice, and red dots indicate HFD-fed mice. (J–L) Serum taken from male SFD-fed (n = 10) or HFD-fed (n = 10) mice was analyzed by mass spectrometry for metabolite composition. Data are represented as fold change over SFD. Pooled data from two experiments. (M) CD8 T cells isolated from naive spleens were activated with anti-CD3/anti-CD28 in the presence or absence of L-glutamine, and expression of Ki-67, IFN-γ, GzmB, and pS6 was analyzed by flow cytometry. Experiment was performed twice (n = 3 technical replicates). (A, D, F–H, and L) Unpaired Student’s t test. (B, C, and I) Simple linear regression. (M) One-way ANOVA. *, P < 0.05; **, P < 0.01; ***, P < 0.001.
Figure 5.
Figure 5.
Immunotherapy protects from tumor growth in lean and obese mice. (A–D) C57BL/6 mice were fed an HFD or SFD for 6 wk, and MC38 tumors were injected. On days 7, 11, and 14, mice were injected i.p. with anti–PD-1 (200 µg/mouse). Figure depicts injection scheme (A), mean tumor growth ± SEM, two-way ANOVA (B), and individual tumor growth curves (C). (D) Mice that previously rejected tumors were rechallenged with MC38 tumor cells and compared with SFD- or HFD-fed mice that had not been injected with tumor cells previously (primary). Graphs depict mean tumor growth ± SEM (two-way ANOVA). Numbers in brackets indicate the number of mice that rejected the tumor out of the total mice in the group (n = 6 per group; experiment was performed four times). (E–H) C57BL/6 mice were fed an HFD or SFD for 8 wk, and B16-F10 tumors were injected. On days 2 and 9, mice were injected i.p. with anti–PD-1 (200 µg/mouse), and, on days 3 and 10, mice were injected s.c. with a vaccine (hs/irr B16-F10 + R848) peritumorally. Experiment was performed twice (n = 7 or 8 per group). Figure depicts injection scheme (E); mean tumor volume ± SEM on day 15; dots represent individual mice; one-way ANOVA (F); percentage survival (i.e., mouse reached experimental endpoint; G); and individual tumor growth curves (H). *, P < 0.05; **, P < 0.01; ***, P < 0.001.
Figure 6.
Figure 6.
Immunotherapy partially restores CD8 T cell function in lean and obese mice. (A–C) C57BL/6 mice were fed an HFD or SFD for 6 wk, and MC38 tumors were injected as in Fig. 5 A. On day 10, mice were injected i.p. with anti–PD-1 (200 µg/mouse), and tumors were analyzed on day 12. Data are shown as individual mice (dots; n = 7 or 8 per group) and mean ± SEM (A), representative FACS plots (B), and correlation between tumor size and kynurenine, Ki-67, or GzmB expression (C). Experiment was performed three times. (D) C57BL/6 mice were fed an HFD or SFD for 8 wk, and B16-F10 tumors were injected as in Fig. 5 E. On days 2 and 9, mice were injected i.p. with anti–PD-1 (200 µg/mouse), and, on days 3 and 10, mice were injected s.c. with a vaccine (hs/irr B16-F10 + R848) peritumorally. On day 15, tumors were analyzed by flow cytometry. Figure depicts flow cytometric analysis of CD8+ T cells in the tumors. Data are shown as individual mice (dots; n = 5–7 per group) and mean ± SEM. Experiment was performed twice. Significance was calculated using one-way ANOVA. *, P < 0.05; **, P < 0.01; ***, P < 0.001.
Figure 7.
Figure 7.
Obesity is associated with impaired immune infiltration in humans with endometrial cancer. Immune profiles of endometrial cancer tumors and IF in a blinded normal and obese patient study (n = 24). (A) Exemplary images of CD3, CD8, and PD-L1 immunohistochemical staining in IF of two stage 1a, grade 2 endometrial cancer patients (BMI 26.5 kg/m2 and BMI 46 kg/m2, respectively). (B) Correlation of CD3, CD8, and PD-L1 scores with patient BMI. Correlation was computed using nonparametric Spearman correlation.
Figure S5.
Figure S5.
Genes associated with tumor temperature classes. Correlation of genes with tumor temperature classes. Patient samples were scored by their median expression value for IFN-γ, GzmB, and PRF1 (+0 for below median, +1 for above median). Scores were summed to give four temperature classes (0–3), named as “cold,” “tepid,” “warm,” and “hot,” respectively. Wilcoxon rank-sum tests were used to determine if the distribution of genes of interest was significantly different between each temperature class. *, P < 0.05; ***, P < 0.001.
Figure 8.
Figure 8.
Weight loss restores T cell infiltration in endometrial cancer. (A and B) Patients with endometrial cancer (n = 9) were analyzed for weight loss (A) and cancer disease progression (B) after VSG. (C and D) Immune profile of tissue samples taken from a patient with endometrial cancer over the course of their treatment. The patient received VSG in April 2018, and samples were taken before and after VSG. (C) H&E (top panel) and IHC images of tumor tissue (T; blue) and IF (pink) stained for CD3, CD8, and PD-L1. Numbers in images represent the number of CD3+ or CD8+ T cells per mm2 tumor or PD-L1 combined score. (D) CD3 and CD8 infiltration and PD-L1 scores over the course of weight loss. Significance was calculated using one-way ANOVA (A). ***, P < 0.001; ****, P < 0.0001.

References

    1. Barber, D.L., Wherry E.J., Masopust D., Zhu B., Allison J.P., Sharpe A.H., Freeman G.J., and Ahmed R.. 2006. Restoring function in exhausted CD8 T cells during chronic viral infection. Nature. 439:682–687. 10.1038/nature04444 - DOI - PubMed
    1. Bengsch, B., Johnson A.L., Kurachi M., Odorizzi P.M., Pauken K.E., Attanasio J., Stelekati E., McLane L.M., Paley M.A., Delgoffe G.M., and Wherry E.J.. 2016. Bioenergetic insufficiencies due to metabolic alterations regulated by the inhibitory receptor PD-1 are an early driver of CD8+ T cell exhaustion. Immunity. 45:358–373. 10.1016/j.immuni.2016.07.008 - DOI - PMC - PubMed
    1. Bindea, G., Mlecnik B., Angell H.K., and Galon J.. 2014. The immune landscape of human tumors: Implications for cancer immunotherapy. OncoImmunology. 3:e27456. 10.4161/onci.27456 - DOI - PMC - PubMed
    1. Bray, N.L., Pimentel H., Melsted P., and Pachter L.. 2016. Near-optimal probabilistic RNA-seq quantification. Nat. Biotechnol. 34:525–527. 10.1038/nbt.3519 - DOI - PubMed
    1. Brown, J.M., and Wilson W.R.. 2004. Exploiting tumour hypoxia in cancer treatment. Nat. Rev. Cancer. 4:437–447. 10.1038/nrc1367 - DOI - PubMed

Publication types

LinkOut - more resources