. 2022 Mar;143(3):403-414.
doi: 10.1007/s00401-022-02404-9. Epub 2022 Feb 1.

High-grade glioma with pleomorphic and pseudopapillary features (HPAP): a proposed type of circumscribed glioma in adults harboring frequent TP53 mutations and recurrent monosomy 13

Affiliations

High-grade glioma with pleomorphic and pseudopapillary features (HPAP): a proposed type of circumscribed glioma in adults harboring frequent TP53 mutations and recurrent monosomy 13

Drew Pratt et al. Acta Neuropathol. 2022 Mar.

Abstract

Tumors of the central nervous system (CNS) often display a wide morphologic spectrum that has, until recently, been the sole basis for tumor classification. The introduction of the integrated histomolecular diagnostic approach in CNS tumors has facilitated a classification system that is increasingly data-driven and with improved alignment to clinical outcome. Here, we report a previously uncharacterized glioma type (n = 31) using unsupervised clustering analysis of DNA methylation array data from approximately 14,000 CNS tumor samples. Histologic examination revealed circumscribed growth and morphologic similarities to pleomorphic xanthoastrocytoma (PXA), astroblastoma, ependymoma, polymorphous neuroepithelial tumor of the young (PLNTY), and IDH-wildtype glioblastoma (GBM). Median age (46.5 years) was significantly older than other circumscribed gliomas and younger than GBM. Dimensionality reduction with uniform manifold approximation and projection (UMAP) and hierarchical clustering confirmed a methylation signature distinct from known tumor types and methylation classes. DNA sequencing revealed recurrent mutations in TP53 (57%), RB1 (26%), NF1 (26%), and NF2 (14%). BRAF V600E mutations were detected in 3/27 sequenced cases (12%). Copy number analysis showed increased whole chromosome aneuploidy with recurrent loss of chromosome 13 (28/31 cases, 90%). CDKN2A/B deletion (2/31, 6%) and MGMT promoter methylation (1/31, 3%) were notably rare events. Most tumors showed features of a high-grade glioma, yet survival data showed significantly better overall survival compared to GBM (p < 0.0001). In summary, we describe a previously uncharacterized glioma of adults identified by a distinct DNA methylation signature and recurrent loss of chromosome 13.


Conflict of interest statement

Conflict of interest None declared.

Figures

Fig. 1
Fig. 1
UMAP embedding of DNA methylation array data for select tumor types (a). Samples from this proposed group (HPAP, n = 31) embedded among select groups of CNS tumors enriched for RB1 mutations (GBM_PNET, n = 19), NF1 mutations (HGAP, n = 87; PA_PF, n = 28; PA_MID, n = 41), and TP53 mutations (GBM, n = 77), as well as tumor types with similar histologic features (PXA, n = 79; AB_MN1, n = 46; PLNTY, n = 17). Two subtypes of HPAP, A and B, are readily distinguished. Hierarchical clustering of samples using the most variable probes and visualized across functionally important genomic regions (b). AB_MN1 astroblastoma with MN1-alteration; GBM glioblastoma (or MCF_GBM methylation class family is comprised of the v11 methylation classes GBM_MES GBM_RTK1 and GBM_RTK2); GBM_PNET glioblastoma with primitive neuroectodermal features; GG ganglioglioma; PLNTY polymorphous low-grade neuroepithelial tumor of the young; HGAP high-grade astrocytoma with piloid features; HPAP high-grade glioma with pleomorphic and pseudopapillary features; PA_MID pilocytic astrocytoma midline; PA_PF pilocytic astrocytoma posterior fossa; CGI CpG island; tss_distance distance to the transcriptional start site
Fig. 2
Fig. 2
Recurrent genetic alterations in HPAP compared to PXA (a). Alteration frequencies shown to the right of each oncoplot represent the proportion of alterations among those tumors that were sequenced/profiled for that gene. Genome-wide copy number plots generated from methylation data for HPAP (left) and PXA (right) demonstrating enrichment for monosomy 13 in HPAP (arrowhead) (b). Genome-wide plot of the results of proportion tests for binned copy number regions in HPAP vs. PXA (c); regions with a statistically significant difference in the frequency of copy number alterations are highlighted in light red (HPAP vs. PXA, top; HPAP vs. PLTNY, bottom). Abbreviation: VUS, variant of unknown significance
Fig. 3
Fig. 3
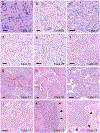
Spectrum of histologic patterns and morphology seen in this ► group. H&E-stained sections demonstrating markedly pleomorphic tumor nuclei and giant cell morphology (a, b) and an occasional monomorphic appearance with eosinophilic, gemistocytic-like cytoplasm (c). Other features included perinuclear clearing in tumor cells, similar to PLNTY (d, e) and an ependymoma-like perivascular arrangement of tumor cells (f). Pseudopapillary structures resembled astroblastoma in many cases (g–j). Tumors showed a predominantly non-infiltrative pattern of growth with identifiable borders (arrowheads) in many cases (k, l). Scale bars = 50 μm
Fig. 4
Fig. 4
Clinicopathologic features. Oncoprint illustrating the frequency of various histologic and immunophenotypic features across evaluable samples (a); the corresponding subtype determined by dimensionality reduction (UMAP) and results of the DKFZ machine learning classifier (v11) are annotated. The age distribution across the tumor types included in this study (b); significance levels (asterisks) are results from comparison with HPAP. Box plot of age comparing the two subtypes of HPAP (c). Pie charts showing the distribution of biologic sex among HPAP and its subtypes (d). Illustration of the neuroanatomic distribution (e). Kaplan–Meier curves demonstrating differences in overall survival among tumor types for which data was available (f); the risk table shows the sample sizes in each group and the p value for select comparisons from the log-rank test with HPAP. Abbreviations: EGB, eosinophilic granular bodies; GFAP, glial fibrillary acidic protein; EMA, epithelial membrane antigen; MVP, microvascular proliferation; ns = p > 0.05, *p ≤ 0.05, **p ≤ 0.01, ***p ≤ 0.001, ****p ≤ 0.0001
Fig. 5
Fig. 5
Differential methylation analysis. Volcano plots comparing differentially methylated probes between HPAP and PXA (top) and PLNTY (bottom) (a). The distribution of differentially methylated probes across CpG (b) and gene regions (c) for HPAP vs PXA (top) and HPAP vs PLNTY (bottom)

References

    1. Bady P, Delorenzi M, Hegi ME (2016) Sensitivity ANALYSIS OF THE MGMT-STP27 model and impact of genetic and epigenetic context to predict the mgmt methylation status in gliomas and other tumors. J Mol Diagn 18:350–361. 10.1016/j.jmoldx.2015.11.009 - DOI - PubMed
    1. Bady P, Sciuscio D, Diserens AC, Bloch J, van den Bent MJ, Marosi C et al. (2012) MGMT methylation analysis of glioblastoma on the Infinium methylation BeadChip identifies two distinct CpG regions associated with gene silencing and outcome, yielding a prediction model for comparisons across datasets, tumor grades, and CIMP-status. Acta Neuropathol 124:547–560. 10.1007/s00401-012-1016-2 - DOI - PMC - PubMed
    1. Bender K, Perez E, Chirica M, Onken J, Kahn J, Brenner W et al. (2021) High-grade astrocytoma with piloid features (HGAP): the Charite experience with a new central nervous system tumor entity. J Neurooncol 153:109–120. 10.1007/s11060-021-03749-z - DOI - PMC - PubMed
    1. Boisseau W, Euskirchen P, Mokhtari K, Dehais C, Touat M, Hoang-Xuan K et al. (2019) Molecular profiling reclassifies adult astroblastoma into known and clinically distinct tumor entities with frequent mitogen-activated protein kinase pathway alterations. Oncologist 24:1584–1592. 10.1634/theoncologist.2019-0223 - DOI - PMC - PubMed
    1. Capper D, Jones DTW, Sill M, Hovestadt V, Schrimpf D, Sturm D et al. (2018) DNA methylation-based classification of central nervous system tumours. Nature 555:469–474. 10.1038/nature26000 - DOI - PMC - PubMed

Substances