. 2022 Mar 8;7(5):e149094.
doi: 10.1172/jci.insight.149094.

Context-dependent induction of autoimmunity by TNF signaling deficiency

Affiliations

Context-dependent induction of autoimmunity by TNF signaling deficiency

Tam D Quach et al. JCI Insight. .

Abstract

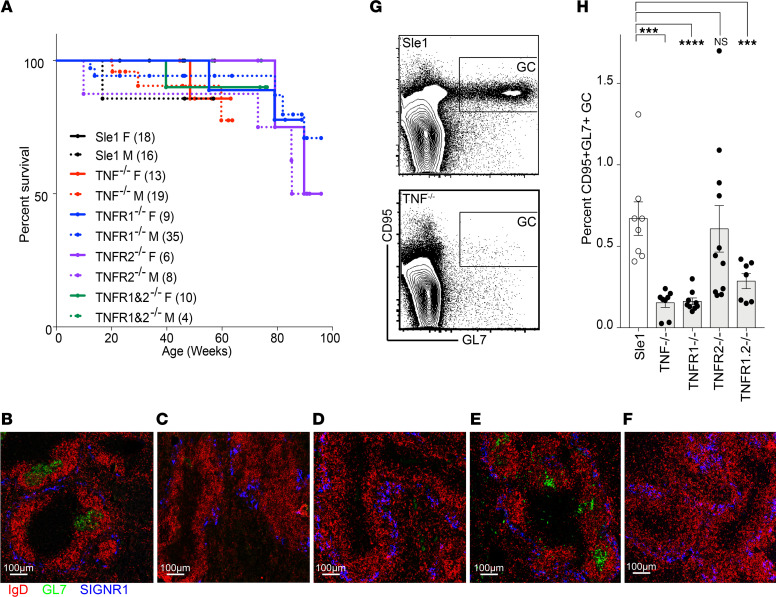
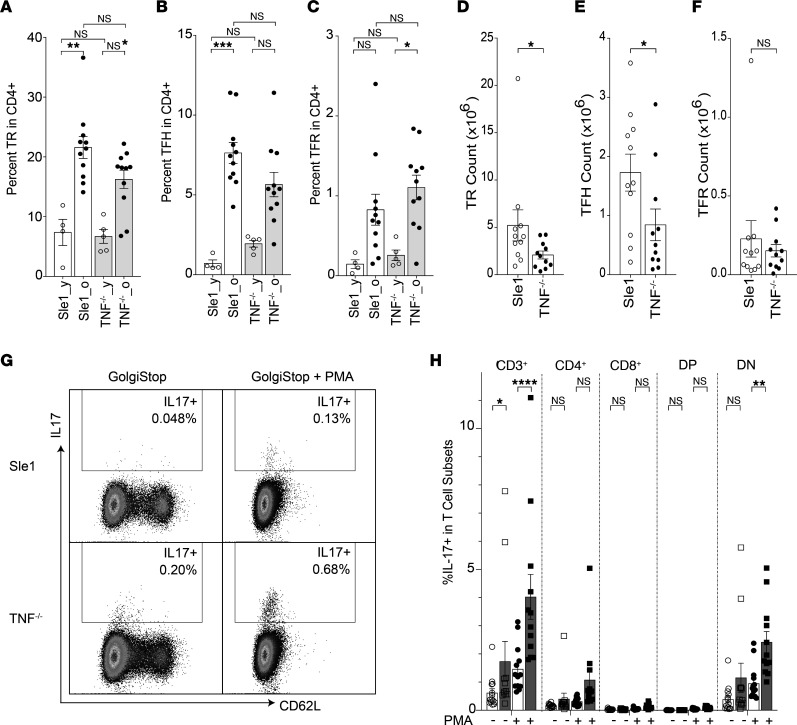
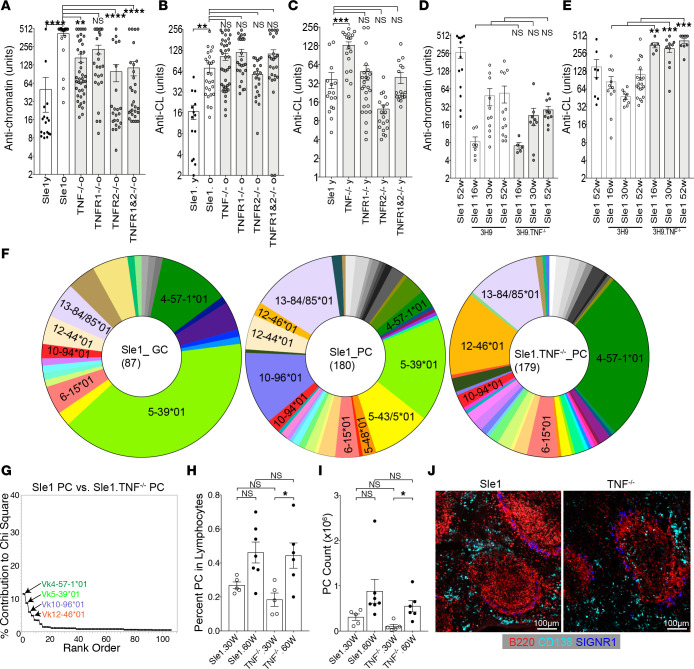
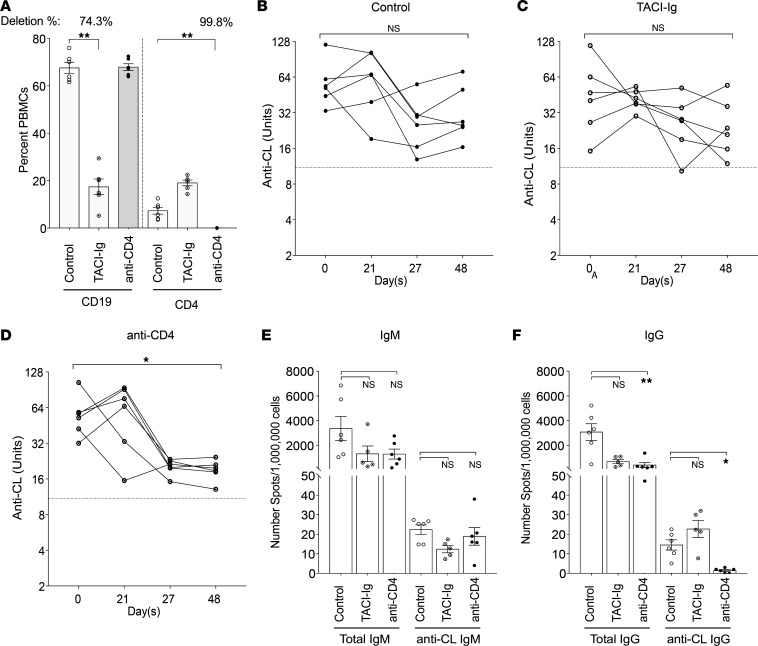
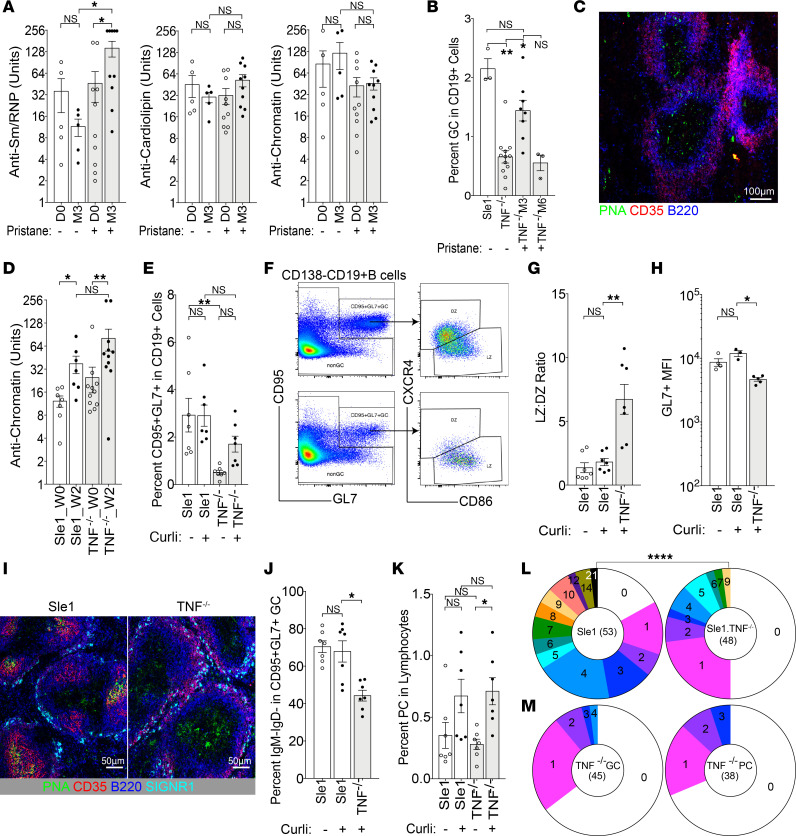
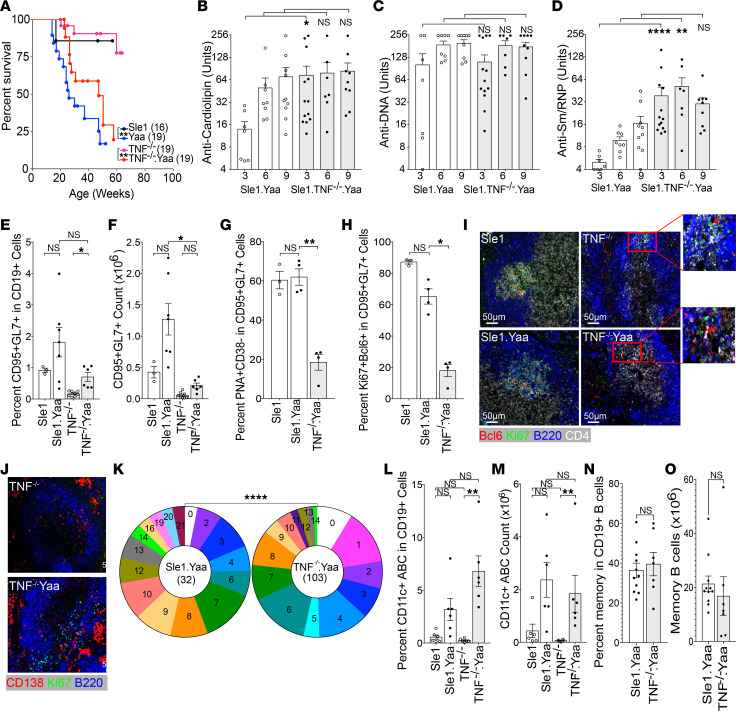
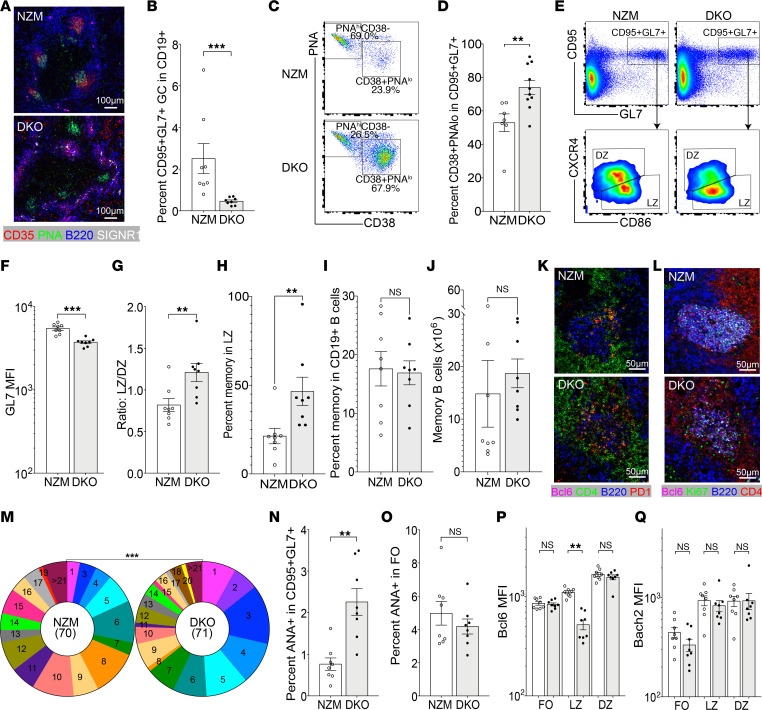
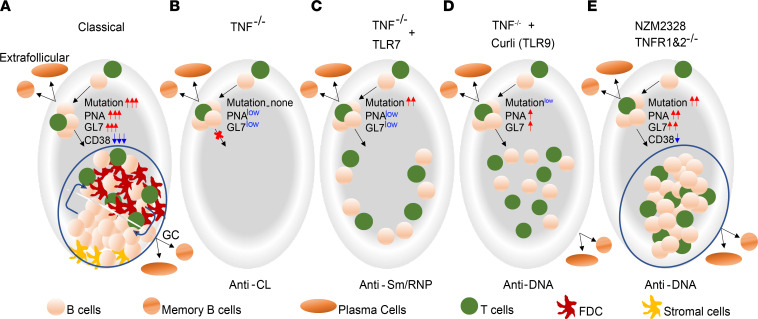
TNF inhibitors are widely used to treat inflammatory diseases; however, 30%-50% of treated patients develop new autoantibodies, and 0.5%-1% develop secondary autoimmune diseases, including lupus. TNF is required for formation of germinal centers (GCs), the site where high-affinity autoantibodies are often made. We found that TNF deficiency in Sle1 mice induced TH17 T cells and enhanced the production of germline encoded, T-dependent IgG anti-cardiolipin antibodies but did not induce GC formation or precipitate clinical disease. We then asked whether a second hit could restore GC formation or induce pathogenic autoimmunity in TNF-deficient mice. By using a range of immune stimuli, we found that somatically mutated autoantibodies and clinical disease can arise in the setting of TNF deficiency via extrafollicular pathways or via atypical GC-like pathways. This breach of tolerance may be due to defects in regulatory signals that modulate the negative selection of pathogenic autoreactive B cells.

Keywords: Autoimmune diseases; Immunology.


Conflict of interest statement

Conflict of interest: AD has received research support from Alpine Immune Sciences and is a member of its scientific advisory board.

Figures

Figure 1
Figure 1. TNF signaling via TNFR1 is required for GC formation.
(A) Survival curves of female and male Sle1 mice of the indicated genotype. Numbers of mice per group are indicated in parentheses. (BF) GC staining of >6-month-old Sle1 (B), Sle1 TNF–/– (C), Sle1 TNFR1–/– (D), Sle1 TNFR2–/– (E), and Sle1 TNFR1&2–/– (F) mice (original magnification, 10×), representative of 3–5 mice per group. (G) Flow plots show gating of splenic GC (CD95+GL7+) cells in CD19+ B cells from >9-month-old Sle1 (top) and Sle1 TNF–/– mice (bottom). (H) Bar graph shows the summary results of G. Dots on bar graphs represent individual mice. ANOVA Kruskal-Wallis with Dunn’s multiple comparisons test, *P < 0.05: **P < 0.01, ***P < 0.001, ****P < 0.0001. SIGNR1, CD209b.
Figure 2
Figure 2. Inflammatory effector T cells are enhanced in TNF-deficient mice.
(AC) Bar graphs show the percentage of Tregs (TR — CD3+CD4+Foxp3+) (A), TFH cells (CD3+CD4+PSGL1CD44+PD1hiBcl6hi) (B), and TFR cells (CD3+CD4+PSGL1CD44+PD1hiBcl6hiFoxp3+) (C) in CD4+ T cells of Sle1 and Sle1 TNF–/– mice (y, young, 2–3 months old; o, old, >8 months old). ANOVA Kruskal-Wallis with Dunn’s multiple comparisons test, *P < 0.05: **P < 0.01, ***P < 0.001. (DF) Summary results of TR, TFH, and TFR cell counts in old mice, Mann-Whitney nonparametric test, *P < 0.05. (G) Plots show IL-17 expression in CD4+ T cells with (+)/without (-) PMA stimulation from Sle1 and Sle1 TNF–/– mice. (H) Summary bar plot shows the percentage of IL-17+ T cells in total CD3+ and indicated T cell subsets with/without PMA stimulation. Sle1 mice are shown in unfilled symbols, and Sle1 TNF–/– mice are shown in filled symbols. Ordinary 2-way ANOVA with Tukey’s multiple comparisons test, *P < 0.05: **P < 0.01, ****P < 0.0001. DP, CD4+CD8+; DN, CD4CD8.
Figure 3
Figure 3. Altered autoantibody specificity in Sle1 TNF–/– and Sle1 TNFR1–/– mice.
(A and B) Bar graphs show the relative units of IgG antibodies against chromatin (A) and CL/β2GP1 (B) from sera of >9-month-old Sle1 mice of the indicated genotypes. (C) Bar graphs show the relative units of IgG antibodies against CL/β2GP1 from sera of 2- to 3-month-old Sle1 mice of the indicated genotypes. (D and E) Bar graphs show IgG antibodies against chromatin (D) and CL (E) from sera of 3H9 Sle1 and 3H9 Sle1 TNF–/– mice at sequential ages. (F) Pie charts show percentage of Igk light chain V region (Vk) gene usage in 3H9+ GC cells and plasma cells (PCs) from >9-month-old 3H9 Sle1 and PCs from 3H9 Sle1 TNF–/– mice. Fisher’s exact test rows × columns table, P < 0.0005. (G) Scree plot shows the percentage contribution to the χ2 analysis of the most overrepresented Vk genes in PCs of 3H9 Sle1 and 3H9 Sle1 TNF–/– mice. (H and I) Percentage (H) and number (I) of 3H9+ PCs from Sle1 and Sle1 TNF–/– mice at sequential ages. (J) Spleen CD138+ PCs are present in the extrafollicular region in >9-month-old Sle1 and Sle1 TNF–/– mice, representative of 3–5 mice per group. Dots on bar graphs represent individual mice. ANOVA Kruskal-Wallis with Dunn’s multiple comparisons test, *P < 0.05: **P < 0.01, ***P < 0.001, ****P < 0.0001. y, young (2–3 months); o, old (>9 months); w, weeks.
Figure 4
Figure 4. IgG anti-cardiolipin production in Sle1 TNF–/– mice is CD4 dependent.
(A) Percentage of CD19+ and CD4+ in total PBMCs from Sle1 TNF–/– mice after TACI-Ig or anti-CD4 treatment, Mann-Whitney nonparametric test, **P < 0.005. (BD) Changes in titers of serum IgG anti-cardiolipin antibodies in untreated (B) and TACI-Ig– (C) and anti-CD4– (D) treated mice. Dotted line represents the mean value for 5 C57BL/6 mice >9 months old. Repeated measures ANOVA Kruskal-Wallis, *P < 0.05. (E and F) ELISPOT assay shows number of spleen cells secreting IgM (E) and IgG (F) and total Ig and anti-cardiolipin antibodies. ANOVA Kruskal-Wallis with Dunn’s multiple comparisons test, *P < 0.05, **P < 0.005.
Figure 5
Figure 5. Innate stimulus induces activated GL7+ B cells and lupus-associated autoantibody production in Sle1 TNF–/– mice.
(A) Bar graphs show the relative units of IgG antibodies against Sm/RNP, CL, and chromatin (left to right) from sera of 12-week-old mice at day 0 (D0) and 3 months after (M3) pristane treatment. (B) Plot shows percentage of CD95+GL7+ cells in CD19+ B cells from pristane-treated mice. (C) Scattered PNA+ non–B cells are present in the T cell zone in Sle1 TNF–/– mice, 3 months after pristane treatment (original magnification, 10×). (D) Plot shows the relative units of IgG antibodies against chromatin in curli-treated mice. (E) Percentage of CD95+GL7+ cells from curli-treated mice. (F) Flow plots show the gating of splenic CD95+GL7+ B cells and their respective light zone (LZ) and dark zone (DZ) phenotype from Sle1 (top) and Sle1 TNF–/– mice (bottom). (G and H) Bar graphs show the summary result of LZ/DZ ratio (G) and GL7 expression (H). (I) PNA+ B cells are present in GCs in Sle1 mice and in the T cell zone of Sle1 TNF–/– mice, 6 weeks after curli treatment (original magnification, 20×). (J and K) Bar graph shows the percentage of IgMIgD cells in CD95+GL7+ B cells (J) and percentage of IgDCD138+ PCs in total live lymphocytes (K). (L) Pie charts show percentage of VH sequences with mutations from single CD95+GL7+ B cells in curli-treated Sle1 (left) and Sle1 TNF–/– (right) mice. Each slice represents the proportion of cells with the indicated number of mutations. χ2 analysis, ****P < 0.0001. Dots on bar graphs represent individual mice. (M) Pie charts show percentage of IGKV4-57-1*01 sequences with mutations from single CD95+GL7+ GCs (left) and CD138+ PCs (right) B cells in curli-treated 3H9 Sle1 TNF–/– mice. Each slice represents the proportion of cells with the indicated number of mutations. (A, B, D, E, G, H, J, and K) ANOVA Kruskal-Wallis with Dunn’s multiple comparisons test, *P < 0.05, **P < 0.01. Dots on bar graphs represent individual mice. Immunohistochemistry represents 3–5 mice per group.
Figure 6
Figure 6. TLR7 overexpression induces pathogenic autoantibodies in Sle1 TNF–/– mice.
(A) Survival plots of male Sle1 mice of the indicated genotypes. Log-rank test **P < 0.01. (BD) Plots show relative units of IgG antibodies against cardiolipin (B), DNA (C), and Sm/RNP (D) from sera of male Sle1 mice of the indicated genotype at 3, 6, and 9 months of age. (EH) Summary bar graphs of flow cytometry analysis. (E and F) Percentage and count of CD95+GL7+ cells in CD19+ B cells from male Sle1, Sle1 Yaa, Sle1 TNF–/–, and Sle1 Yaa TNF–/– mice. (G and H) Percentage of PNA+CD38 (G) and Ki67+Bcl6+ (H) cells in splenic CD95+GL7+ B cells. (I) Immunohistochemistry images (original magnification, 20×) show Ki67+Bcl6+ B cells in GCs of male Sle1 (top left) and Sle1 Yaa (bottom left) mice. Ki67+Bcl6+ B cells are located at the T-B border in the T cell zone of male Sle1 TNF–/– (top right) and Sle1 Yaa TNF–/– (bottom right) mice (representative of 3–4 mice per group). (J) Ki67+ cells are located in GCs in Sle1 Yaa mice and at the T-B border and in the bridging zones adjacent to extrafollicular foci in Sle1 Yaa TNF–/– mice. (K) Pie charts show mutation frequencies in VH sequences from CD138+ PCs from Sle1 Yaa (left) and Sle1 Yaa TNF–/– (right) mice. χ2, ****P < 0.0001. (L and M) Percentage and count of CD19+CD11c+ age-associated B cells (ABC) in male Sle1, Sle1 Yaa, Sle1 TNF–/–, and Sle1 Yaa TNF–/– mice. (N and O) Percentage and number of CCR6+CD38+ memory B cells in Sle1 Yaa and Sle1 Yaa TNF–/– mice. Dots on bar graphs represent individual mice. Immunohistochemistry representative of 3–5 mice per group. (BH, L, and M) ANOVA Kruskal-Wallis with Dunn’s multiple comparisons test, *P < 0.05: **P < 0.01, ***P < 0.001. (N and O) Mann-Whitney nonparametric test.
Figure 7
Figure 7. Atypical GCs in NZM2328 DKO mice.
(A) PNA+ GC clusters (original magnification, 10×) in NZM2328 mice (top) and PNA+ clusters without FDCs in DKO mice (bottom). (B). Percentage CD95+GL7+ B cells in CD19+ B cells in nephritic NZM and DKO mice. (C and D) CD95+GL7+ B cells include PNAhiCD38lo GC B cells and PNAloCD38+ memory cells. (E) Flow plots show the gating of splenic CD95+GL7+ B cells in CD19+ B cells from NZM and DKO mice and their LZ and DZ phenotype. (F and G) Bar graphs show the summary result of GL7 expression (F) and LZ/DZ ratio (G). (H) Percentage CCR6+CD38+ memory B cells in LZ CD95+GL7+CXCR4CD86+ compartment in NZM and DKO mice. (I and J) Percentage (I) and number (J) of CCR6+CD38+ memory B cells in NZM and DKO mice. (K) Immunohistochemistry images (original magnification, 20×) show PD1hiCD4+ T cells in DZ of GCs of NZM (top) and scattered throughout the GC cluster in DKO (bottom) mice. (L) Immunohistochemistry images (original magnification, 20×) show Ki67+Bcl6+ B cells in GCs of NZM (top) and DKO (bottom) mice (representative of 3–4 mice per group). (M) Pie charts show mutation frequencies in VH sequences from CD95+GL7+ B cells from NZM (left) and DKO (right) mice. χ2, ***P < 0.001. (N and O) Percentage ANA-positive B cells in CD95+GL7+ GC B cells (N) and follicular IgM+IgD+ B cells (O). (P and Q) Bar graphs show the summary result of Bcl6 (P) and Bach2 (Q) expression on CD95+GL7+ GC B cells. NZM mice (white bars); DKO mice (gray bars). Dots on bar graphs represent individual mice. Immunohistochemistry representative of 3–5 mice per group. (B, D, FJ, N, and O) Mann-Whitney nonparametric t test, **P < 0.01, ***P < 0.001. (P and Q) ANOVA Kruskal-Wallis with Dunn’s multiple comparisons test, **P < 0.01.
Figure 8
Figure 8. Model of diverse mechanisms for induction of autoreactivity by TNF deficiency.
(A) Typical GC in Sle1 mice. (B) TNF deficiency alone induces germline encoded autoantibodies from extrafollicular sites. (C) With TLR7 overexpression, a further breach of B cell tolerance occurs extrafollicularly; these autoreactive B cells are highly mutated and pathogenic. (D) TLR9 stimulus induces atypical, activated B cells that stay scattered in the T cell zone and have a low frequency of somatic mutations. (E) TNF deficiency in the NZM2328 model induces atypical GC clusters that are missing crucial negative signals that help to regulate autoreactivity. Activated autoreactive B cells in these atypical structures are highly mutated and are associated with accelerated disease onset.

References

    1. Hill CM, Lunec J. The TNF-ligand and receptor superfamilies: controllers of immunity and the Trojan horses of autoimmune disease? Mol Aspects Med. 1996;17(5):455–509. doi: 10.1016/S0098-2997(96)00011-8. - DOI - PubMed
    1. Chen G, Goeddel DV. TNF-R1 signaling: a beautiful pathway. Science. 2002;296(5573):1634–1635. doi: 10.1126/science.1071924. - DOI - PubMed
    1. Wallach D, et al. Tumor necrosis factor receptor and Fas signaling mechanisms. Annu Rev Immunol. 1999;17:331–367. doi: 10.1146/annurev.immunol.17.1.331. - DOI - PubMed
    1. Tartaglia LA, et al. The two different receptors for tumor necrosis factor mediate distinct cellular responses. Proc Natl Acad Sci U S A. 1991;88(20):9292–9296. doi: 10.1073/pnas.88.20.9292. - DOI - PMC - PubMed
    1. Fujii T, et al. The transmembrane form of TNF-alpha drives autoantibody production in the absence of CD154: studies using MRL/Mp-Fas(lpr) mice. Clin Exp Immunol. 2002;130(2):224–232. doi: 10.1046/j.1365-2249.2002.01982.x. - DOI - PMC - PubMed

Publication types