. 2022 Mar 8;7(5):e156314.
doi: 10.1172/jci.insight.156314.

High-throughput evaluation of epilepsy-associated KCNQ2 variants reveals functional and pharmacological heterogeneity

Affiliations

High-throughput evaluation of epilepsy-associated KCNQ2 variants reveals functional and pharmacological heterogeneity

Carlos G Vanoye et al. JCI Insight. .

Abstract

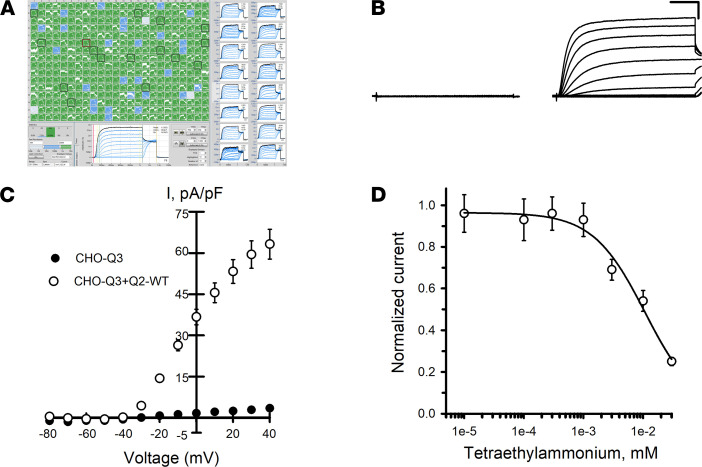
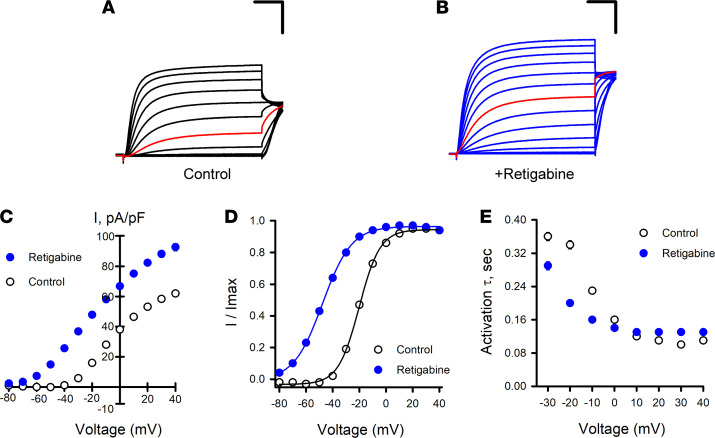
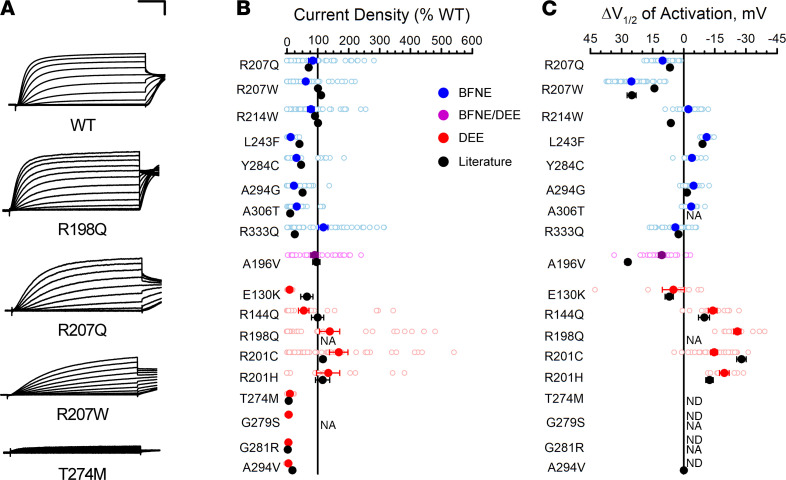
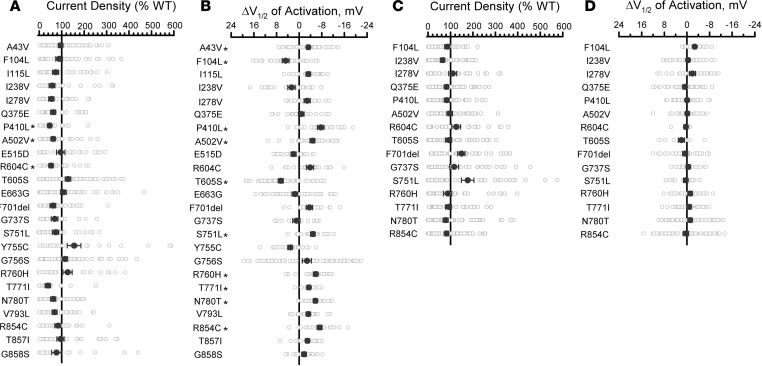
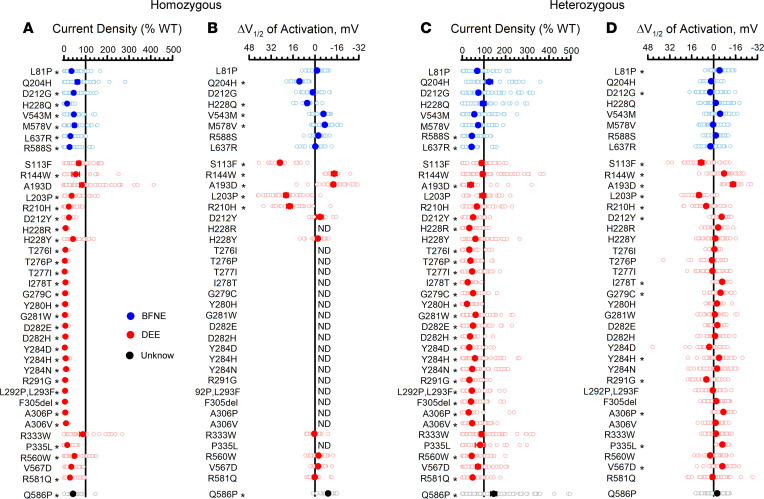
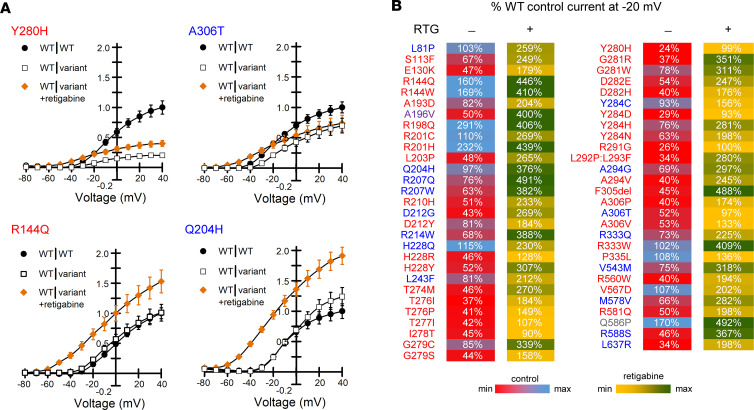
Hundreds of genetic variants in KCNQ2 encoding the voltage-gated potassium channel KV7.2 are associated with early onset epilepsy and/or developmental disability, but the functional consequences of most variants are unknown. Absent functional annotation for KCNQ2 variants hinders identification of individuals who may benefit from emerging precision therapies. We employed automated patch clamp recordings to assess at, to our knowledge, an unprecedented scale the functional and pharmacological properties of 79 missense and 2 inframe deletion KCNQ2 variants. Among the variants we studied were 18 known pathogenic variants, 24 mostly rare population variants, and 39 disease-associated variants with unclear functional effects. We analyzed electrophysiological data recorded from 9,480 cells. The functional properties of 18 known pathogenic variants largely matched previously published results and validated automated patch clamp for this purpose. Unlike rare population variants, most disease-associated KCNQ2 variants exhibited prominent loss-of-function with dominant-negative effects, providing strong evidence in support of pathogenicity. All variants responded to retigabine, although there were substantial differences in maximal responses. Our study demonstrated that dominant-negative loss-of-function is a common mechanism associated with missense KCNQ2 variants. Importantly, we observed genotype-dependent differences in the response of KCNQ2 variants to retigabine, a proposed precision therapy for KCNQ2 developmental and epileptic encephalopathy.

Keywords: Epilepsy; Genetics; Neuroscience; Pharmacology; Potassium channels.


Figures

Figure 1
Figure 1. Functional analysis of KCNQ2/KCNQ3 channels by automated patch clamp.
(A) Screen display from automated patch clamp experiment illustrating whole-cell current recordings from CHO-Q3 cells transiently expressing KCNQ2 variants (6 variants, 4 columns per variant). (B) Averaged XE991-sensitive whole-cell currents recorded from nontransfected CHO-Q3 cells and CHO-Q3 cells electroporated with WT KCNQ2. (C) Average current-voltage relationships measured from nontransfected (filled circles, n = 94) or KCNQ2-WT–transfected (open circles, n = 124) CHO-Q3 cells. Current recorded from each cell was normalized to cell capacitance as a surrogate for cell size to calculate current density (I, pA/pF). (D) Concentration-response relationship for TEA block of whole-cell currents recorded from CHO-Q3 electroporated with KCNQ2-WT (IC50 = 10.7 ± 4.2 mM, n = 51–82 for each concentration). Data shown in C and D are mean ± SEM (error bars are smaller than some data symbols). Scale bars: 200 ms (horizontal); 20 pA/pF (vertical).
Figure 2
Figure 2. Effects of retigabine on KCNQ2/KCNQ3 channel activity.
(A) Averaged XE991-sensitive whole-cell currents normalized by membrane capacitance recorded from CHO-Q3 cells electroporated with KCNQ2-WT exposed to control or (B) exposed to 10 μM retigabine solutions. Red lines indicate currents recorded at –20 mV. (C) Average current-voltage relationships measured from CHO-Q3 cells electroporated with KCNQ2-WT exposed to control (open circles, n = 1086) or retigabine (filled blue circles, n = 1141) solutions. (D) Voltage-dependence of activation measured in control (open circles, black lines) or retigabine (filled blue circles, blue lines) solutions (control: V½ = –18.9 ± 0.2, k = 7.6 ± 0.1, n = 833; retigabine: V½ = –47.7 ± 0.3, k = 9.9 ± 0.1, n = 885). (E) Activation time constants measured in control (open circles, n =525–970) or retigabine (filled blue circles, n = 1036–1079) solutions. Scale bars: 200 ms (horizontal); 20 pA/pF (vertical). Data shown in C–E are mean ± SEM (error bars are smaller than some data symbols).
Figure 3
Figure 3. Functional properties of homozygous KCNQ2 variants determined by automated patch recording are comparable to those from previous voltage-clamp studies.
(A) Examples of averaged XE991-sensitive whole-cell currents recorded by automated patch clamp from CHO-Q3 cells electroporated with select KCNQ2 variants. Current values were normalized to WT channel peak current that was measured in parallel. Scale bars: 200 ms (horizontal); 25% (vertical). (B) Average peak whole-cell currents recorded at +40 mV from cells coexpressing KCNQ3 and KCNQ2 variants displayed as percent of WT channel that was measured in parallel. (C) Difference in activation V½ determined for cells coexpressing KCNQ3 and KCNQ2 variants relative to WT channel (horizontal scaling was designed to show loss-of-function in the leftward direction from zero). All experimental data are presented in B and C as open circles with filled circles representing mean values. Black symbols represent mean ± SEM voltage-clamp data from literature reported variants (error bars are smaller than data symbol in some cases), while automated patch clamp results are shown as blue for BFNE, red for DEE, or purple symbols for BFNE/DEE pathogenic variants. NA, not available; ND, cannot be determined.
Figure 4
Figure 4. Functional properties of KCNQ2 population variants.
(A) Average whole-cell currents recorded at +40 mV expressed as percent of the WT channel (n = 22–71). KCNQ2 variants were expressed in the homozygous state in CHO-Q3 cells. (B) Differences in activation V½ (n = 15–60) relative to the WT channel determined for KCNQ2 population variants. Full data sets for A and B are provided in Supplemental Table 3. (C) Average whole-cell currents recorded at +40 mV (n = 27–71) for select population variants expressed in the heterozygous state in CHO-Q3 cells. Only variants exhibiting significantly different properties from WT in the homozygous state were examined. (D) Differences in activation V½ (n = 9–59) relative to the WT channel determined for select population variants expressed in the heterozygous state. All experimental data are presented as open circles with filled circles representing mean values. Statistical significance was determined by 1-way ANOVA. *P ≤ 0.01. Full data sets for C and D are provided in Supplemental Table 4.
Figure 5
Figure 5. Functional properties of epilepsy-associated KCNQ2 variants.
(A) Average whole-cell currents recorded at +40 mV from CHO-Q3 cells electroporated with epilepsy-associated KCNQ2 variants expressed in the homozygous state displayed as percent of the WT channel measured in parallel (n = 16–75). (B) Differences in activation V½ determined for disease-associated variant channels expressed in the homozygous state and quantified relative to the WT channel measured in parallel (n = 7–41). (C) Average whole-cell currents recorded at +40 mV for epilepsy-associated KCNQ2 variants expressed in the heterozygous state quantified relative to the WT channel measured in parallel (n = 19–84). (D) Differences in activation V½ determined for epilepsy-associated KCNQ2 variants expressed in the heterozygous state relative to the WT channel measured in parallel (n = 13–69). All experimental data are presented as open circles with larger filled circles representing mean values. Blue symbols indicate variants associated with BFNE, red symbols are variants associated with DEE, and the black symbols represent a variant with an unclear phenotype. ND, cannot be determined. Statistical significance was determined using 1-way ANOVA. *P ≤ 0.01. Full data sets are provided in Supplemental Table 3 (homozygous) and Supplemental Table 4 (heterozygous).
Figure 6
Figure 6. Responses of epilepsy-associated KCNQ2 variants to retigabine.
(A) Representative current-voltage relationships comparing WT (WT|WT, filled circles) and heterozygous variant (WT|variant, open squares) channel function in the absence of retigabine with heterozygous variant function measured in the presence of 10 μM retigabine (WT|variant +retigabine, orange filled diamonds). Current amplitude was first normalized to cell capacitance, then normalized to the WT current density measured at +40 mV. Variant labels are color coded by phenotype (blue, BFNE; red, DEE; purple, BFNE/DEE; gray, unclear phenotype). Data shown are mean ± SEM (error bars are smaller than some data symbols). (B) Heat map summarizing retigabine response data. Control values are current density measured at –20 mV for heterozygous variants in the absence of retigabine expressed as a percentage of untreated WT channel current density (Supplemental Table 5). Retigabine values are current density measured at –20 mV for heterozygous variants in the presence of 10 μM retigabine and expressed as a percentage of untreated WT channel current density (Supplemental Table 6). Each value is colored based on the scale shown.

References

    1. Shellhaas RA, et al. Profile of neonatal epilepsies: characteristics of a prospective US cohort. Neurology. 2017;89(9):893–899. doi: 10.1212/WNL.0000000000004284. - DOI - PMC - PubMed
    1. Meisler MH, et al. Author correction: sodium channelopathies in neurodevelopmental disorders. Nat Rev Neurosci. 2021;22(4):256. - PubMed
    1. Allen NM, et al. Genetic potassium channel-associated epilepsies: clinical review of the K v family. Eur J Paediatr Neurol. 2020;24:105–116. doi: 10.1016/j.ejpn.2019.12.002. - DOI - PubMed
    1. Symonds JD, et al. Incidence and phenotypes of childhood-onset genetic epilepsies: a prospective population-based national cohort. Brain. 2019;142(8):2303–2318. doi: 10.1093/brain/awz195. - DOI - PMC - PubMed
    1. EpiPM Consortium. A roadmap for precision medicine in the epilepsies. Lancet Neurol. 2015;14(12):1219–1228. doi: 10.1016/S1474-4422(15)00199-4. - DOI - PMC - PubMed

Substances