. 2022 Mar;603(7902):700-705.
doi: 10.1038/s41586-022-04462-1. Epub 2022 Feb 1.

Attenuated fusogenicity and pathogenicity of SARS-CoV-2 Omicron variant

Collaborators, Affiliations

Attenuated fusogenicity and pathogenicity of SARS-CoV-2 Omicron variant

Rigel Suzuki et al. Nature. 2022 Mar.

Abstract

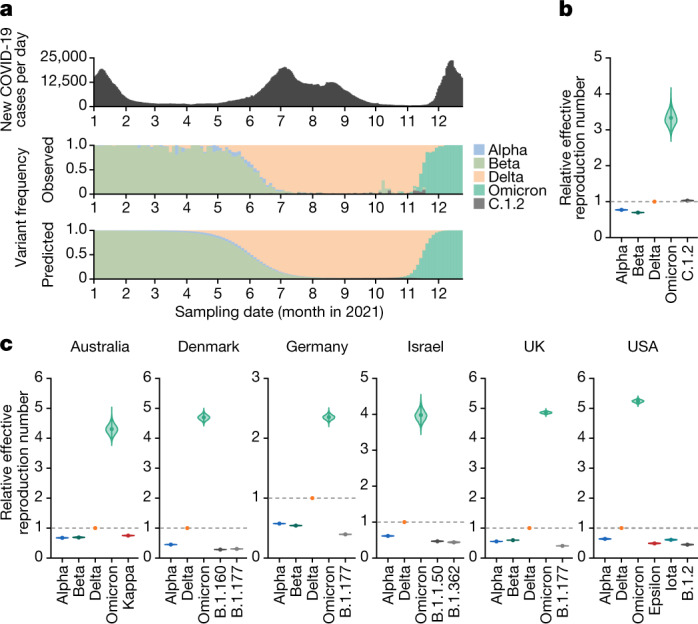
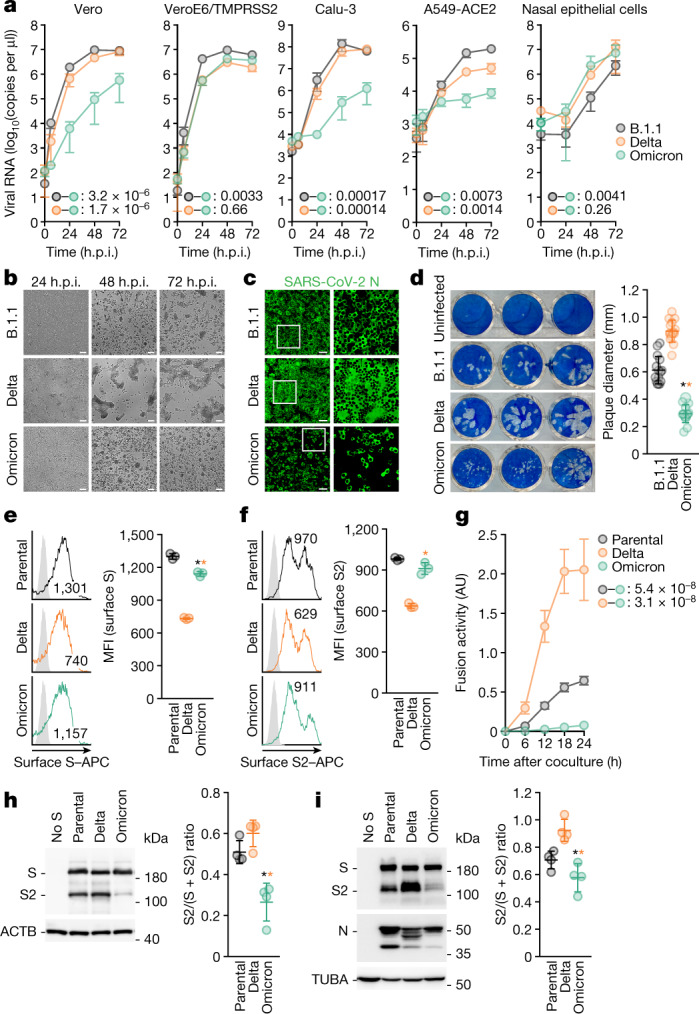
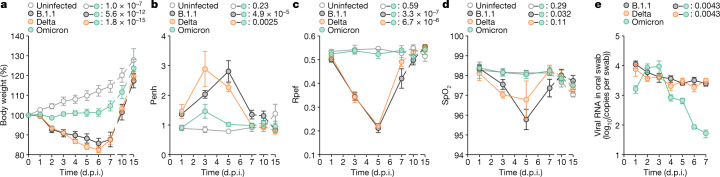
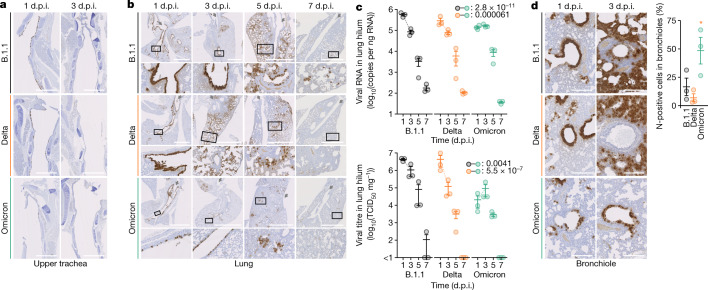
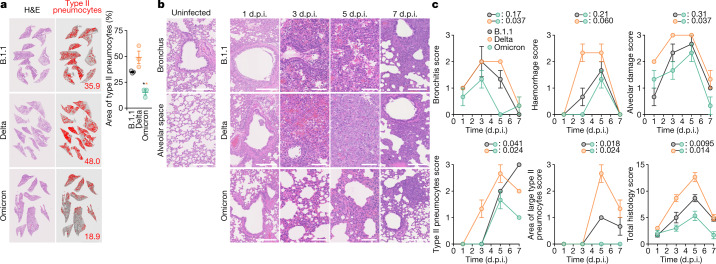
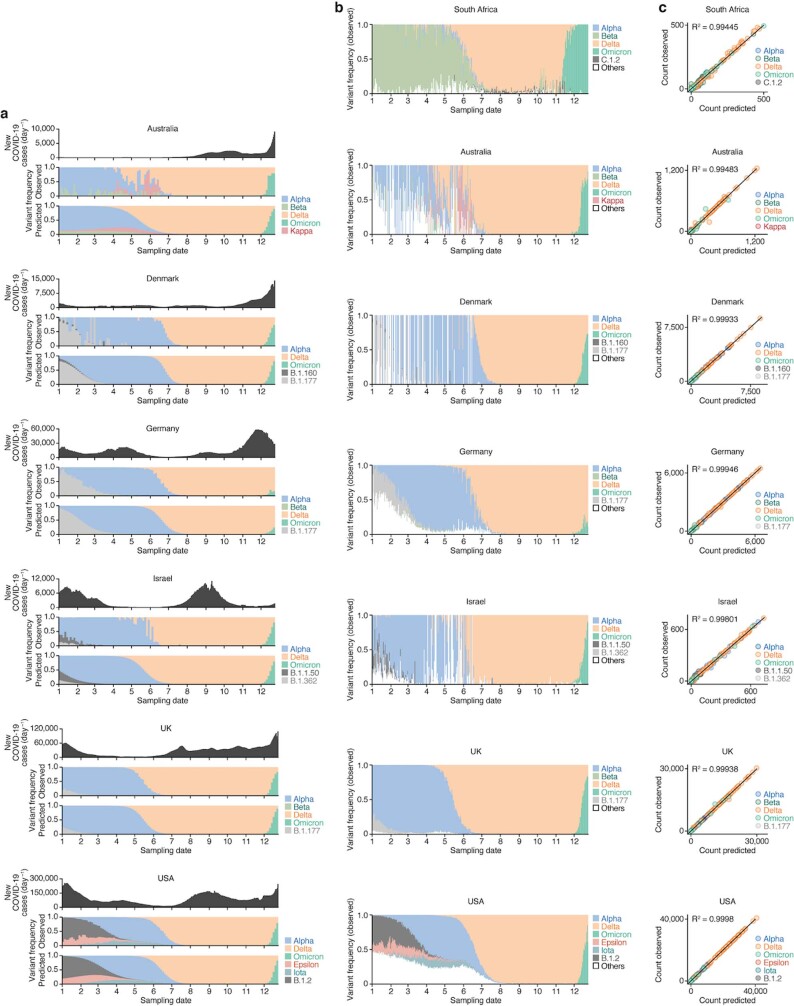
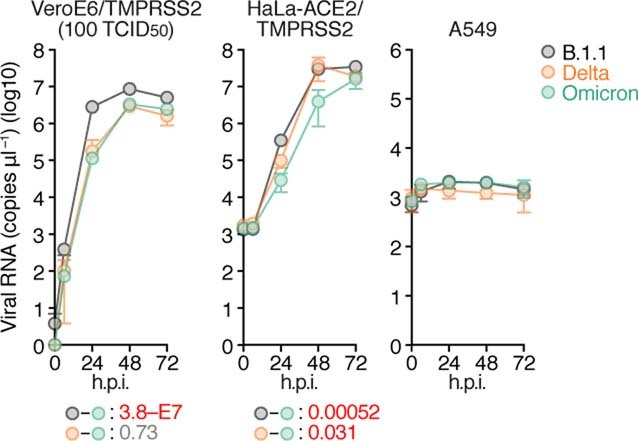
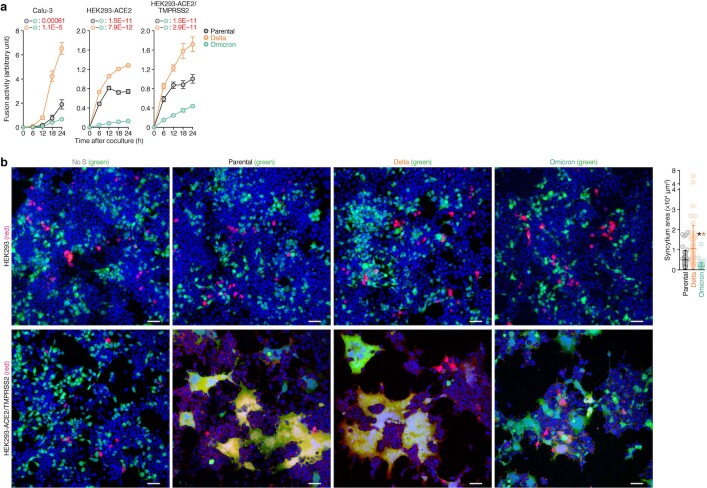
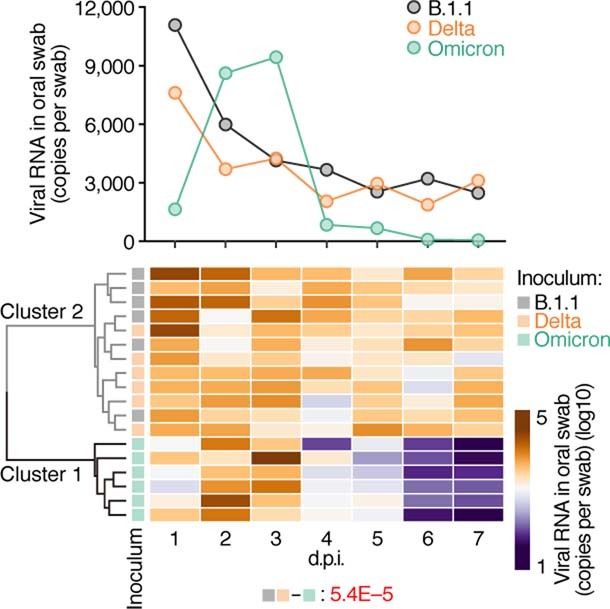
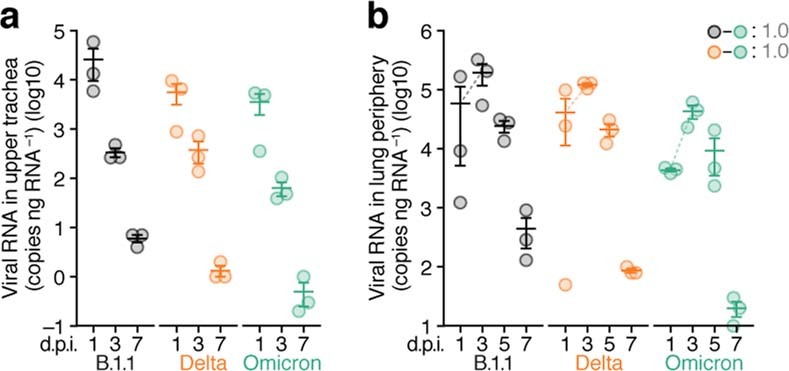
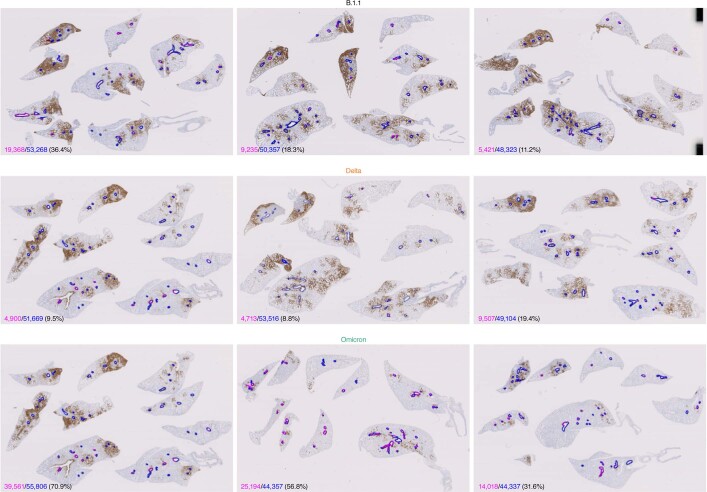
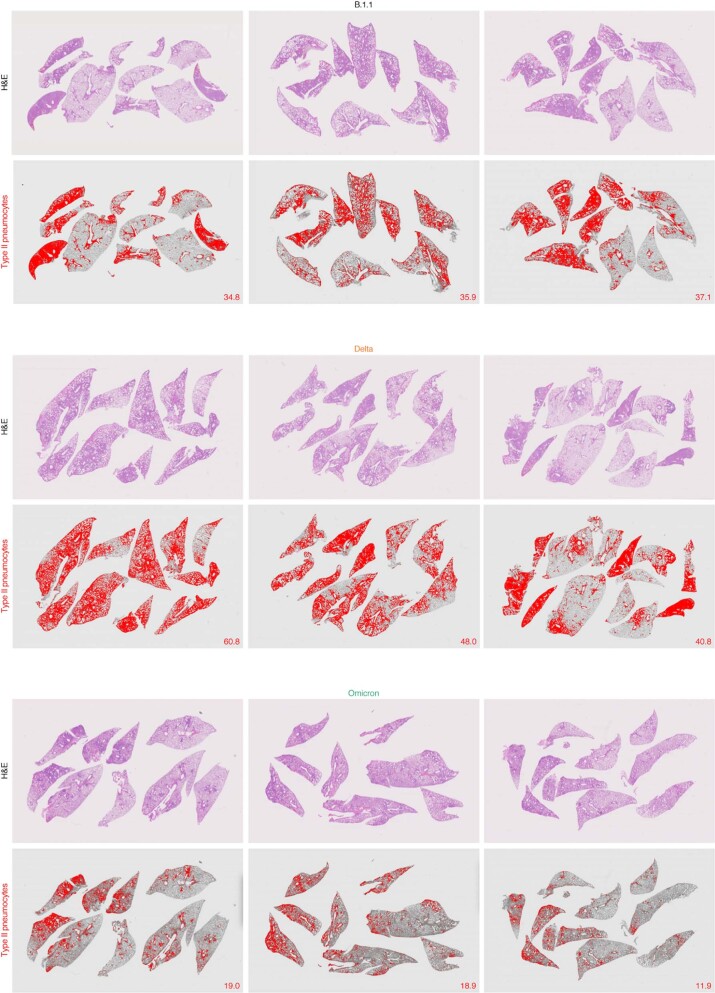
The emergence of the Omicron variant of SARS-CoV-2 is an urgent global health concern1. In this study, our statistical modelling suggests that Omicron has spread more rapidly than the Delta variant in several countries including South Africa. Cell culture experiments showed Omicron to be less fusogenic than Delta and than an ancestral strain of SARS-CoV-2. Although the spike (S) protein of Delta is efficiently cleaved into two subunits, which facilitates cell-cell fusion2,3, the Omicron S protein was less efficiently cleaved compared to the S proteins of Delta and ancestral SARS-CoV-2. Furthermore, in a hamster model, Omicron showed decreased lung infectivity and was less pathogenic compared to Delta and ancestral SARS-CoV-2. Our multiscale investigations reveal the virological characteristics of Omicron, including rapid growth in the human population, lower fusogenicity and attenuated pathogenicity.


Conflict of interest statement

The authors declare no competing interests.

Figures

Fig. 1
Fig. 1. Epidemic dynamics of Omicron.
a, Top, the seven-day average of new COVID-19 cases reported per day. Middle, the frequency of the top five viral lineages in the sequenced samples. Bottom, the frequency of the top five viral lineages predicted by our Bayesian statistical model. The data are from South Africa, from 1 January 2021 to 24 December 2021. The lineage frequency (middle and bottom) is summarized in three-day bins. The frequencies of all viral lineages are shown in Extended Data Fig. 1. b, c, Estimation of the relative effective reproduction number of each viral lineage, assuming a fixed generation time of 5.5 days. Values are shown relative to Delta (the Delta value is set at 1) in South Africa (b) and other six countries (Australia, Denmark, Germany, Israel, the UK and the USA) (c). The posterior distribution (violin), posterior mean (dot) and 95% credible interval (bar) are indicated.
Fig. 2
Fig. 2. Virological features of Omicron in vitro.
a, Growth kinetics of Omicron. B.1.1 virus, Delta and Omicron were inoculated into cells, and the copy number of the viral RNA in the supernatant was quantified by quantitative PCR with reverse transcription (RT–qPCR). b, Bright-field images of infected VeroE6/TMPRSS2 cells (multiplicity of infection (m.o.i.) of 0.01). c, Immunofluorescence staining. Infected VeroE6/TMPRSS2 cells (m.o.i. = 0.01) at 24 h.p.i. were stained with anti-SARS-CoV-2 N antibody. Higher-magnification views of the regions indicated by squares are shown on the right. Scale bars, 100 μm (b, c). d, Plaque assay. Left, representative figures. Right, summary of the diameter of plaques (15 plaques per virus). e, f, Expression of the S protein on the cell surface. Left, representative histogram stained with anti-S1/S2 polyclonal antibody (e) or anti-S2 monoclonal antibody (f). The number in the histogram indicates the mean fluorescence intensity (MFI). Grey histograms indicate isotype controls. Right, summary of the surface S MFI. g, SARS-CoV-2 S-based fusion assay. The fusion activity was measured as described in the Methods, and fusion activity (arbitrary units; AU) is shown. h, i, Left, representative western blots of S-expressing cells (h) or SARS-CoV-2-infected VeroE6/TMPRSS2 cells (m.o.i. = 0.01) at 48 h.p.i. (i). ACTB (h) or TUBA (i) are internal controls. Right, the ratio of S2 to the full-length S plus S2 proteins. Data are mean ± s.d. (a, di). Assays were performed in quadruplicate (a, gi) or triplicate (ef). Each dot indicates the result from an individual plaque (d) and an individual replicate (e, f, h, i). Statistically significant differences versus B.1.1 and Delta through time points were determined by multiple regression (a, g). Familywise error rates (FWERs) calculated using the Holm method are indicated. Statistically significant differences (*P < 0.05) versus B.1.1 and Delta were determined by two-sided Mann–Whitney U-test (d) or by two-sided paired Student’s t-test (e, f, h, i) without adjustment for multiple comparisons.
Fig. 3
Fig. 3. Time-course dynamics of Omicron in vivo.
Syrian hamsters were intranasally inoculated with saline (n = 6, uninfected control), B.1.1 (n = 6), Delta (n = 6) or Omicron (n = 6). Six hamsters of the same age were mock-infected. Body weight (a), Penh (b), Rpef (c), SpO2 (d) and viral RNA load in oral swabs (e) were routinely measured. Data are mean ± s.e.m. In ad, statistically significant differences versus B.1.1 and Delta through time points were determined by multiple regression. In e, statistically significant differences of the dynamics versus B.1.1 and Delta were determined by a permutation test. FWERs calculated using the Holm method are indicated. Source data
Fig. 4
Fig. 4. Virological features of Omicron in vivo.
Syrian hamsters were intranasally inoculated with B.1.1 (n = 3), Delta (n = 3) or Omicron (n = 3). a, b, IHC of the SARS-CoV-2 N protein in the upper trachea and the lungs of infected hamsters. Representative IHC panels of the viral N proteins in the upper part of the trachea from the oral entrance at the vertical levels of thyroid cartilage (a) and the lungs (b) of infected hamsters. Grey arrows in b indicate the bronchus of each lung lobe, and higher-magnification views of the regions indicated by squares are shown at the bottom. Scale bars, 1 mm (a); 2.5 mm (b). c, Quantification of viral RNA load (top) and viral titre (50% tissue culture infectious dose (TCID50); bottom) in the lung hilum. Broken lines indicate the slopes between 1 and 3 d.p.i. d, IHC of viral N protein in the bronchioles in the vicinity of the lung hilum. Left, representative IHC panels of the viral N proteins. Scale bars, 250 μm. Right, percentage of N-positive cells in bronchiole at 3 d.p.i. Values were measured as described in the Methods. Raw data are shown in Extended Data Fig. 7. In c, d, data are mean ± s.e.m., and each dot indicates the result from an individual hamster. Statistically significant differences of the slopes were determined by a likelihood-ratio test comparing the models with or without the interaction term of time point and inoculum. FWERs calculated using the Holm method are indicated. In d, statistically significant differences (*P < 0.05) versus B.1.1 and Delta were determined by two-sided unpaired Student’s t-tests without adjustment for multiple comparisons. Source data
Fig. 5
Fig. 5. Pathological features of Omicron.
Syrian hamsters were intranasally inoculated with B.1.1 (n = 3), Delta (n = 3) or Omicron (n = 3). a, b, Histopathological features of lung lesions. Lung sections from infected hamsters were stained with haematoxylin and eosin (H&E). a, Section of all four lung lobes at 5 d.p.i. In the middle panels, the inflammatory area with type II pneumocytes is indicated in red. The number in the panel indicates the percentage of the section represented by the indicated area. Right, summary of the percentage of the section represented by type II pneumocytes (3 hamsters per group). Raw data are shown in Extended Data Fig. 8. b, H&E staining of the lungs of infected hamsters. Uninfected lung alveolar space and bronchioles are shown (left). Scale bars, 250 μm (uninfected lung alveolar space and bronchioles and infected hamsters at 1 and 7 d.p.i.); 100 μm (infected hamsters at 3 and 5 d.p.i.). c, Histopathological scoring of lung lesions. Representative pathological features are shown in our previous study. Data are mean ± s.e.m. (a, c). In a, each dot indicates the result from an individual hamster. Statistically significant differences (*P < 0.05) versus B.1.1 and Delta were determined by two-sided unpaired Student’s t-tests without adjustment for multiple comparisons. In c, statistically significant differences versus B.1.1 and Delta through time points were determined by multiple regression. FWERs calculated using the Holm method are indicated. Source data
Extended Data Fig. 1
Extended Data Fig. 1. Epidemic dynamics of SARS-CoV-2 lineages in seven countries.
a, The 7-day average of new COVID-19 cases reported per day (top), the frequency of the top five (Australia, Denmark, Germany, Israel, and the UK) or six (the USA) viral lineages in the sequenced samples (middle), and the frequency of the viral lineages predicted by our Bayesian statistical model (bottom) are shown. The data in the six countries are from January 1, 2021, to December 24, 2021. The lineage frequency (middle and bottom) is summarized in three-day bins. b, The daily frequency of the predominant lineages and other lineages in the seven countries (South Africa, Australia, Denmark, Germany, Israel, the UK and the USA) per day are shown. Unlike Fig. 1a and Extended Data Fig. 1a, the frequency of viral lineages other than the top five (for Australia, Denmark, Germany, Israel, and the UK) or six (for the USA) lineages are included. c, Comparison of observed and predicted counts of each viral lineage in each time bin. The results in the seven countries indicated are shown. The coefficient of determination (R2) and the line y = x are shown. Each dot indicates the result of each viral lineage at each time point.
Extended Data Fig. 2
Extended Data Fig. 2. Growth of Omicron, Delta and B.1.1 in different cells.
A D614G-bearing B.1.1 virus, Delta and Omicron [100 TCID50 (m.o.i. = 0.01) for VeroE6/TMPRSS2 cells, 1,000 TCID50 (m.o.i. = 0.1) for HeLa-ACE2/TMPRSS2 cells and A549 cells] were inoculated into cells, and the viral RNA copy number in the supernatant was quantified by RT–qPCR. Assays were performed in quadruplicate. Data are mean ± s.d. In the data of VeroE6/TMPRSS2 cells (left) and HeLa-ACE2/TMPRSS2 cells (middle), statistically significant differences versus B.1.1 and Delta through time points were determined by multiple regression. FWERs calculated using the Holm method are indicated in the figures.
Extended Data Fig. 3
Extended Data Fig. 3. Cell–cell fusion mediated by the SARS-CoV-2 S protein.
a, SARS-CoV-2 S-based fusion assay. Effector cells (S-expressing cells) and target cells (Calu-3 cells, HEK293-ACE2 cells and HEK293-ACE2/TMPRSS2 cells) were prepared, and the fusion activity was measured as described in the Methods. Assays were performed in quadruplicate, and fusion activity (arbitrary units) is shown. b, Coculture of S-expressing cells with HEK293-ACE2/TMPRSS2 cells. Left, representative images of S-expressing cells (green) cocultured with HEK293 cells (red, top) or HEK293-ACE2/TMPRSS2 cells (red, bottom). Nuclei were stained with Hoechst33342 (blue). Scale bars, 50 μm. Right, the size distributions of syncytia (yellow) in the HEK293-ACE2/TMPRSS2 cultures cocultured with the cells expressing the parental D614G S (50 yellow syncytia), Delta S (54 yellow syncytia) or Omicron S (58 yellow syncytia). Data are mean ± s.d. In a, statistically significant differences versus B.1.1 and Delta through time points were determined by multiple regression. FWERs calculated using the Holm method are indicated in the figures. In b, each dot indicates the result from an individual yellow syncytium. Statistically significant differences (*P < 0.05) versus B.1.1 (a black asterisk) and Delta (an orange asterisk) were determined by two-sided Mann–Whitney U-test.
Extended Data Fig. 4
Extended Data Fig. 4. Dynamics of viral RNA load in oral swabs of infected hamsters.
The mean of viral RNA load in the oral swab (copies per swab) among infected hamsters at each time point is shown by a line plot in a linear scale (top), and the value in each infected hamster is shown by a heat map in a log scale (bottom). The result of the hierarchical clustering analysis is shown on the left of the heat map. The association between the clustering result and Omicron-infected hamsters was examined by two-sided Fisher’s exact test, and the P value is indicated in the figure.
Extended Data Fig. 5
Extended Data Fig. 5. Quantification of viral RNA.
Syrian hamsters were intranasally inoculated with B.1.1 (n = 3), Delta (n = 3) and Omicron (n = 3). Viral RNA levels in the upper trachea (a) and lung periphery (b) were quantified by RT–qPCR. Data are mean ± s.e.m., and each dot indicates the result from an individual hamster. In b, the broken lines indicate the slopes of the average values between 1 d.p.i. and 3 d.p.i. Statistically significant differences of the slopes were determined by a likelihood-ratio test comparing the models with or without the interaction term of time point and inoculum. FWERs calculated using the Holm method are indicated in the figures. Source data
Extended Data Fig. 6
Extended Data Fig. 6. Analysed regions of the lung.
The entire lung (left) and a coronal section of the right lung and its cut surface (right) are shown. In the left panel, four lung lobes, the upper (anterior/cranial) lobe (U), milled lobe (M), lower (posterior/caudal) lobe (L) and accessory lobe (A), are respectively indicated. Arrow indicates the main bronchus. The hilum and periphery of the lung, which were used for the viral RNA quantification and titration (Fig. 4c and Extended Data Fig. 5b), are also indicated in yellow.
Extended Data Fig. 7
Extended Data Fig. 7. Morphometrical analysis of N-protein-positive bronchioles.
All four lobes of the right lung of infected hamsters (n = 3 for each virus) at 3 d.p.i. were immunohistochemically stained with anti-SARS-CoV-2 N monoclonal antibody. The circumference of all bronchioles (less than 500 µm diameter) is delineated in blue, and the positivity of N protein in bronchiole is indicated by magenta. Each length is indicated in the lower left of the panel by each colour. The number in parenthesis indicates the percentage of the N-positive bronchioles in the circumference of all bronchioles. The summarized result is shown in the right panel of Fig. 4d.
Extended Data Fig. 8
Extended Data Fig. 8. Type II pneumocytes in the lungs of infected hamsters.
Lung lobes of the hamsters infected with B.1.1 (top, n = 3), Delta (middle, n = 3), and Omicron (bottom, n = 3) at 5 d.p.i. In each panel, H&E staining (top) and the digitalized inflammation area (bottom, indicated in red) are shown. The number in the panel of the digitalized inflammation area indicates the percentage of the section represented by the indicated area (that is, the area indicated with red colour per the total area of the lung lobes). Note that the panels in the middle column are identical to those shown in Fig. 5a.

Comment in

References

    1. WHO. Classification of Omicron (B.1.1.529): SARS-CoV-2 variant of concern; https://www.who.int/news/item/26-11-2021-classification-of-omicron-(b.1.... (2021).
    1. Saito, A. et al. Enhanced fusogenicity and pathogenicity of SARS-CoV-2 Delta P681R mutation. Nature10.1038/s41586-021-04266-9 (2021). - PMC - PubMed
    1. Mlcochova P, et al. SARS-CoV-2 B.1.617.2 Delta variant replication and immune evasion. Nature. 2021;599:114–119. doi: 10.1038/s41586-021-03944-y. - DOI - PMC - PubMed
    1. WHO. Tracking SARS-CoV-2 variants; https://www.who.int/en/activities/tracking-SARS-CoV-2-variants (2021).
    1. Liu, Y. et al. The N501Y spike substitution enhances SARS-CoV-2 infection and transmission. Nature10.1038/s41586-021-04245-0 (2021). - PMC - PubMed

Publication types

MeSH terms

Substances

Supplementary concepts