. 2022 Mar;603(7902):706-714.
doi: 10.1038/s41586-022-04474-x. Epub 2022 Feb 1.

Altered TMPRSS2 usage by SARS-CoV-2 Omicron impacts infectivity and fusogenicity

Bo Meng #  1   2 Adam Abdullahi #  1   2 Isabella A T M Ferreira #  1   2 Niluka Goonawardane #  1   2 Akatsuki Saito #  3 Izumi Kimura #  4 Daichi Yamasoba #  4 Pehuén Pereyra Gerber  1   2 Saman Fatihi  5 Surabhi Rathore  5 Samantha K Zepeda  6 Guido Papa  7 Steven A Kemp  1   2 Terumasa Ikeda  8 Mako Toyoda  9 Toong Seng Tan  9 Jin Kuramochi  10 Shigeki Mitsunaga  11 Takamasa Ueno  9 Kotaro Shirakawa  12 Akifumi Takaori-Kondo  12 Teresa Brevini  2 Donna L Mallery  7 Oscar J Charles  13 CITIID-NIHR BioResource COVID-19 CollaborationGenotype to Phenotype Japan (G2P-Japan) ConsortiumEcuador-COVID19 ConsortiumJohn E Bowen  6 Anshu Joshi  6 Alexandra C Walls  6   14 Laurelle Jackson  15 Darren Martin  16 Kenneth G C Smith  1   2 John Bradley  2 John A G Briggs  17 Jinwook Choi  18 Elo Madissoon  19   20 Kerstin B Meyer  19 Petra Mlcochova  1   2 Lourdes Ceron-Gutierrez  21 Rainer Doffinger  21 Sarah A Teichmann  19   22 Andrew J Fisher  23 Matteo S Pizzuto  24 Anna de Marco  24 Davide Corti  24 Myra Hosmillo  14 Joo Hyeon Lee  18   25 Leo C James  7 Lipi Thukral  5 David Veesler  6   26 Alex Sigal  15   27   28 Fotios Sampaziotis  1   2   18   21 Ian G Goodfellow  14 Nicholas J Matheson  1   2   21   29 Kei Sato  30   31 Ravindra K Gupta  32   33   34
Collaborators, Affiliations

Altered TMPRSS2 usage by SARS-CoV-2 Omicron impacts infectivity and fusogenicity

Bo Meng et al. Nature. 2022 Mar.

Abstract

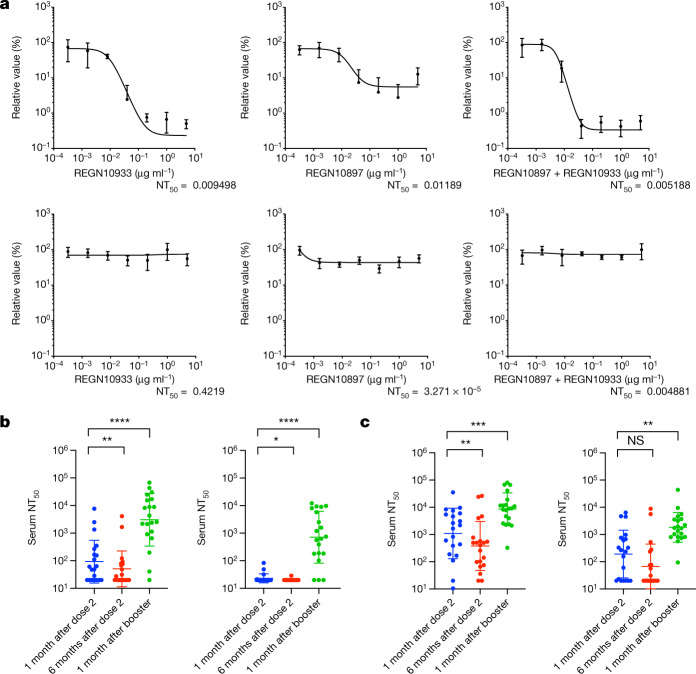
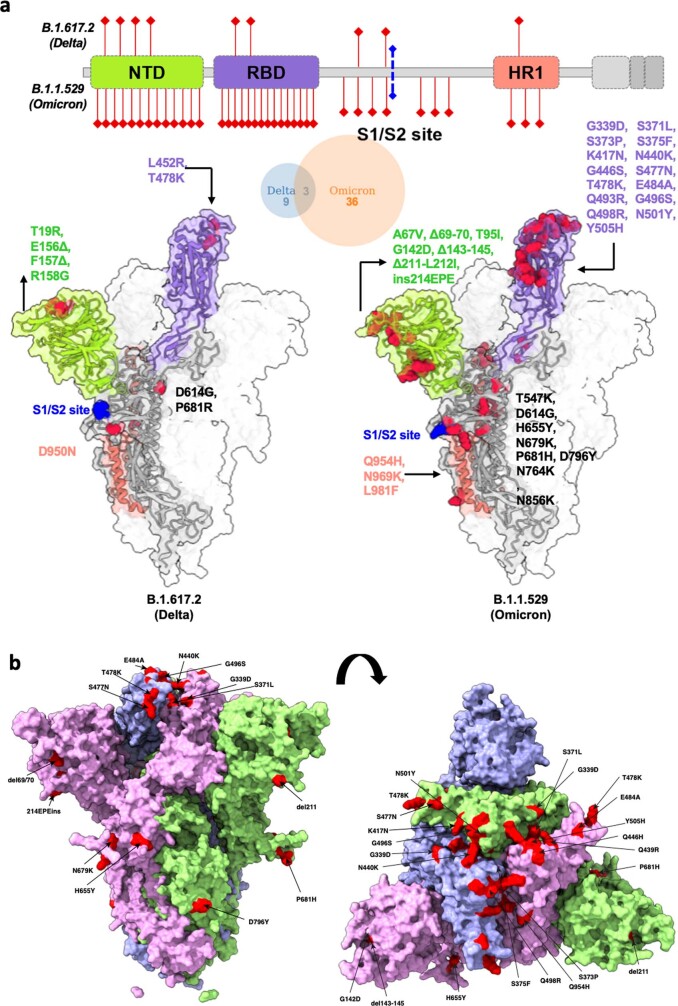
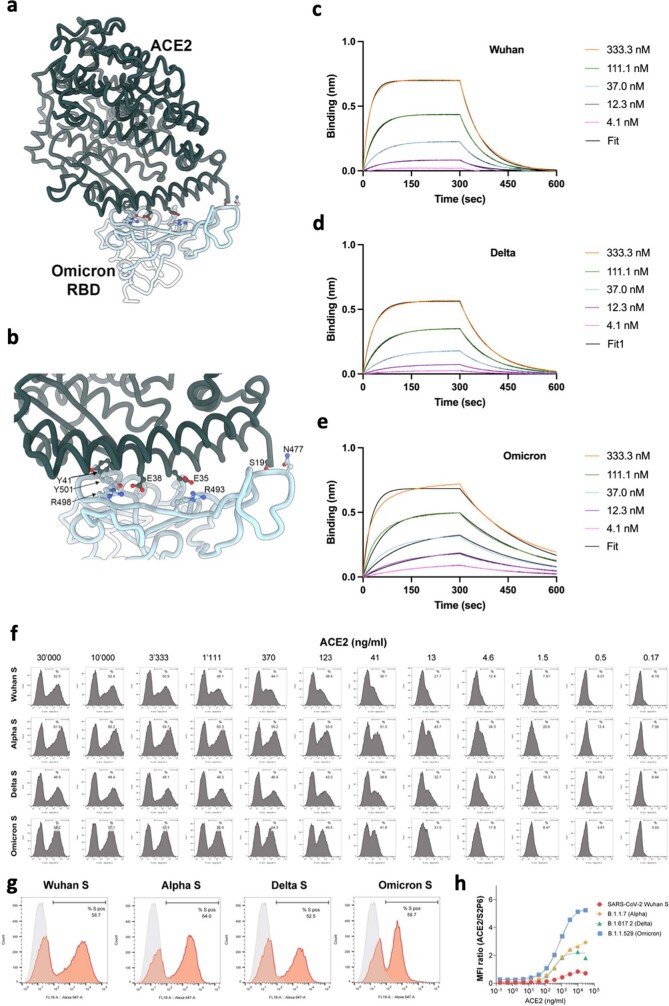
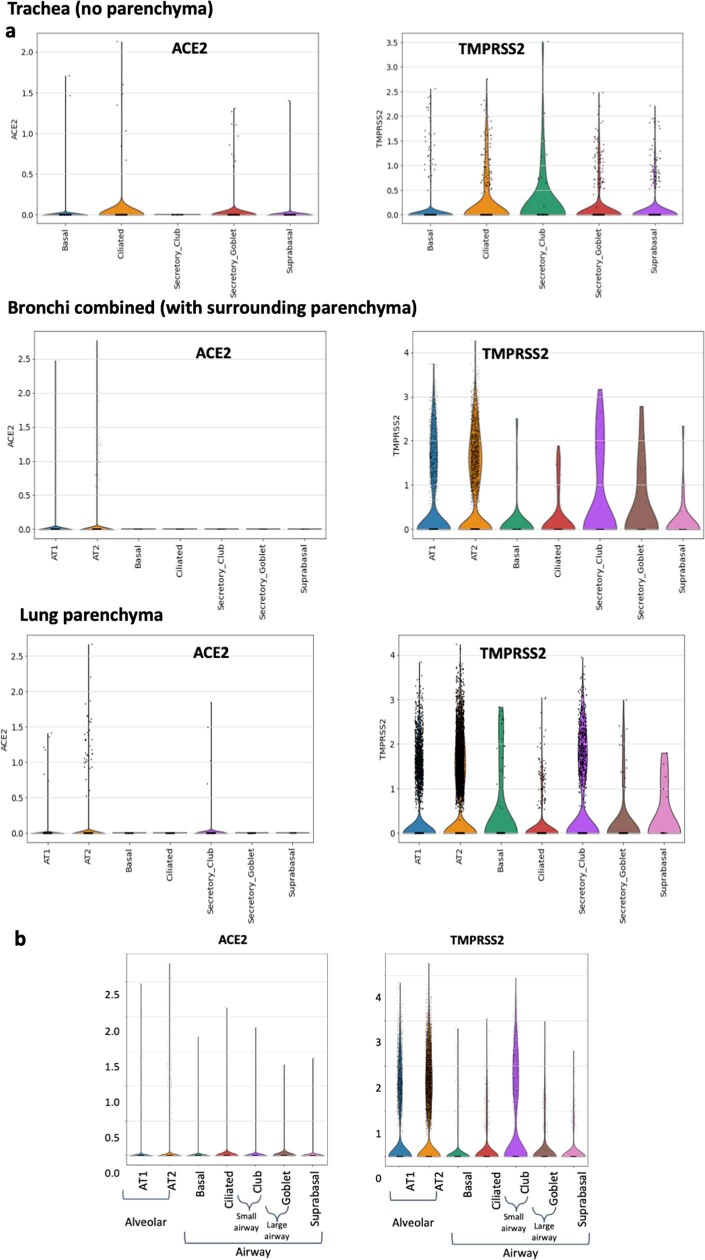
The SARS-CoV-2 Omicron BA.1 variant emerged in 20211 and has multiple mutations in its spike protein2. Here we show that the spike protein of Omicron has a higher affinity for ACE2 compared with Delta, and a marked change in its antigenicity increases Omicron's evasion of therapeutic monoclonal and vaccine-elicited polyclonal neutralizing antibodies after two doses. mRNA vaccination as a third vaccine dose rescues and broadens neutralization. Importantly, the antiviral drugs remdesivir and molnupiravir retain efficacy against Omicron BA.1. Replication was similar for Omicron and Delta virus isolates in human nasal epithelial cultures. However, in lung cells and gut cells, Omicron demonstrated lower replication. Omicron spike protein was less efficiently cleaved compared with Delta. The differences in replication were mapped to the entry efficiency of the virus on the basis of spike-pseudotyped virus assays. The defect in entry of Omicron pseudotyped virus to specific cell types effectively correlated with higher cellular RNA expression of TMPRSS2, and deletion of TMPRSS2 affected Delta entry to a greater extent than Omicron. Furthermore, drug inhibitors targeting specific entry pathways3 demonstrated that the Omicron spike inefficiently uses the cellular protease TMPRSS2, which promotes cell entry through plasma membrane fusion, with greater dependency on cell entry through the endocytic pathway. Consistent with suboptimal S1/S2 cleavage and inability to use TMPRSS2, syncytium formation by the Omicron spike was substantially impaired compared with the Delta spike. The less efficient spike cleavage of Omicron at S1/S2 is associated with a shift in cellular tropism away from TMPRSS2-expressing cells, with implications for altered pathogenesis.


Conflict of interest statement

M.S.P., D.C. and A.d.M. are employees of Vir Biotechnology and may hold shares in Vir Biotechnology. R.K.G. has received honoraria for educational activities from Johnson & Johnson, ViiV and GSK. F.S. is shareholder in Bilitech. The Veesler laboratory has received an unrelated research sponsored agreement from Vir Biotechnology. KGCS is a member of the GSK Immunology Scientific Advisory Board, is a founder, Chief Medical Officer, and a non-executive director of PredictImmune, and is a co-founder of Rheos Medicines. The other authors declare no competing interests.

Figures

Fig. 1
Fig. 1. The sensitivity of SARS-CoV-2 Omicron to clinically approved monoclonal antibodies and to vaccine-elicited neutralizing antibodies.
a, Titration of the monoclonal antibodies REGN10933 and REGN10897 individually and a combination of both against replication-competent Delta (top) and Omicron (bottom) viruses. Data are mean ± s.e.m. n = 4 of technical replicates at each dilution for each virus. Curve fitting for dose response was performed in GraphPad Prism. NT50, 50% neutralization titre. b, c, Neutralization of Delta (left) and Omicron (right) spike PV by sera from vaccinated individuals (ChAdOx-1 (b; n = 20) or BNT12b2 (c; n = 20)) over three time points after dose two (ChAdOx-1 or BNT162b2) and dose three (BNT162b2 only). Data are the geometric mean titre ± s.d., representative of two independent experiments each with two technical replicates. Statistical analysis was performed using Wilcoxon matched-pairs signed-rank tests; **P < 0.01, ***P < 0.001, ****P < 0.0001; NS, not significant. Source data
Fig. 2
Fig. 2. SARS-CoV-2 Omicron and Delta Variant live virus replication in 3D tissue culture systems and 2D cell lines.
a, Overview of the viruses and culture systems used. The schematic was created using BioRender.com. be, The spread of infection by replication-competent Omicron versus Delta variants over time in hNECs (b), and Calu-3 (c), Caco-2-Npro (d) and HeLa-A2T2 (e) cells. Viral RNA and/or infectious virus in the supernatant (TCID50) were measured. Data are mean ± s.d. of the technical replicates shown, representative of two independent experiments. Statistical analysis was performed using two-sided unpaired Student’s t-tests; *P < 0.05. h.p.i., hours post-infection. f, Western blot analysis of two live Omicron isolates and one Delta virus isolate in Vero-ACE2/TMPRSS2 cells probed with antibodies against S2, S1 and N, with quantification of the ratio of S2 and S1 to total spike. Data are mean ± s.e.m. of 2–4 biological replicates. g, Vero-ACE2/TMPRSS2 producer cell lysates infected with live isolates probed with antibodies against S2, S1 and N. GAPDH was used as the loading control. A non-specific band above the S2 band is indicated (~). Data are representative of two independent experiments. hj, The subcellular localization of spike in cells infected with SARS-CoV-2 Delta versus Omicron. The subcellular distribution of Omicron and Delta spike proteins in HeLa-ACE2 cells infected with live virus isolates. h, Cells on coverslips were infected for 24 h, fixed and stained with anti-spike, anti-GM130-cis-Golgi, phalloidin 647 and 4′,6′-diamidino-2-phenylindole dihydrochloride (DAPI), and imaged on a Leica TCS SP8 confocal microscope. i, The distance of spike proteins from the nucleus at 24 h after infection. Data points (n = 144 for each virus) are shown along with the median ± interquartile range. j, Quantification of spike–Golgi colocalization in infected cells. Data are mean ± sd. n = 10 for each virus. Values were determined using Pearson’s correlation coefficient. Scale bars, 10 µm (main images) and 1 µm (insets). Statistical analysis was performed using two-sided unpaired Student’s t-tests; NS, not significant. Source data
Fig. 3
Fig. 3. SARS-CoV-2 Omicron variant spike enters cells less efficiently by TMPRSS2-dependent plasma membrane fusion.
a, PV entry in airway organoids, Calu-3 lung cells, gall bladded organoids, H1299 lung cells, HeLa ACE2-overexpressing cells and HEK293 ACE2-overexpressing cells. Black, WT Wuhan-Hu-1 D614G; orange, Delta/B.1.617.2; grey, Omicron/BA.1. Data are mean ± s.e.m. of n = 2–4 technical replicates. RLU, relative light unit; RT, reverse transcriptase. Statistical analysis was performed using two-sided unpaired Student’s t-tests; *P < 0.05, **P < 0.01, ****P < 0.0001. Data are representative of three independent experiments. b, ACE2 and TMPRSS2 mRNA transcripts in the indicated cell types and organoids as measured using qPCR. Samples were run as n = 4 technical replicates. The centre line shows the median, the box limits show the interquartile range and the whiskers denote the range. Data are representative of two independent experiments. c, Entry of PV expressing spike in HEK293T cells transduced to overexpress ACE2 and either depleted for TMPRSS2 (A2ΔT2) or overexpressing TMPRSS2 (A2T2). d, Entry of PV expressing spike in HEK293T cells with endogenous (−) or overexpressed TMPRSS2 (T2). For c and d, data are the mean ± s.e.m. of n = 4 technical replicates, representative of three independent experiments. Statistical analysis was performed using two-sided unpaired Student’s t-tests; *P < 0.05, **P < 0.01, ***P < 0.001, ****P < 0.0001. e, An illustration of two cell entry pathways that are known to be used by SARS-CoV-2. The schematic was created using BioRender.com. f, Titration of inhibitors in A549-ACE2/TMPRSS2 cells using PV expressing Delta (orange) or Omicron (grey) spike in the presence of the indicated doses of Camostat or E64d, then analysed after 48 h. The percentage inhibition was calculated relative to the maximum luminescence signal for each condition. For each variant and dilution, data are mean ± s.e.m. of experiments conducted in duplicate. Statistical analysis was performed using two-sided unpaired t-tests; ****P < 0.0001. g, Titration of inhibitors in A549-ACE2/TMPRSS2-based luminescent reporter cells using live virus. Cells were infected at a multiplicity of infection (m.o.i.) of 0.01 with Delta or Omicron variants in the presence of the indicated doses of Camostat or E64d, and then analysed after 24 h. The percentage inhibition was calculated relative to the maximum luminescence signal for each condition. For each variant and dilution, data are mean ± s.e.m. of experiments conducted in triplicate. Data in f and g are representative of two independent experiments. h, ACE2 and TMPRSS2 mRNA expression determined using qPCR in human lung tissue (four pieces of tissue each from upper (main bronchus) and lower (lung parenchyma) airways). Each data point is the mean of n = 2 technical replicates. The centre line shows the median of biological replicates (n = 4 for each lung region), the box limits show the interquartile range and the whiskers denote the range. Statistical analysis was performed using two-sided unpaired t-tests. No adjustments were made for multiple comparisons. Source data
Fig. 4
Fig. 4. SARS-CoV-2 Omicron variant spike shows impaired cell–cell fusion activity and smaller infection foci generated by live virus.
a, Schematic of the cell–cell fusion assay. The schematic was created using BioRender.com. b, Spike expression at the cell surface as determined by flow cytometry, showing the distribution of fluorescence intensity. The percentage of spike-positive cells is indicated. c, Reconstructed images of GFP+ syncytia at 16 h. d, Quantification of cell–cell fusion kinetics showing the percentage of the GFP+ area to the total cell area over time. WT, Wuhan-Hu-1 D614G. Data are mean ± s.e.m. from eight fields of views at each time point. Data are representative of at least two independent experiments. e, Three representative images of wells from 96-well plates with infection foci formed by Delta (top row) or Omicron (bottom row) live virus. Scale bars, 2 mm. f, Focus area as determined by ELISpot image analysis for Omicron (n = 111 wells) and Delta (n = 112 wells). Data are the geometric mean ± 95% CI. g, Focus number per well for the same experiments as in f. Data are the geometric mean ± 95% CI for focus number per well for Omicron and Delta infections. For f and g, statistical analysis was performed using two-sided Wilcoxon rank-sum tests; ****P < 0.0001. Source data
Extended Data Fig. 1
Extended Data Fig. 1. Structural model of SARS-CoV-2 Delta and Omicron spike variants.
a. Variant structures for Delta and Omicron of spike protein displaying mutational sites in red colour, generated using the cryo-EM structure PDB# 7A94 as a reference. The schematic highlights differences in domain-wise mutations across protein length. b. Side and top down surface representation of the Omicron spike protein. Spike homotrimer structures were created predicted in silico by the Alphafold2 software package. Individual mutations making up the Omicron spike are highlighted in red on each of the three homotrimers.
Extended Data Fig. 2
Extended Data Fig. 2. Omicron spike binding to ACE2.
a. Rendering of the contacts formed between the Omicron RBD (light blue) and human ACE2 (dark green) using PDB 7TN0 described in b. Zoomed-in view showing select amino acid side chains participating in remodelling of interactions between the Omicron RBD and ACE2. ce. Biolayer interferometry binding analysis of human ACE2 to immobilized SARS-CoV-2 Wuhan-Hu-1 c. Delta d. or Omicron e. RBDs. Black lines correspond to a global fit of the data using a 1:1 binding model. f. Flow cytometry analysis of ACE2 binding to SARS-CoV-2 Wuhan, B.1.1.7 (Alpha), B.1.617.2 (Delta) or Omicron (B.1.1.529) spike proteins transiently expressed in ExpiCHO cells. g. Expression level of each spike as measured via binding by S2-subunit targeting S2P6 mAb. Grey histograms represent background florescence of cells stained with the secondary antibody only. h. Normalized ACE2 binding results based on spike protein expression levels. Values on the Y axis indicate the ratio between the mean fluorescence intensity (MFI) of positive cells stained for ACE2 binding and the MFI of the S2P6 positive cells. Data points in h. are mean of technical triplicates and data shown are representative two independent experiments. Source data
Extended Data Fig. 3
Extended Data Fig. 3. Sensitivity of replication competent SARS-CoV-2 Omicron and Delta variants to clinically approved direct acting antiviral molecules remdesivir and the active metabolite of molnupiravir.
HOS cells overexpressing ACE2 and TMPRSS2 were used and a viral input of 1,000 TCID50 was used (TCID50 measured using VeroE6/TMPRSS2 cells). a. Dose-response curves. Infection as measured by viral RNA copies relative to the no drug control (100%) is plotted on the y axis with serial drug dilution on the x axis. EC50 is indicated for each panel and calculated in GraphPad Prism. Data points are mean of technical quadruplicates with +/- SEM shown. Curve fitting for dose response was done in GraphPad prism. b. toxicity assay showing relative cell viability at a range of drug doses. Data points are mean of technical quadruplicates with +/- SEM shown. All data are representative of two independent experiments.
Extended Data Fig. 4
Extended Data Fig. 4. Neutralization of spike pseudotyped virus by sera from vaccinated individuals over three time points following dose two (ChAdOx-1 or BNT162b2) and dose three (BNT162b2 only).
a. n = 17 ChAdOx-1 or b. n = 18 BNT12b2. GMT (geometric mean titre) shown as a line with s.d as bars are presented. Data representative of two independent experiments each with two technical replicates. **p < 0.01, *** p < 0.001, ****p < 0.0001 Wilcoxon matched-pairs signed rank test, ns not significant, two-sided. Data are for individuals who tested negative for anti-N IgG at each time point.
Extended Data Fig. 5
Extended Data Fig. 5. Live virus neutralization by vaccine-elicited and convalescent sera.
a. Neutralization of replication competent Delta and Omicron viruses by sera from vaccinated individuals following dose two of ChAdOx-1 (n = 5), BNT162b2 (n = 10), mRNA 1273(n = 10), and Coronavac (n = 9) vaccines. b. neutralization of live viruses by sera derived from recovered individuals following infection in early 2020 or with confirmed Delta infection. GMT (geometric mean titre) of three technical replicates are shown as a line with s.d as bars are presented. Data representative of two independent experiments. Fold change in NT50 is indicated. Source data
Extended Data Fig. 6
Extended Data Fig. 6. SARS-CoV-2 Omicron Variant spike pseudotyped lentiviruses.
a. Graphical representation of Omicron spike mutations present in expression plasmid used to generate lentiviral pseudotyped virus (PV). Mutations coloured according to location in spike; bold mutations are novel to this lineage and have not been identified in previous VOCs. b. western blots of pseudotyped virus (PV) virions from 293T producer cells following transfection with plasmids expressing lentiviral vectors and SARS-CoV-2 S plasmids. (WT- Wuhan-1 with D614G), probed with antibodies for HIV-1 p24 and SARS-Cov-2 S2 (top) and S1 (bottom). c, d. quantification of western blots showing c. ratio of spike:p24 in virions, d. ratio of S2:total spike. Mean ratio +/- sd is shown for 3 biological replicates e. Western blot of cell lysates used to produce virions with f. quantification of S2 to total spike ratio. Mean ratio +/- sd is shown for 3 biological replicates g. brightfield images of lower airway organoids h. brightfield images of of cholangiocyte organoids (Scale bars 200 μm). i. infection schematic for entry assays in organoids created with BioRender.com.
Extended Data Fig. 7
Extended Data Fig. 7. ACE2 and TMPRSS2 tissue expression levels by single cell RNAseq.
a. Log-normalized expression of ACE2 and TMPRSS2 genes in single-nucleus RNAseq data for indicated tissue types and. b. Log-normalized aggregrated expression of ACE2 and TMPRSS2 genes in single-nucleus RNAseq data from human alveolar (AT1 - alveolar type 1, AT2 - alveolar type 2 pneumocytes), and airway epithelial cells (basal, suprabasal, goblet and ciliated). Data are derived from in Madissoon et al.
Extended Data Fig. 8
Extended Data Fig. 8. SARS-CoV-2 cell-cell fusion and infection focus formation.
a. effect of furin inhibition using CMK on cell-cell fusion for WT (Wuhan-1 D614G) and Delta variant. CMK drug dilution indicated on x axis and fusion on y axis. Quantification of cell-cell fusion shows percentage of green area to total cell area. Mean of technical replicates is plotted with error bars representing SEM. Data are representative of at least two independent experiments. b. impact of neutralising antibodies from UK wave one 2020 sera on cell-cell fusion for WT (Wuhan-1 D614G) and Delta variant. Serial dilutions of sera added to acceptor cells before co-cultivation with donor cells. Data points are mean of technical replicates is plotted with error bars representing SEM. c. Gating strategy for cell surface staining of SARS-CoV-2 spike proteins from 293T cells transfected with plasmids expressing spike, using rabbit anti-SARS-CoV-2 spike S1/2 polyclonal antibody at 1:100. dg. Omicron shows attenuated localized spread compared to Delta. d. Microscope images of foci (pink arrow) 2 h post-infection with ancestral SARS-CoV-2. Bar is 200 microns. e. Images of Omicron foci 18 h post-infection. f. Images of Delta foci 18 h post-infection g. Geometric mean and 95% confidence intervals of focus area of microscope images of 2 h post-ancestral infection (n = 12 foci, purple), 18 h post-Omicron infection (n = 363, grey), and 18 h post-Delta infection (n = 275, orange). p-values are not significant (ns) or **** < 0.0001 as determined by two sided Wilcoxon rank sum test.

Update of

Comment in

References

    1. Viana, R. et al. Rapid epidemic expansion of the SARS-CoV-2 Omicron variant in southern Africa. Nature10.1038/s41586-022-04411-y (2022). - PMC - PubMed
    1. Cele, S. et al. Omicron extensively but incompletely escapes Pfizer BNT162b2 neutralization. Nature10.1038/s41586-021-04387-1 (2021). - PMC - PubMed
    1. Hoffmann M, et al. SARS-CoV-2 cell entry depends on ACE2 and TMPRSS2 and is blocked by a clinically proven protease inhibitor. Cell. 2020;181:271–280. - PMC - PubMed
    1. Mlcochova P, et al. SARS-CoV-2 B.1.617.2 Delta variant replication and immune evasion. Nature. 2021;599:114–119. - PMC - PubMed
    1. Meng B, et al. Recurrent emergence of SARS-CoV-2 spike deletion H69/V70 and its role in the Alpha variant B.1.1.7. Cell Rep. 2021;35:109292. - PMC - PubMed

Publication types

MeSH terms

Supplementary concepts