. 2022 Feb 1;23(1):42.
doi: 10.1186/s13059-021-02577-8.

MUON: multimodal omics analysis framework

Affiliations

MUON: multimodal omics analysis framework

Danila Bredikhin et al. Genome Biol. .

Abstract

Advances in multi-omics have led to an explosion of multimodal datasets to address questions from basic biology to translation. While these data provide novel opportunities for discovery, they also pose management and analysis challenges, thus motivating the development of tailored computational solutions. Here, we present a data standard and an analysis framework for multi-omics, MUON, designed to organise, analyse, visualise, and exchange multimodal data. MUON stores multimodal data in an efficient yet flexible and interoperable data structure. MUON enables a versatile range of analyses, from data preprocessing to flexible multi-omics alignment.


Conflict of interest statement

The authors declare that they have no competing interests.

Figures

Fig. 1
Fig. 1
Architecture and content of a multimodal data container (MuData). a Schematic representation of the hierarchical structure of a MuData container. Raw data matrices from multiple modalities together with associated metadata are encapsulated in an array structure. For illustration, blue and red denote RNA-seq and ATAC-seq data modalities; green denotes multimodal annotation or derived data. b Example content of the structure in a. Shown are example content of a MuData container, consisting of count matrices, embeddings, neighbourhood graphs and cell annotations for individual modalities (blue, red), as well as derived data from multi-omics analyses (green). c Schematic representation of MUON storage model and its serialisation scheme using the HDF5 file format on disk. Left: Hierarchy of the storage model, with plates denoting different levels of hierarchy. Arrows signify access schemes of the HDF5 file using various programming languages. Right: Representation of the MuData object in Python, with metadata and derived annotations represented as NumPy arrays or Pandas DataFrames, and with individual modalities as AnnData objects
Fig. 2
Fig. 2
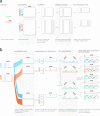
Example multi-omics analysis workflows implemented using MUON. a Construction and processing of individual modalities of a multi-omics scRNA-seq and scATAC-seq dataset. Processing steps for individual omics from left to right. Rectangles denote count matrices following each processing step, which are stored in a shared MUON data container. MUON provides processing functionalities for a wide range of single-omics, including RNA-seq, ATAC-seq, CITE-seq. Existing workflows and methods can be utilised, including those implemented in scanpy. Respective analysis steps are described below each step. b Alternative workflows for integrating multiple omics for latent space inference and clustering. MUON enables combining alternative analysis steps to define tailored multi-omics data integrations. Shown are canonical workflows from left to right: dimensionality reduction, definition of cell neighbourhood graphs, followed by either nonlinear estimation of cell embeddings or clustering. Letters W and Z denote matrices with feature weights (loadings) and factors (components), respectively. Triangles represent cell-cell distance matrices, with shading corresponding to cell similarity. Green colour signifies steps that combine information from multiple modalities; steps based on individual modalities only are marked with blue (RNA) or red (ATAC) respectively. The outputs of the respective workflows (right) are from top to bottom: UMAP space (i) and cell labels (ii) based on RNA or alternatively based on ATAC modality (iii, iv), cell labels based on two cell neighbour graphs from individual modalities (v), UMAP space and cell labels based on WNN output (vi, vii), UMAP space and cell labels based on MOFA output (viii, ix)
Fig. 3
Fig. 3
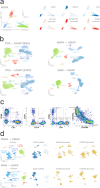
Single-cell multi-omics datasets processed and visualised using MUON. a MOFA factors estimated from simultaneous scRNA-seq and scATAC-seq profiling of PBMCs, with cells coloured by either left: coarse-grained cell type; or right: gene expression (in blue) and peak accessibility (in red). Displayed genes and peaks are selected to represent cell-type-specific variability along factor axes. b UMAP latent space for the same dataset as in a, constructed from left: principal components for individual modalities; or right: MOFA factors and WNN cell neighbourhood graph. Cells are coloured by coarse-grained cell type. c. Examples of individual feature values of protein abundance in the CITE-seq profiling of PBMCs after applying dsb normalisation. Colours correspond to the relative local density of cells with red for high density and blue for low density. d UMAP latent space for the same dataset as in c, constructed from MOFA factors (top) or WNN cell neighbourhood graph (bottom). Cells are coloured by their coarse-grained cell type or feature values (blue for gene expression, yellow for protein abundance

References

    1. Hasin Y, Seldin M, Lusis A. Multi-omics approaches to disease. Genome Biol. 2017;18(1):83. doi: 10.1186/s13059-017-1215-1. - DOI - PMC - PubMed
    1. Zhu C, Preissl S, Ren B. Single-cell multimodal omics: the power of many. Nat Methods. 2020;17(1):11–14. doi: 10.1038/s41592-019-0691-5. - DOI - PubMed
    1. Argelaguet R, Cuomo ASE, Stegle O. Marioni JC. Computational principles and challenges in single-cell data integration. Nat Biotechnol. 2021. 10.1038/s41587-021-00895-7. - PubMed
    1. Conesa A, Beck S. Making multi-omics data accessible to researchers. Sci Data. 2019;6(1):251. doi: 10.1038/s41597-019-0258-4. - DOI - PMC - PubMed
    1. Wilkinson MD, Dumontier M, Aalbersberg IJJ, Appleton G, Axton M, Baak A, Blomberg N, Boiten JW, da Silva Santos LB, Bourne PE, Bouwman J, Brookes AJ, Clark T, Crosas M, Dillo I, Dumon O, Edmunds S, Evelo CT, Finkers R, Gonzalez-Beltran A, Gray AJG, Groth P, Goble C, Grethe JS, Heringa J, ’t Hoen PAC, Hooft R, Kuhn T, Kok R, Kok J, Lusher SJ, Martone ME, Mons A, Packer AL, Persson B, Rocca-Serra P, Roos M, van Schaik R, Sansone SA, Schultes E, Sengstag T, Slater T, Strawn G, Swertz MA, Thompson M, van der Lei J, van Mulligen E, Velterop J, Waagmeester A, Wittenburg P, Wolstencroft K, Zhao J, Mons B. The FAIR Guiding Principles for scientific data management and stewardship. Sci Data. 2016;3(1):160018. doi: 10.1038/sdata.2016.18. - DOI - PMC - PubMed

Publication types