. 1986 Jan;250(1 Pt 2):H29-42.
doi: 10.1152/ajpheart.1986.250.1.H29.

Multiple tracer dilution estimates of D- and 2-deoxy-D-glucose uptake by the heart

Multiple tracer dilution estimates of D- and 2-deoxy-D-glucose uptake by the heart

J Kuikka et al. Am J Physiol. 1986 Jan.

Abstract

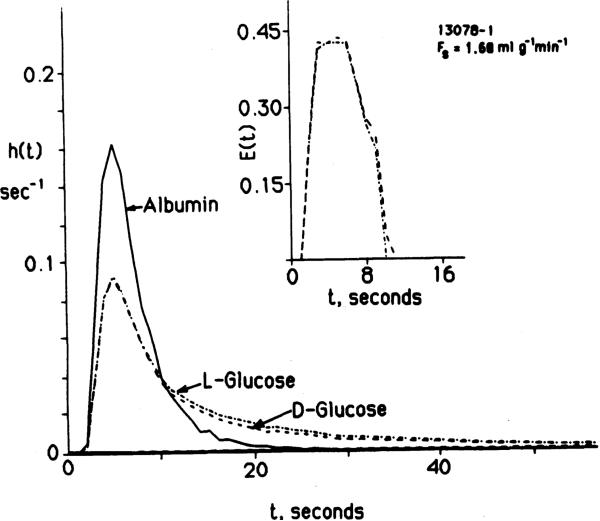
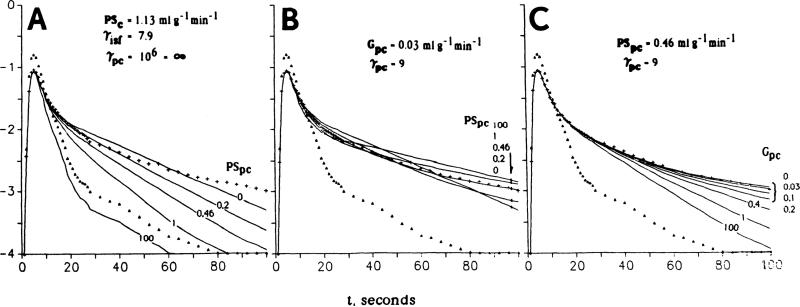
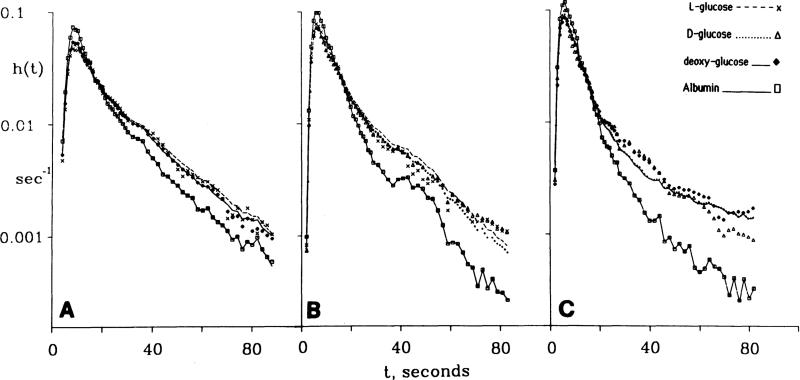
Permeability-surface area products of the capillary wall, PSc, and the myocyte sarcolemma, PSpc, for D-glucose and 2-deoxy-D-glucose were estimated via the multiple indicator-dilution technique in isolated blood-perfused dog and Tyrode-perfused rabbit hearts. Aortic bolus injections contained 131I-albumin (intravascular reference), two of three glucoses: L-glucose (an extracellular reference solute), D-glucose, and 2-deoxy-D-glucose. Outflow dilution curves were sampled for 1-2.5 min without recirculation. The long duration sampling allowed accurate evaluation of PSpc by fitting the dilution curves with a multiregional axially distributed capillary-interstitial fluid-cell model accounting for the heterogeneity of regional flows (measured using microspheres and total heart sectioning). With average blood flow of 1.3 ml . g-1 . min-1, in the dog hearts the PSc for D-glucose was 0.72 +/- 0.17 ml . g-1 . min-1 (mean +/- SD; n = 11), and PSpc was 0.57 +/- 0.15 ml . g-1 . min-1. In the rabbit hearts with perfusate flow of 2.0 ml . g-1 . min-1 (n = 6), PSc was 1.2 +/- 0.1 and PSpc was 0.4 +/- 0.1 ml . g-1 . min-1. PSc for 2-deoxy-D-glucose was about 4% higher than for D-glucose and L-glucose in both preparations. Relative to L-glucose, there was no measurable transendothelial transport of either dextroglucose, indicating that transcapillary transport was by passive diffusion, presumably via the clefts between cells. The technique allows repeated measurements of D-glucose uptake at intervals of a few minutes; it may therefore be used to assess changes in transport rates occurring over intervals of several minutes.


Figures

Fig. 1
Fig. 1
Impulse responses and sensitivity functions (S) for a capillary interstitial fluid (ISF)-cell model solution with parameter values suitable for D-glucose in the heart. Notice that sensitivity functions are all different, indicating independence of the parameters in shaping model solutions. Note too that Vpc and Gpc have little influence at early times and more later, suggesting the importance of avoiding (or accounting for) reciruculation. Parameter values used to generate model solutions were 7-path model with relative dispersion of flows = 30%; Fs = 1.5 ml·g–1·min–1; PSC and PSpc = 0.75 and 0.5 ml·g–1·min–1; Gpc = 0.5 ml·g–1·min–1; γpc (which is VpcVC) = 10, and γISF (which is VIVC) = 5. (Input function is a gamma variate function with a mean transit time of 3 s, a relative dispersion of 0.2, and a skewness of 1.0.) Scalar multiplier of 40 SPSpc and SGpc and of 100 for SVIST and SVpc indicate that sensitivity to PSC is higher than to any other parameter. Units of S, s-1/(units of parameter). See text for abbreviations.
Fig. 2
Fig. 2
Coronary sinus outflow dilution curves for D- and L-glucose in a rabbit heart after injection of tracers into the aortic cannula at t = 0. Main peaks of impulse responses for D- and L-glucose are nearly identical. Extraction curves, E(t) in insert, provide a more critical test of their similarity and show the same result. Tail of D-glucose curve is lower than that of L-glucose, in accord with uptake by myocardial cells. (Expt no. 13078-l. Data given in numerical form in Table 3.)
Fig. 3
Fig. 3
Multicapillary solutions for a capillary interstitial fluid (ISF)-cell-reaction model of D-glucose outflow dilution curves from same Krebs-Ringer perfused rabbit heart as in Fig. 2 (no. 13078-l). A: solutions for a reduced model for capillary permeation and cellular uptake without return flux from cell but with return flux from ISF to capillary. Heterogeneity of flows was approximated using 7 parallel pathways with a Gaussian distribution of flows with relative dispersion 30%. Five solutions are drawn for different values of the rate of cellular influx (PSpc), all other parameters being constant. Fs = 1.68 ml·g–1·min–1; PSc = 1.13 ml·g–1·min–1; γpc = 7.9; γpc = infinity, to prevent reflux from the cell. B: effects of cellular permeation, now with return flux from cell to ISF. Intracellular consumption, Gpc = 0.03 ml·g–1·min–1; other parameters same as for A. Best fit is obtained with PSpc = 0.42 ml·g–1·min–1 and γpc = 9. C: effect of Gpc on shapes of tails of outflow dilution curves. Increasing rates of consumption reduce reflux from cell into outflow, lowering tails of curves. Best fit values were PSc = 1.13 ml·g–1·min–1, γISF = 7.9, PSpc = 0.46 ml·g–1·min–1, γpc = 9, and Gpc = 0.03 ml·g–1·min–1. When PSpc, is higher, sensitivity to Gpc is higher. (Numerical values of data points and of model solutions are listed in Table 3.)
Fig. 4
Fig. 4
Outflow dilution curves for D-glucose and deoxyglucose and albumin (dog expt 4048-6) fitted with the model. Deoxyglucose curve is shifted downward by half a logarithmic decade (ordinate values divided by 10½) to display it separately from D-glucose curve. Parameter estimates logarithmic for D- and deoxyglucose were PSc, 0.97 and 1.0; PSpc = 0.7 and 0.5; Gpc, = 0.01 and 0.05 ml·g–1·min–1; γISF = 6.5 and γpc = 13.3 ml/g for both. Coefficients of variation were 0.19 and 0.09.
Fig. 5
Fig. 5
Constrained fitting of a capillary interestitial-fluid (ISF)-cell-reaction model to 9 coronary outflow dilution curves for albumin, D-, L-, and 2-deoxy-D-glucose. (Expts 30284, 2, and 3.) Symbols are data points; lines give model solutions fitted to data under strong constraints. Regional flows were from microsphere deposition densities. The only free parameters were 1 value each for PSc and VISF and 2 for PSpc and for D- and 2-deoxy-D-glucose (see text). Since PSC affects most strongly the first 20–30 s of the curves, result is excellent fitting of parts of curve sensitive to PSc and poorer fitting tails at 30–80 s where VISF, PSpc, and Vpc have influences.

References

    1. Alvarez OA, Yudilevich DL. Heart capillary permeability to lipid-insoluble molecules. J. Physiol. Lond. 1969;202:45–58. - PMC - PubMed
    1. Bassingthwaighte JB. A concurrent flow model for extraction during transcapillary passage. Circ. Res. 1974;35:483–503. - PMC - PubMed
    1. Bassingthwaighte JB, Goresky CA. Handbook of Physiology. The Cardiovascular System. Microcirculation. Vol. 4. Am. Physiol. Soc.; Bethesda, MD: 1984. Modeling in the analysis of solute and water exchange in the microvasculature. pp. 549–626. sect. 2. chapt. 13.
    1. Bassingthwaighte JB, Kuikka JT, Chan IS, Arts T, Reneman RS. A comparison of ascorbate and glucose transport in the heart. Am. J. Physiol. 1985;249:H141–H149. Heart Circ. Physiol. 18. - PMC - PubMed
    1. Bassingthwaighte JB, Lenhoff AM, Stephenson JL. A sliding-element algorithm for rapid solution of spatially distributed convection-permeation models (Abstract). Biophys. J. 1984;45:175a. - PubMed

Publication types

LinkOut - more resources