

Slowly Expanding Lesions Predict 9-Year Multiple Sclerosis Disease Progression
- PMID: 35105685
- PMCID: PMC8808355
- DOI: 10.1212/NXI.0000000000001139
Slowly Expanding Lesions Predict 9-Year Multiple Sclerosis Disease Progression
Abstract
Background and objectives: Chronic active lesions contribute to multiple sclerosis (MS) severity, but their association with long-term disease progression has not been evaluated yet. White matter (WM) lesions showing linear expansion over time on serial T1- and T2-weighted scans (i.e., slowly expanding lesions [SELs]) have been proposed as a marker of chronic inflammation. In this study, we assessed whether SEL burden and microstructural abnormalities were associated with Expanded Disability Status Scale (EDSS) score worsening and secondary progressive (SP) conversion at 9.1-year follow-up in patients with relapsing-remitting (RR) MS.
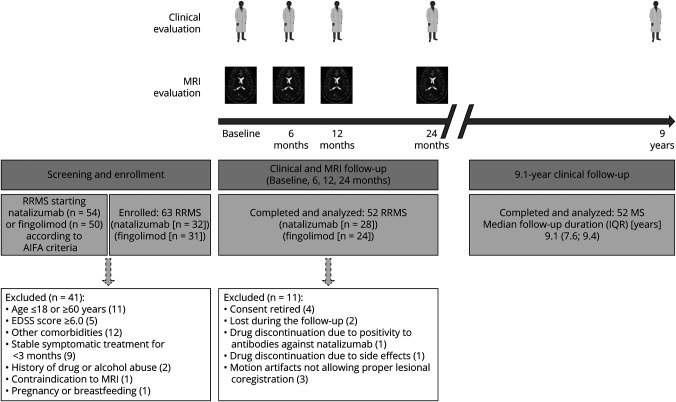
Methods: In 52 patients with RRMS, SELs were identified among WM lesions by linearly fitting the Jacobian of the nonlinear deformation field between time points obtained combining 3T brain T1- and T2-weighted scans acquired at baseline and months 6, 12, and 24. Logistic regression analysis was applied to investigate the associations of SEL number, volume, magnetization transfer ratio (MTR), and T1-weighted signal intensity with disability worsening (i.e., EDSS score increase) and SP conversion after a median follow-up of 9.1 years.
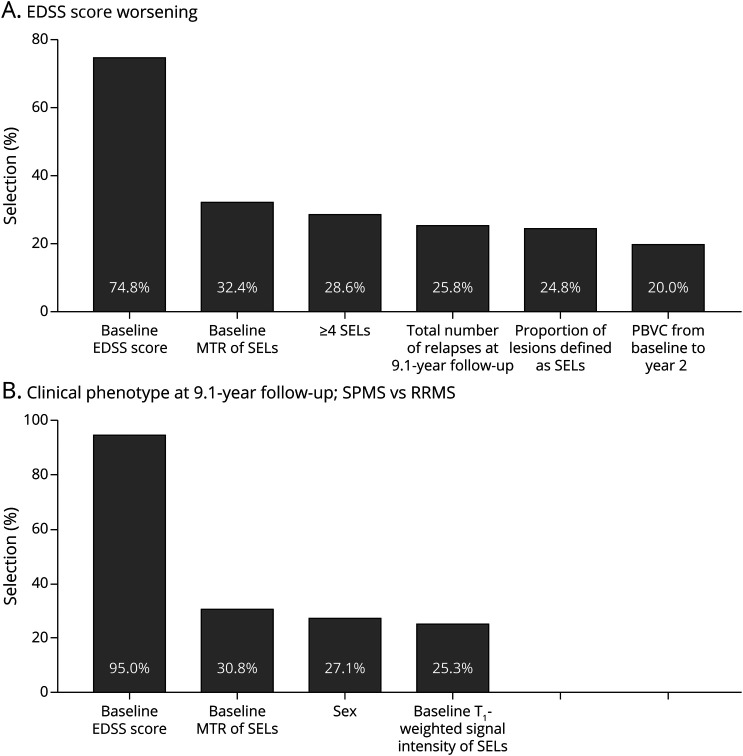
Results: At follow-up, 20/52 (38%) patients with MS showed EDSS score worsening; 13/52 (25%) showed SP conversion. A higher baseline EDSS score (for each point higher: OR = 3.15 [95% CI = 1.61; 8.38], p = 0.003), a higher proportion of SELs among baseline lesions (for each % increase: OR = 1.22 [1.04; 1.58], p = 0.04), and lower baseline MTR values of SELs (for each % higher: OR = 0.66 [0.41; 0.92], p = 0.033) were significant independent predictors of EDSS score worsening at follow-up (C-index = 0.892). A higher baseline EDSS score (for each point higher: OR = 6.37 [1.98; 20.53], p = 0.002) and lower baseline MTR values of SELs (for each % higher: OR = 0.48 [0.25; 0.89], p = 0.02) independently predicted SPMS conversion (C-index = 0.947).
Discussion: The proportion of SELs is associated with MS progression after 9 years. More severe SEL microstructural abnormalities independently predict EDSS score worsening and SPMS conversion. The quantification of SEL burden and damage using T1-, T2-weighted, and MTR sequences may identify patients with RRMS at a higher risk of long-term disability progression and SPMS conversion.
Classification of evidence: This study provides Class III evidence that in patients with RRMS starting treatment with natalizumab or fingolimod, the proportion of SELs on brain MRI was associated with EDSS score worsening and SPMS conversion at 9-year follow-up.
Copyright © 2022 The Author(s). Published by Wolters Kluwer Health, Inc. on behalf of the American Academy of Neurology.
Figures
References
Publication types
MeSH terms
Substances
LinkOut - more resources
Full Text Sources
Other Literature Sources