

Real-time pandemic surveillance using hospital admissions and mobility data
- PMID: 35105729
- PMCID: PMC8851544
- DOI: 10.1073/pnas.2111870119
Real-time pandemic surveillance using hospital admissions and mobility data
Abstract
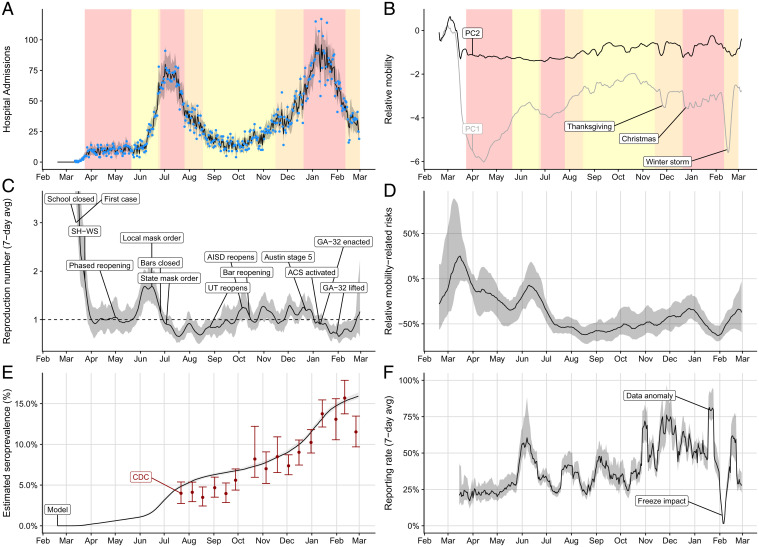
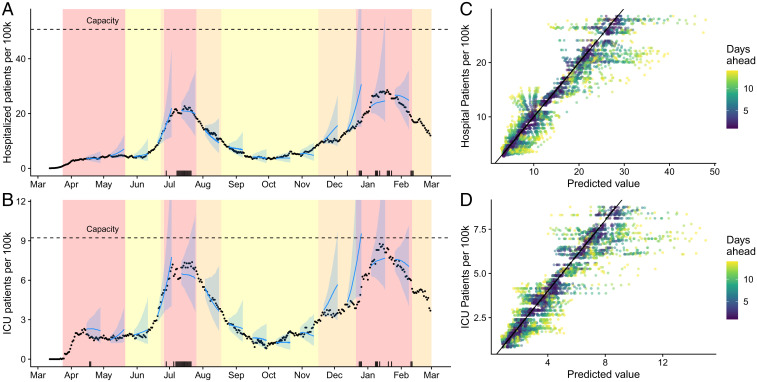
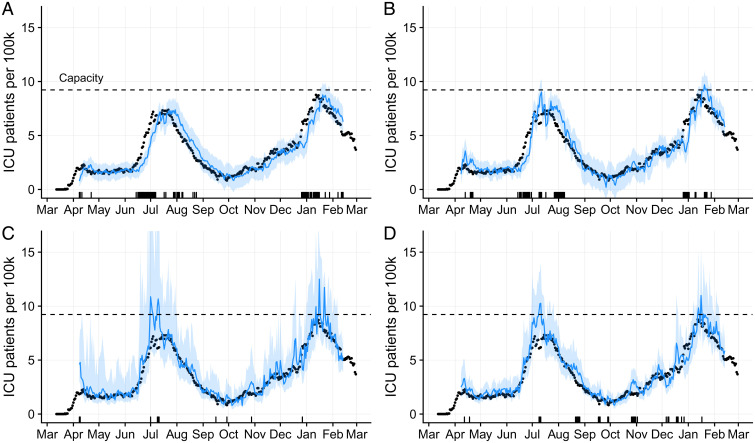
Forecasting the burden of COVID-19 has been impeded by limitations in data, with case reporting biased by testing practices, death counts lagging far behind infections, and hospital census reflecting time-varying patient access, admission criteria, and demographics. Here, we show that hospital admissions coupled with mobility data can reliably predict severe acute respiratory syndrome coronavirus 2 (SARS-CoV-2) transmission rates and healthcare demand. Using a forecasting model that has guided mitigation policies in Austin, TX, we estimate that the local reproduction number had an initial 7-d average of 5.8 (95% credible interval [CrI]: 3.6 to 7.9) and reached a low of 0.65 (95% CrI: 0.52 to 0.77) after the summer 2020 surge. Estimated case detection rates ranged from 17.2% (95% CrI: 11.8 to 22.1%) at the outset to a high of 70% (95% CrI: 64 to 80%) in January 2021, and infection prevalence remained above 0.1% between April 2020 and March 1, 2021, peaking at 0.8% (0.7-0.9%) in early January 2021. As precautionary behaviors increased safety in public spaces, the relationship between mobility and transmission weakened. We estimate that mobility-associated transmission was 62% (95% CrI: 52 to 68%) lower in February 2021 compared to March 2020. In a retrospective comparison, the 95% CrIs of our 1, 2, and 3 wk ahead forecasts contained 93.6%, 89.9%, and 87.7% of reported data, respectively. Developed by a task force including scientists, public health officials, policy makers, and hospital executives, this model can reliably project COVID-19 healthcare needs in US cities.
Keywords: COVID-19; epidemiological data; forecasting; healthcare usage.
Copyright © 2022 the Author(s). Published by PNAS.
Conflict of interest statement
The authors declare no competing interest.
Figures

Comment in
-
Collaborative modeling key to improving outbreak response.Proc Natl Acad Sci U S A. 2022 Apr 5;119(14):e2200703119. doi: 10.1073/pnas.2200703119. Epub 2022 Mar 23. Proc Natl Acad Sci U S A. 2022. PMID: 35320028 Free PMC article. No abstract available.
Similar articles
-
How New Mexico Leveraged a COVID-19 Case Forecasting Model to Preemptively Address the Health Care Needs of the State: Quantitative Analysis.JMIR Public Health Surveill. 2021 Jun 9;7(6):e27888. doi: 10.2196/27888. JMIR Public Health Surveill. 2021. PMID: 34003763 Free PMC article.
-
Association of tiered restrictions and a second lockdown with COVID-19 deaths and hospital admissions in England: a modelling study.Lancet Infect Dis. 2021 Apr;21(4):482-492. doi: 10.1016/S1473-3099(20)30984-1. Epub 2020 Dec 24. Lancet Infect Dis. 2021. PMID: 33357518 Free PMC article.
-
Visitor Restrictions During the COVID-19 Pandemic and Increased Falls With Harm at a Canadian Hospital: An Exploratory Study.J Patient Saf. 2024 Sep 1;20(6):434-439. doi: 10.1097/PTS.0000000000001237. Epub 2024 Jun 26. J Patient Saf. 2024. PMID: 38917342
-
Estimated surge in hospital and intensive care admission because of the coronavirus disease 2019 pandemic in the Greater Toronto Area, Canada: a mathematical modelling study.CMAJ Open. 2020 Sep 22;8(3):E593-E604. doi: 10.9778/cmajo.20200093. Print 2020 Jul-Sep. CMAJ Open. 2020. PMID: 32963024 Free PMC article.
-
Predicting and forecasting the impact of local outbreaks of COVID-19: use of SEIR-D quantitative epidemiological modelling for healthcare demand and capacity.Int J Epidemiol. 2021 Aug 30;50(4):1103-1113. doi: 10.1093/ije/dyab106. Int J Epidemiol. 2021. PMID: 34244764 Free PMC article.
Cited by
-
Incorporating variant frequencies data into short-term forecasting for COVID-19 cases and deaths in the USA: a deep learning approach.EBioMedicine. 2023 Mar;89:104482. doi: 10.1016/j.ebiom.2023.104482. Epub 2023 Feb 21. EBioMedicine. 2023. PMID: 36821889 Free PMC article.
-
Novel mobility index tracks COVID-19 transmission following stay-at-home orders.Sci Rep. 2022 May 10;12(1):7654. doi: 10.1038/s41598-022-10941-2. Sci Rep. 2022. PMID: 35538129 Free PMC article.
-
Enhancing the Predictive Power of Google Trends Data Through Network Analysis: Infodemiology Study of COVID-19.JMIR Public Health Surveill. 2023 Sep 7;9:e42446. doi: 10.2196/42446. JMIR Public Health Surveill. 2023. PMID: 37676701 Free PMC article.
-
Estimating the undetected emergence of COVID-19 in the US.PLoS One. 2023 Apr 6;18(4):e0284025. doi: 10.1371/journal.pone.0284025. eCollection 2023. PLoS One. 2023. PMID: 37023065 Free PMC article.
-
Forecasting hospital-level COVID-19 admissions using real-time mobility data.Commun Med (Lond). 2023 Feb 14;3(1):25. doi: 10.1038/s43856-023-00253-5. Commun Med (Lond). 2023. PMID: 36788347 Free PMC article.
References
-
- IHME COVID-19 health service utilization forecasting team, Forecasting COVID-19 impact on hospital bed-days, ICU-days, ventilator-days and deaths by US state in the next 4 months. medRxiv [Preprint] (2020). 10.1101/2020.03.27.20043752 (Accessed 1 May 2021). - DOI
-
- Panchadsaram R., et al. ., Tracking our COVID-19 response. https://www.covidexitstrategy.org/. Accessed 27 January 2021.
-
- The COVID Tracking Project, Federal COVID data. https://covidtracking.com/. Accessed 27 April 2021.
-
- Drake J., et al. ., CEID COVID-19 - stochastic model for the US. https://www.covid19.uga.edu/forecast.html. Accessed 27 January 2021.
Publication types
MeSH terms
Grants and funding
LinkOut - more resources
Full Text Sources
Medical
Research Materials
Miscellaneous
