. 2022 Feb 2;7(1):33.
doi: 10.1038/s41392-021-00855-2.

EPHA2 mediates PDGFA activity and functions together with PDGFRA as prognostic marker and therapeutic target in glioblastoma

Affiliations

EPHA2 mediates PDGFA activity and functions together with PDGFRA as prognostic marker and therapeutic target in glioblastoma

Qu-Jing Gai et al. Signal Transduct Target Ther. .

Abstract

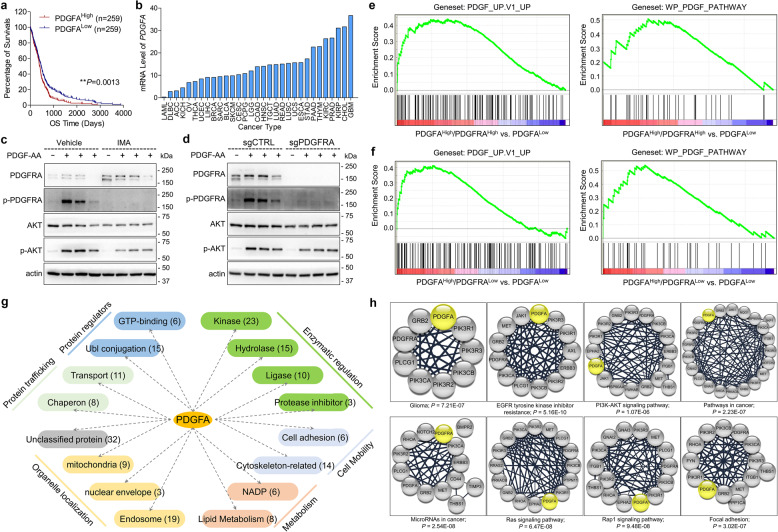
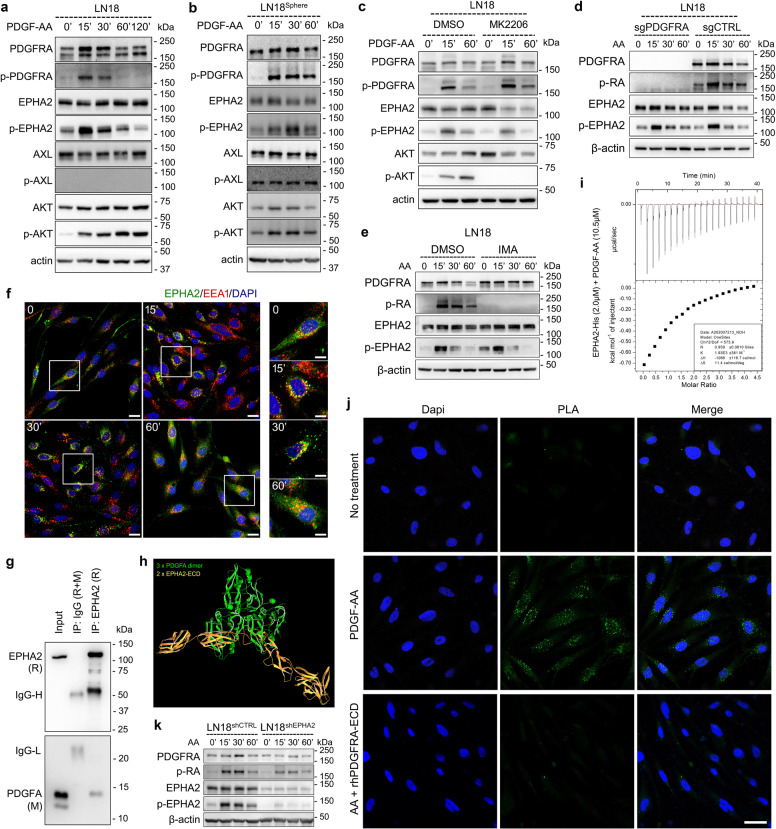
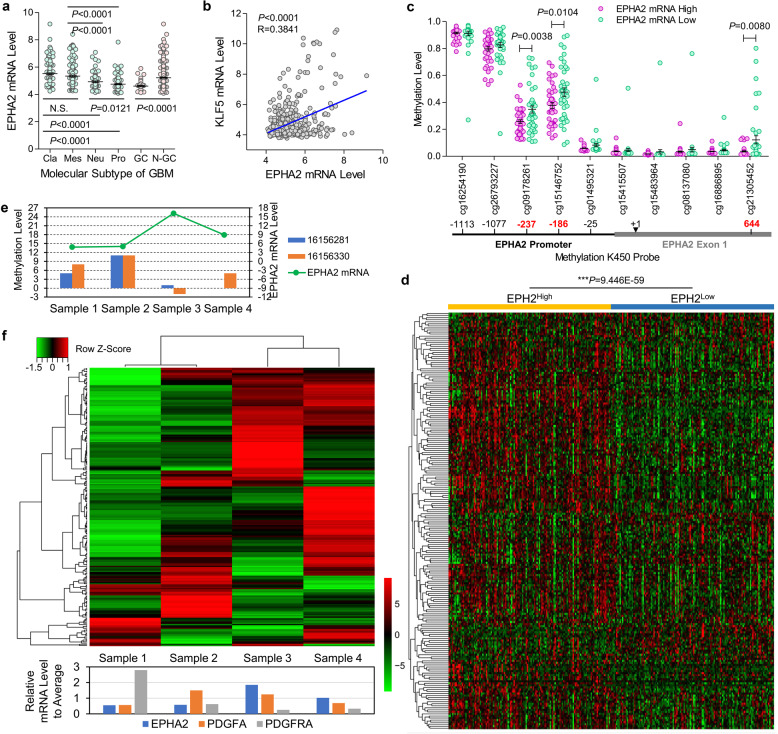
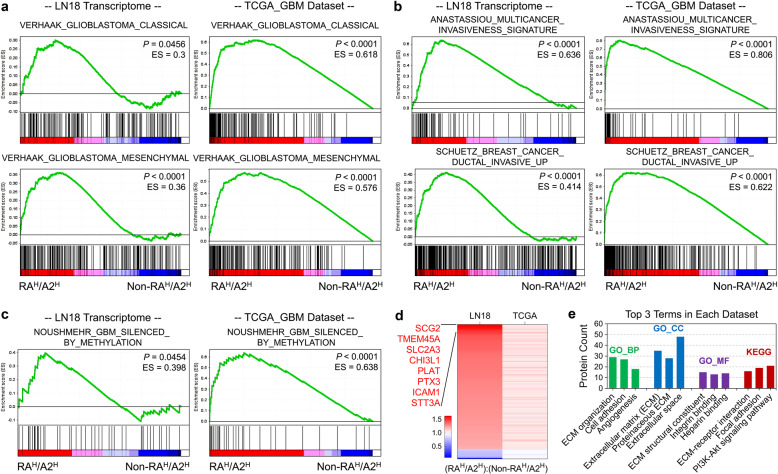
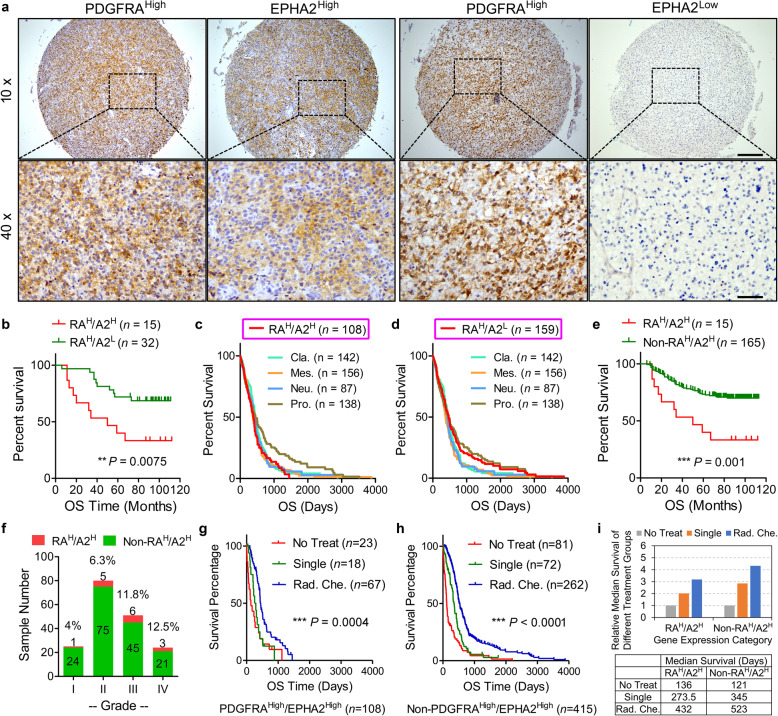
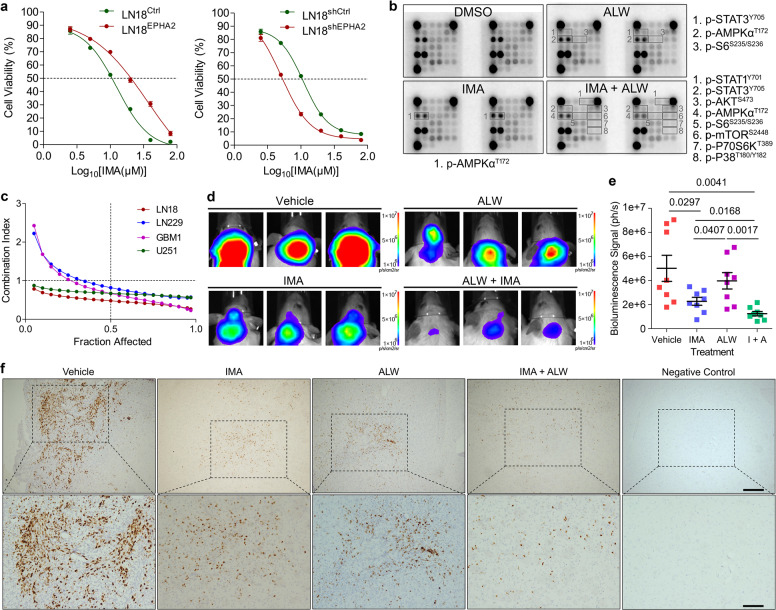
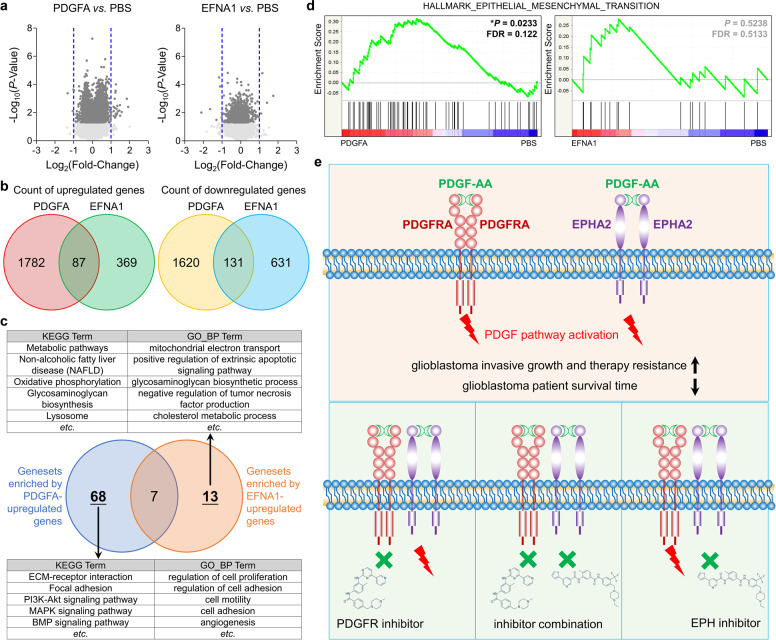
Platelet-derived growth subunit A (PDGFA) plays critical roles in development of glioblastoma (GBM) with substantial evidence from TCGA database analyses and in vivo mouse models. So far, only platelet-derived growth receptor α (PDGFRA) has been identified as receptor for PDGFA. However, PDGFA and PDGFRA are categorized into different molecular subtypes of GBM in TCGA_GBM database. Our data herein further showed that activity or expression deficiency of PDGFRA did not effectively block PDGFA activity. Therefore, PDGFRA might be not necessary for PDGFA function.To profile proteins involved in PDGFA function, we performed co-immunoprecipitation (Co-IP) and Mass Spectrum (MS) and delineated the network of PDGFA-associated proteins for the first time. Unexpectedly, the data showed that EPHA2 could be temporally activated by PDGFA even without activation of PDGFRA and AKT. Furthermore, MS, Co-IP, in vitro binding thermodynamics, and proximity ligation assay consistently proved the interaction of EPHA2 and PDGFA. In addition, we observed that high expression of EPHA2 leaded to upregulation of PDGF signaling targets in TCGA_GBM database and clinical GBM samples. Co-upregulation of PDGFRA and EPHA2 leaded to worse patient prognosis and poorer therapeutic effects than other contexts, which might arise from expression elevation of genes related with malignant molecular subtypes and invasive growth. Due to PDGFA-induced EPHA2 activation, blocking PDGFRA by inhibitor could not effectively suppress proliferation of GBM cells, but simultaneous inhibition of both EPHA2 and PDGFRA showed synergetic inhibitory effects on GBM cells in vitro and in vivo. Taken together, our study provided new insights on PDGFA function and revealed EPHA2 as a potential receptor of PDGFA. EPHA2 might contribute to PDGFA signaling transduction in combination with PDGFRA and mediate the resistance of GBM cells to PDGFRA inhibitor. Therefore, combination of inhibitors targeting PDGFRA and EHA2 represented a promising therapeutic strategy for GBM treatment.


Conflict of interest statement

The authors declare no competing interests. X.-W.B. is the editorial board member of Signal Transduction and Targeted Therapy, but he has not been involved in the process of the manuscript handling.

Figures

Fig. 1
Fig. 1
PDGFRA is not necessary for PDGFA function in GBM cells. a Kaplan–Meier survival analysis of cases with PDGFAHigh vs. PDGFALow from TCGA_GBM database. b PDGFA gene expression in TCGA PanCancer databases. c PDGFA-induced temporal expression of indicated proteins in LN18 cells pre-treated with vehicle or IMA. β-actin is used as loading control. d PDGFA-induced temporal expression of indicated proteins in LN18 cells transfected with control CRISPR/Cas9 or CRISPR/Cas9 targeting PDGFRA. e, f Enrichment of PDGF signaling-related genesets for TCGA_GBM cases with PDGFAHigh/PDGFRAHigh vs. PDGFALow or PDGFAHigh/PDGFRALow vs. PDGFALow. g Categorization of PDGFA-associated proteins. h Significantly enriched KEGG pathways involving PDGFA through KEGG analysis on PDGFA interactome.
Fig. 2
Fig. 2
PDGFA activates EPHA2 in a PDGFRA-independent manner in GBM cells. a PDGFA-induced temporal expression of indicated proteins in LN18 cells examined by western blotting. β-actin is used as loading control. b PDGFA-induced temporal expression of indicated proteins in LN18 Sphere examined by western blotting. c PDGF-A-induced temporal expression of indicated proteins in LN18 cells pre-treated with DMSO and MK2206. d PDGFA-induced temporal expression of indicated proteins in LN18 cells infected with lentivirus containing control sgRNA or sgRNA targeting PDGFRA. e PDGFA-induced temporal expression of indicated proteins in LN18 cells pre-treated with vehicle or IMA. f Representative immunofluorescence images stained by antibodies targeting EPHA2 and EEA1, respectively. DAPI is used to label nuclei. Scale bar = 10 μm for large four panels and 5 μm for small four panels. g Co-immunoprecipitation and western blotting of EPHA2 in PDGFA-treated LN18 cells. h Interaction simulation of three-dimension structure of PDGFA and EPHA2 extracellular domain. i Interaction thermodynamics of recombinant human EPHA2 extracellular domain and recombinant human PDGF-AA using Microcal iTC200. j Proximity ligation assay using LN18 cells without treatment, treated with PDGFA for 15 min, or pre-treated with recombinant PDGFRA extracellular domain followed by PDGFA treatment for 15 min. The cells is counterstained with Dapi (blue) to mark nuclei. Green dot signals represent interaction between EPHA2 and PDGFA. Scale Bar = 25 μm. k PDGFA-induced temporal expression of indicated proteins in LN18 cells infected with lentivirus containing control shRNA or shRNA targeting EPHA2.
Fig. 3
Fig. 3
EPHA2 expression regulation and relationship with PDGF downstream targets. a EPHA2 expression in different molecular subtypes of GBM in TCGA_GBM database. b Pearson correlation of EPHA2 and KLF5 in TCGA_GBM database. c Methylation levels of EPHA2 promoter region measured with methylation K450 probes. d Heatmap cluster analysis of PDGF signaling target genes with EPHA2High vs. EPHA2Low in TCGA_GBM database. e The methylation level in promoter region corresponding to two critical probes at EPHA2 promoter from TCGA_GBM and the EPHA2 mRNA level in four tumor foci from a multifocal GBM patient. f Upper: Heatmap cluster analysis of PDGF signaling target genes in the four tumor foci; Lower: mRNA expression of EPHA2, PDGFA, and PDGFRA in the four tumor foci.
Fig. 4
Fig. 4
Transcriptomic analyses on PDGFRA and EPHA2 co-upregulation in GBM cells. a Enrichment of signature genes of GBM molecular subtype for LN18 cells with co-transfection of EPHA2 and PDGFRA (RAH/A2H) vs. individual transfection (Non-RAH/A2H) (left two panels), as well as, cases with PDGFRAHigh/EPHA2High (RAH/A2H) vs. all other (Non-RAH/A2H) cases from TCGA_GBM mRNA expression dataset (right two panels). b Enrichment of signature genes of invasive growth for LN18 cells with RAH/A2H vs. Non-RAH/A2H cases (left two panels), as well as, cases with RAH/A2H vs. Non-RAH/A2H from TCGA_GBM mRNA expression dataset (right two panels). c Enrichment of signature genes of GBM G-CIMP subtype for LN18 cells with RAH/A2H vs. Non-RAH/A2H (left panel), as well as, cases with RAH/A2H vs. Non-RAH/A2H cases from TCGA_GBM mRNA expression dataset (right panel). d Heatmap graph of consistently altered genes in LN18 cells with RAH/A2H vs. Non-RAH/A2H (left lane) and cases with RAH/A2H vs. Non-RAH/A2H cases from TCGA_GBM mRNA expression dataset (right lane). e David analysis on consistently altered genes in LN18 cells with RAH/A2H vs. Non-RAH/A2H (left lane) and cases with RAH/A2H vs. Non-RAH/A2H cases from TCGA_GBM mRNA expression dataset (right lane). Categories with tops 3 protein counts are showed in the graph.
Fig. 5
Fig. 5
Clinical significance of EPHA2 and PDGFRA in GBM. a Representative immunohistochemistry images of EPHA2 and PDGFRA proteins on continuous tissue sections. Scale Bar = 200 μm (upper) and 50 μm (lower). b Kaplan–Meier survival analysis on cases with PDGFRAHigh/EPHA2High vs. PDGFRAHigh/EPHA2Low from our glioma cohort. c Survival curve comparison between cases with PDGFRAHigh/EPHA2High and different molecular subtypes according to TCGA_GBM mRNA expression dataset. d Survival curve comparison between cases with PDGFRAHigh/EPHA2Low and different molecular subtypes according to TCGA_GBM mRNA expression dataset. e Kaplan–Meier survival analysis on cases with PDGFRAHigh/EPHA2High vs. all other cases from our glioma cohort. f Case count with different protein expression patterns from our glioma cohort according to tumor grades. g, h Kaplan–Meier survival analysis of different treatment ways under specific gene expression patterns according to TCGA_GBM database. i Therapeutic effects of treatment ways on survival time of patients with specific gene expression patterns.
Fig. 6
Fig. 6
Co-inhibition of PDGFRA and EPHA2 synergetically inhibits GBM cells. a IC50 measurement of LN18 cells with forced expression of EPHA2 (left panel) or knockdown of EPHA2 (right panel) through MTT assay. b Antibody array analysis of LN18 cells treated with vehicle, EPHA2 inhibitor (ALW), and PDGFRA inhibitor (IMA). Significant changed proteins are labeled with frame and listed separately. c MTT assay-based drug combination evaluation in four GBM cell lines. d Representative images of orthotopic growth of U251 cells treated with vehicle, IMA, ALW, or IMA + ALW. e Statistic graph of tumor size using bioluminescence signal intensity. n = 8 for each group. f Representative immunohistochemistry images of Ki67 on tissue sections from mice with orthotopic GBM tumors treated by vehicle, IMA, ALW, or IMA + ALW. Scale Bar = 200 μm (upper) and 100 μm (lower).
Fig. 7
Fig. 7
Analysis on transcriptomes of LN18PDGFRA−/− treated with PBS, PDGFA or EFNA1. a Volcano graph of genes affected by PDGFA or EFNA1 vs. PBS. b Venn diagram of genes affected by PDGFA or EFNA1 vs. PBS. c Venn diagram of genesets enriched by PDGFA or EFNA1-upreguleted genes. d GSEA graph of EMT hallmark signature enriched by PDGFA or EFNA1-regulated genes. e Schematic diagram of EPHA2 and PDGFRA-mediated PDGFA function in GBM cells. Both PDGFRA and EPHA2 mediate PDGFA function to promote invasive growth and therapeutic resistance of GBM cells (upper panel). Single pharmaceutical inhibition of EPHA2 or PDGFRA cannot effectively suppress PDGFA activity due to the existence of compensate pathway. Concurrent inhibition of PDGFRA and EPHA2, however, potently block PDGFA signaling transduction (lower panels).

References

    1. Louis DN, et al. The 2016 World Health Organization Classification of Tumors of the Central Nervous System: a summary. Acta Neuropathol. 2016;131:803–820. - PubMed
    1. Smoll NR, et al. Relative survival of patients with supratentorial low-grade gliomas. Neuro Oncol. 2012;14:1062–1069. - PMC - PubMed
    1. Ohgaki H, Kleihues P. Population-based studies on incidence, survival rates, and genetic alterations in astrocytic and oligodendroglial gliomas. J. Neuropathol. Exp. Neurol. 2005;64:479–489. - PubMed
    1. Whittle IR. The dilemma of low grade glioma. J. Neurol. Neurosurg. Psychiatry. 2004;75(Suppl 2):ii31–ii36. - PMC - PubMed
    1. Abrigo JM, et al. Magnetic resonance perfusion for differentiating low-grade from high-grade gliomas at first presentation. Cochrane Database Syst. Rev. 2018;1:CD011551. - PMC - PubMed

Publication types

MeSH terms

Substances