. 2022 Feb 1;13(1):604.
doi: 10.1038/s41467-022-28198-8.

PPM1D mutations are oncogenic drivers of de novo diffuse midline glioma formation

Affiliations

PPM1D mutations are oncogenic drivers of de novo diffuse midline glioma formation

Prasidda Khadka et al. Nat Commun. .

Abstract

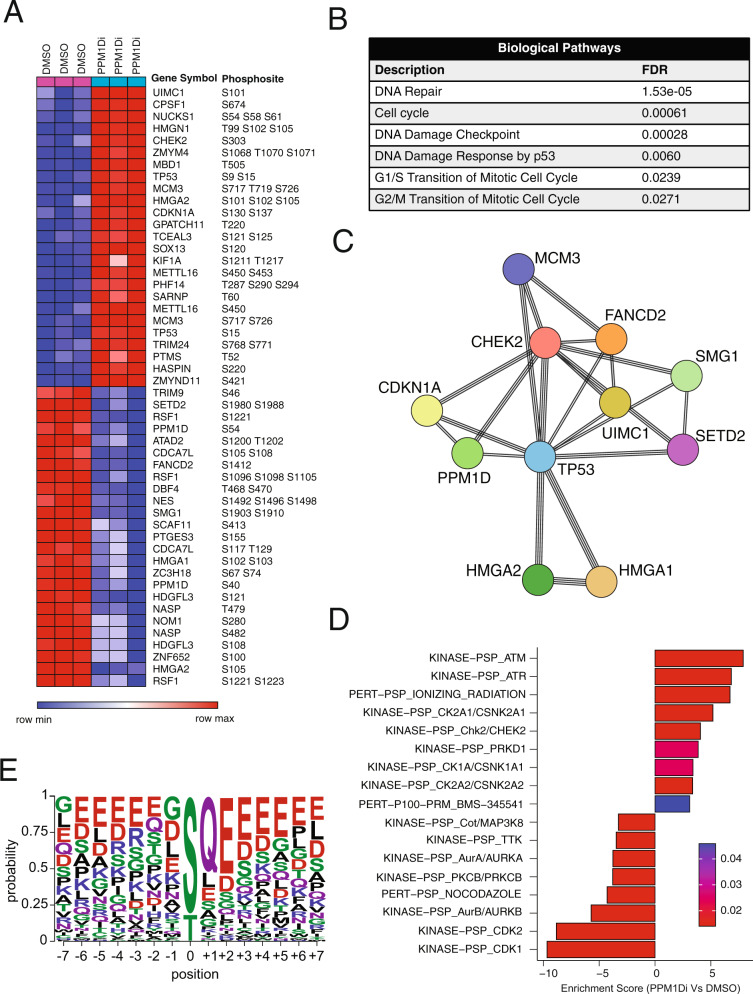
The role of PPM1D mutations in de novo gliomagenesis has not been systematically explored. Here we analyze whole genome sequences of 170 pediatric high-grade gliomas and find that truncating mutations in PPM1D that increase the stability of its phosphatase are clonal driver events in 11% of Diffuse Midline Gliomas (DMGs) and are enriched in primary pontine tumors. Through the development of DMG mouse models, we show that PPM1D mutations potentiate gliomagenesis and that PPM1D phosphatase activity is required for in vivo oncogenesis. Finally, we apply integrative phosphoproteomic and functional genomics assays and find that oncogenic effects of PPM1D truncation converge on regulators of cell cycle, DNA damage response, and p53 pathways, revealing therapeutic vulnerabilities including MDM2 inhibition.


Conflict of interest statement

R.B. and P.B. receive grant funding from the Novartis Institute of Biomedical Research for an unrelated project. P.B. has received grant funding from Deerfield and reports a consulting role for QED Therapeutics, R.B. reports consulting or advisory role for Novartis, Merck (I), Gilead Sciences (I), ViiV Healthcare (I); research funding from Novartis; patents, royalties, other intellectual property—Prognostic Marker for Endometrial Carcinoma (US patent application 13/911456, filed June 6, 2013), SF3B1 Suppression as a Therapy for Tumors Harboring SF3B1 Copy Loss (international application No. WO/2017/177191, PCT/US2017/026693, filed July 4, 2017), Compositions and Methods for Screening Pediatric Gliomas and Methods of Treatment Thereof (international application No. WO/2017/132574, PCT/US2017/015448, filed 1/27/2017). M.W.K. is now an employee of Bristol-Myers Squibb. F.P. is now an employee of Merck Research Laboratories. S.A.C. is a member of the scientific advisory boards of Kymera, PTM BioLabs and Seer and a scientific advisor to Pfizer and Biogen. D.E.R. receives research funding from Abbvie, Jannsen, Merck, and Vir through the Functional Genomics Consortium and serves on the board of directors of Addgene. B.L.E. has received research funding from Celgene and Deerfield. He has also received consulting fees from GRAIL, and he serves on the scientific advisory boards for and holds equity in Skyhawk Therapeutics and Exo Therapeutics. (I) denotes a competing interest involving a first degree relative of the author. All the remaining authors declare no competing interests.

Figures

Fig. 1
Fig. 1. PPM1D mutations are oncogenic drivers of DMGs.
A Comutation plot showing alterations in histones (H3F3A and HIST1H3B), TP53, and PPM1D in 170 midline and non-midline gliomas. Variants observed are depicted below. B Lollipop plot of recurrent C-terminus PPM1D truncating mutations observed in DMGs. The position of nucleotide variants are shown. *Depicts nonsense or truncating alterations. C Percentage of samples with PPM1D truncating mutations across different adult and pediatric tumors including DMG dataset from our study. D Kaplan–Meier survival curves for H3.3K27M+PdgfraD842V IUE DMG mouse models with LacZ gRNA (n = 18) or Ppm1d gRNA (n = 17). P < 0.0001 between LacZ gRNA vs Ppm1d gRNA conditions calculated using log-rank Mantel–Cox test. E Brightfield and GFP images of LacZ and Ppm1d gRNA IUE DMGs showing GFP-positive tumor regions, and H&E-stained images depicting high-grade glioma histology. Scale bar denotes 2.5 mm (brightfield and GFP) and 50 μm (H&E). Similar staining was performed in a minimum of three independent samples. F Ppm1d gRNA IUE DMG sections stained with Olig2, Gfap, Ki67, or GFP. Scale bar denotes 50 μm. Similar staining was performed in a minimum of three independent samples. Source data are provided as a Source Data file.
Fig. 2
Fig. 2. Expression of human PPM1Dtr potentiates DMG formation in vivo and requires the PPM1D phosphatase domain.
A Plot showing ranked list of genes based on their expression Z-score in Ppm1d gRNA IUE DMG (n = 3 tumors). Top genes with expression Z-score > 15 are depicted. B Venn diagram showing highly expressed genes (Z-score > 2) in Ppm1d gRNA IUE DMG (n = 3), PPM1D-mutant human DMGs (n = 7), and the overlap between two datasets. Total number of genes analyzed in both datasets is shown outside the box. P < 6.27e−100 calculated using hypergeometric distribution. C Kaplan–Meier survival curves for control (n = 19), PPM1Dtr (n = 20), and PPM1Dtr-D314A (n = 10) IUE DMG mouse models. P = 0.002 between control vs. PPM1Dtr conditions calculated using log-rank Mantel–Cox test. D Brightfield and GFP images of control, PPM1Dtr, and PPM1Dtr-D314A IUE DMGs showing GFP-positive tumor regions, and H&E-stained images depicting high-grade glioma histology. Scale bar denotes 2.5 mm (brightfield and GFP) and 50 μm (H&E). Similar staining was performed in a minimum of three independent samples. E Control, PPM1Dtr, and PPM1Dtr-D314A IUE DMG sections stained with Olig2, Gfap, or Ki67. Scale bar denotes 50 μm. F Quantification of the percentage of Ki67-positive cells in Control (n = 9), PPM1Dtr (n = 8), and PPM1Dtr-D314A (n = 6) IUE DMG models. Data presented as mean ± SEM. P < 0.0001 for both control vs PPM1Dtr and PPM1Dtr vs PPM1Dtr-D314A conditions calculated using two-tailed t-test. Source data are provided as a Source Data file.
Fig. 3
Fig. 3. PPM1D is a dependency in PPM1Dtr but not PPM1D-WT cell lines.
A Fold change in proliferation compared to day 0 of PPM1D-mutant patient-derived cell line (PDCL) BT869 after transfection with PPM1D-KO sgRNAs, nontargeting (LacZ) sgRNA, or lethal (EXOSC8) sgRNA. Growth curves show mean ± SEM from three replicates and are representative of three independent experiments. P = 0.0021, 0.0011, and 0.0016 for PPM1D-KO #1, PPM1D-KO #2, and EXOSC8 respectively calculated using two-tailed t-test. B Growth of PPM1D-WT PDCL SU-DIPG-IV after transfection with indicated sgRNAs. Growth curves show mean ± SEM from three replicates and are representative of three independent experiments. P = 0.8963, 0.5524, and 0.0335 for PPM1D-KO #1, PPM1D-KO #2, and EXOSC8 respectively calculated using two-tailed t-test. C Probability of PPM1D dependency as determined by pooled CRISPR-cas9 assays across 558 cancer cell lines, subgrouped according to their TP53 mutation and PPM1D copy-number status. Bounds of the box represent the IQR, center represents the median, and the bounds of the whiskers represent 1.5 times IQR. P < 0.0001 for TP53 WT/PPM1D non-amplified cells vs both TP53-mutant/PPM1D-amplified and TP53-mutant/PPM1D non-amplified cells and P < 0.01 for TP53 WT/PPM1D non-amplified cells vs TP53 WT/PPM1D-amplified cells using Kruskal–Wallis test. D Growth of PPM1D-mutant colon cell line HCT116 after transfection with indicated sgRNAs. Growth curves show mean ± SEM from three replicates and are representative of three independent experiments. P = 0.0015, 0.0010, and 0.0059 for PPM1D-KO #1, PPM1D-KO #2, and EXOSC8 respectively calculated using two-tailed t-test. EF Growth of PPM1D-mutant DMG cell lines BT869 (E) and SF7761 (F) after treatment with vehicle control (NT), 10 μM of GSK2830371 (PPM1Di), 2 Gy of ionizing radiation treatment (RT), or the combination of both (GSK + RT). Growth curves show mean ± SEM from at least three replicates and are representative of three independent experiments. BT869: P = 4.90083E-06, 2.18655E−07, 3.83657E−11, 2.8877E−11, and 1.1625E−06 for NT vs PPM1Di, NT vs RT, NT vs PPM1Di + RT, RT vs PPM1Di + RT, and PPM1Di vs PPM1D + RT respectively calculated using two-tailed t-test; SF7761: P = 0.003367278, 1.17616E−05, 5.59401E−08, 1.5694E−08, and 2.698E−05 for NT vs PPM1Di, NT vs RT, NT vs PPM1Di + RT, RT vs PPM1Di + RT, and PPM1Di vs PPM1D + RT respectively calculated using two-tailed t-test. Source data are provided as a Source Data file.
Fig. 4
Fig. 4. PPM1D suppresses apoptosis, DDR, and p53 pathways.
Apoptosis and cell cycle responses were assessed in isogenic mouse neural stem cells (mNSCs) overexpressing H3F3A K27M (H3K27M) mutation plus either eGFP (vector control), full-length PPM1D (PPM1D FL), or C-terminus truncated PPM1D (PPM1Dtr) (AB). A Cells were treated with 8 Gy of ionizing radiation (RT) or no treatment (NT) for 24 h, incubated with Annexin V-APC and Propidium Iodide (PI), and analyzed using flow cytometry. The total percentage of Annexin V positive cells representing both early and late apoptotic cells are shown. Data presented as mean ± SEM from three biological replicates. P = 0.027, 0.318, 0.044, 0.037 for GFP vs PPM1Dtr (NT), GFP vs PPM1D FL (NT), GFP vs PPM1Dtr (RT) and GFP vs PPM1D-FL (RT) conditions respectively calculated using two-tailed t-test. B Cells were treated with 8 Gy RT for 24 h and integration of BrdU was assessed to determine the percentage of cells in S-phase. Anti-BrdU APC and 7-AAD DNA staining were used to distinguish cells in each stage of the cell cycle. Data presented as mean ± SEM from three biological replicates. P = 0.276, 0.090 0.008, 0.005, 0.543, 0.848 for GFP vs PPM1D FL (G0/G1) GFP vs PPM1Dtr (G0/1), GFP vs PPM1D FL (S) GFP vs PPM1Dtr (S), GFP vs PPM1D FL (G2/M) GFP vs PPM1Dtr (G2/M) conditions respectively calculated using two-tailed t-test. C Cells were treated with 8 Gy of RT and lysates were collected at baseline (NT), 1 and 5 h post-RT respectively, and probed with the indicated antibodies. Three independent experiments were performed with similar results. D PPM1D-mutant patient-derived DMG cell lines BT869 and SF7761 were treated with 10 μM of GSK2830371 (PPM1Di) and/or 8 Gy of RT for 1 and 5 h, lysed and probed with indicated antibodies. Three independent experiments were performed with similar results. E Volcano plot showing differentially expressed genes in BT869 and SF7761 DMG cells (n = 3 per cell line per condition) treated with 10 μM of GSK2830371 (PPM1Di) for 5 h compared to vehicle treatment. Genes in the p53 signaling pathway are labeled. F GSEA enrichment plots of two p53 related pathways significantly enriched (FDR < 0.25) after inhibition of PPM1D in BT869 and SF7761 cells. Source data are provided as a Source Data file.
Fig. 5
Fig. 5. Phosphoproteomic analysis of PPM1D substrates in PPM1D-mutant cell lines.
A Patient-derived PPM1D-mutant DMG cell line BT869 was treated with 10 μM of the PPM1D inhibitor GSK2830371 (or DMSO vehicle control) for 5 hours to suppress the PPM1D phosphatase following which phosphoproteomic profiling was performed. A Heatmap of top 50 differentially altered phosphosites (LFC > 1 and FDR < 0.01) between GSK2830371 treated (PPM1Di) and vehicle-treated (DMSO) samples is shown. Experiments were performed in triplicates. B Pathway enrichment analysis using STRING reveals significantly associated biological pathways among phosphosites shown in (A) and, (C) Associated core interactome following PPM1D suppression. D Significantly enriched or downregulated pathways (FDR < 0.05) revealed by PTM-SEA analysis of the phosphosites between the two conditions. Positive and negative enrichment scores correspond to biological pathways upregulated and downregulated respectively in GSK2830371 treated (PPM1Di) samples compared to vehicle-treated (DMSO) samples. E Motif analysis showing conserved amino acids flanking 97 confidently localized phosphorylation sites that are upregulated upon PPM1D inhibition in BT869 cells (LFC > 1, FDR < 0.01) and their associated probability of occurrence at that position.
Fig. 6
Fig. 6. MDM2 inhibition is a dependency in PPM1D-mutant DMGs.
A Volcano plot of genetic dependencies associated with mNSC overexpressing PPM1Dtr as revealed by genome-wide loss of function CRISPR-cas9 screen. Average LFC of normalized reads for each gene across three replicate experiments, and associated p-values are shown. A negative LFC represents depletion of guides across the assay. Genes that reach the FDR cutoff of 0.25 are labeled in red. B Gene-sets significantly enriched (FDR < 0.05) within the dependencies associated with PPM1Dtr-expressing mNSCs following removal of pan-essential genes. C Genes ranked by Pearson correlation of PPM1D dependency (CERES score) against dependency of all other genes (CERES score) across 738 cancer cell lines. D Correlation between PPM1D dependency (CERES score) and response to Nutlin-3 treatment (AUC) across 309 cancer cell lines. Pearson correlation coefficient and associated two-tailed p-value of the coefficient are shown. Error bars represent 95% confidence interval. E RT-qPCR quantification of MDM2 expression in BT869 cell line infected with shRNA targeting GFP or MDM2 (two independent shRNA). Results show mean ± SEM for four replicates and are representative of three independent experiments. P = 6.66e−13 and 3.34e−11 for GFP vs shRNA MDM2#1 and GFP vs shRNA MDM2 #2 respectively using two-tailed t-test. F Growth of BT869 cells with MDM2 knockdown from (E). Growth curves are mean ± SEM for at least three replicates and are representative of three independent experiments. P = 3.67e−08 and 6.34e−10 for GFP vs shRNA MDM2#1 and GFP vs shRNA MDM2 #2 at 156 h respectively using two-tailed t-test. GI Drug response curves for a panel of two PPM1D-mutant and two PPM1D-WT DMG cell lines treated with different concentrations of MDM2 inhibitors AMG232 (G), RG7388 (H), and Nutlin-3 (I) as indicated. Data presented as mean ± SEM from three independent experiments. Source data are provided as a Source Data file.
Fig. 7
Fig. 7. Integrative analysis of PPM1D-mutant DMG models.
Schematic depicting the overall method and findings of the study. Top panel: an array of models used in the study including biopsy of DMG tumors, de novo mouse models of PPM1D driven DMG using in utero electroporation, and in vitro models including patient-derived cell lines. Middle panel: integrative approach employing whole-genome sequencing of patient tumors, gene expression analysis, proteomics, and phosphoproteomics screens, and CRISPR screens used to study the function and mechanism of PPM1D mutation in DMG. Bottom panel: convergence of the oncogenic function of PPM1Dtr on p53, cell cycle and DDR pathways using the integrative approach in the middle panel.

References

    1. Schwartzentruber J, et al. Driver mutations in histone H3.3 and chromatin remodelling genes in paediatric glioblastoma. Nature. 2012;482:226–231. doi: 10.1038/nature10833. - DOI - PubMed
    1. Wu G, et al. Somatic histone H3 alterations in pediatric diffuse intrinsic pontine gliomas and non-brainstem glioblastomas. Nat. Genet. 2012;44:251–253. doi: 10.1038/ng.1102. - DOI - PMC - PubMed
    1. Taylor KR, et al. Recurrent activating ACVR1 mutations in diffuse intrinsic pontine glioma. Nat. Genet. 2014;46:457–461. doi: 10.1038/ng.2925. - DOI - PMC - PubMed
    1. Wu G, et al. The genomic landscape of diffuse intrinsic pontine glioma and pediatric non-brainstem high-grade glioma. Nat. Genet. 2014;46:444–450. doi: 10.1038/ng.2938. - DOI - PMC - PubMed
    1. Zhang L, et al. Exome sequencing identifies somatic gain-of-function PPM1D mutations in brainstem gliomas. Nat. Genet. 2014;46:726–730. doi: 10.1038/ng.2995. - DOI - PMC - PubMed

Publication types

MeSH terms

Substances