. 2022 Feb 1;13(1):611.
doi: 10.1038/s41467-022-28226-7.

Generation of the organotypic kidney structure by integrating pluripotent stem cell-derived renal stroma

Affiliations

Generation of the organotypic kidney structure by integrating pluripotent stem cell-derived renal stroma

Shunsuke Tanigawa et al. Nat Commun. .

Erratum in

Abstract

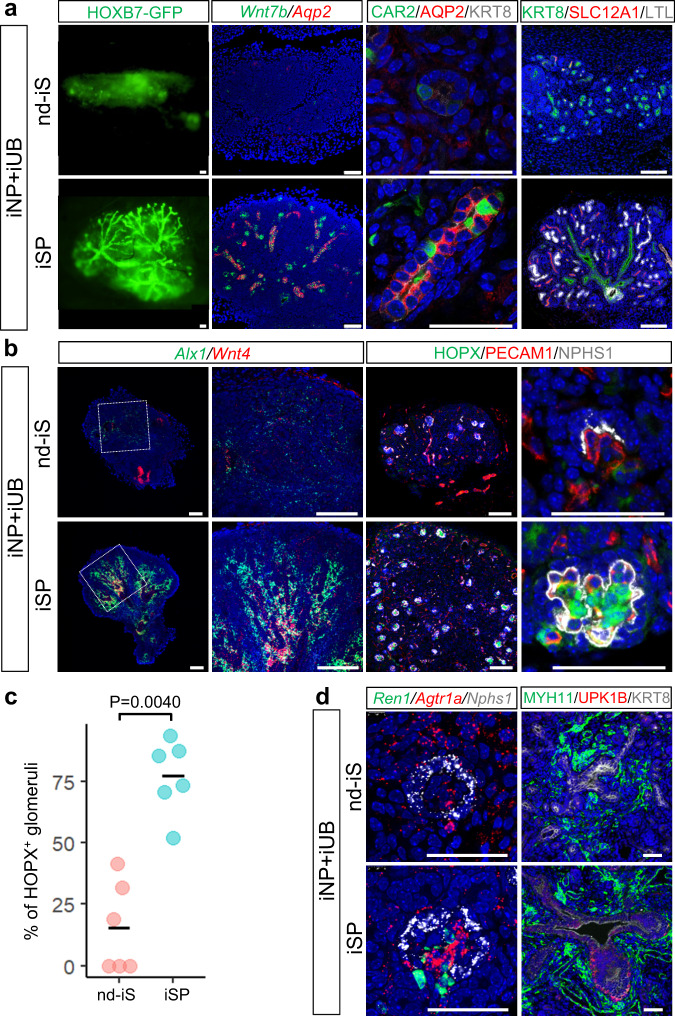
Organs consist of the parenchyma and stroma, the latter of which coordinates the generation of organotypic structures. Despite recent advances in organoid technology, induction of organ-specific stroma and recapitulation of complex organ configurations from pluripotent stem cells (PSCs) have remained challenging. By elucidating the in vivo molecular features of the renal stromal lineage at a single-cell resolution level, we herein establish an in vitro induction protocol for stromal progenitors (SPs) from mouse PSCs. When the induced SPs are assembled with two differentially induced parenchymal progenitors (nephron progenitors and ureteric buds), the completely PSC-derived organoids reproduce the complex kidney structure, with multiple types of stromal cells distributed along differentiating nephrons and branching ureteric buds. Thus, integration of PSC-derived lineage-specific stroma into parenchymal organoids will pave the way toward recapitulation of the organotypic architecture and functions.


Conflict of interest statement

The authors declare no competing interests.

Figures

Fig. 1
Fig. 1. RA, FGF, and BMP signaling regulate dorsoventral patterning of renal SPs.
a Three domains of SPs, shown by immunostaining of the kidney at E11.5. Two biologically independent mice were examined in two separate experiments. Left panel: FOXD1+ dorsal SPs (green); middle panel: TBX18+ intermediate SPs (green); right panel: ISL1+ ventral SPs (magenta). SIX2 and KRT8 are also stained to mark NPs and UBs, respectively. Scale bars: 15 μm. be scRNA-seq analysis of the stromal cells in the mouse E11.5 kidney. b UMAP plots showing five clusters, with two representing Top2a+ proliferating cells. Representative genes in dorsal, intermediate, and ventral SPs, shown as UMAP plots (c) and dot plots (d). e UMAP plots showing signal-related genes. f Schematic diagram of isolation of Osr1-GFP+ cells from E9.5 embryos, followed by a 2-day culture. gi Expression of stromal domain-related genes after the culture, analyzed by qRT-PCR. g RA induces dorsal SP-related genes (n = 5 biologically independent experiments). h, i RA and FGF9 induce dorsal SP-related genes, while RA and BMP4 induce intermediate and ventral SP-related genes (n = 3 biologically independent experiments). Relative mRNA expression levels normalized to β-actin gene expression are shown as mean ± SEM. Two-sided Student’s t-test was performed in (g) and Dunnett’s multiple comparison test (two-sided) was performed in (h, i). The source data are provided as a Source Data file. F+: Foxd1-GFP+PDGFRA+ dorsal SPs harvested at E11.5 (non-cultured; presented as a reference); Y: Y27632 (10 μM ); R: RA (0.1 μM); F1: FGF9 (1 ng/ml); F10: FGF9 (10 ng/ml); F30: FGF9 (30 ng/ml); B0.1: BMP4 (0.1 ng/ml); B1: BMP4 (1 ng/ml); B10: BMP4 (10 ng/ml).
Fig. 2
Fig. 2. ROBO2+ PDGFRA+ IM is induced toward dorsal SPs in vitro.
a, b scRNA-seq analysis of the posterior part of the E9.5 mouse embryo. a UMAP plots. b Representative genes for the IM. Black arrowheads: IM; white arrowheads: LPM; arrows: neural tube (NT). NC: neural crest; HL: hindlimb bud; WD: Wolffian duct; EC: endothelial cell. c In situ hybridization of Osr1, Robo2, and Grem1 in the posterior IM at E9.5. Two biologically independent mice were examined in two separate experiments. Arrowheads: IM; arrows: LPM. Scale bars: 50 μm. d Isolation of ROBO2+PDGFRA+ cells from wild-type or Osr1-GFP embryos at E9.5, followed by a 2-day culture under the YRF condition (Y: Y27632; R: RA; F: FGF9). e Flow cytometric analysis before the culture. f Expression of IM-related genes before the culture. G+: Osr1-GFP+ cells; G−: Osr1-GFPcells; R−P+: ROBO2PDGFRA+ cells; R+P+: ROBO2+PDGFRA+ cells. Data are shown as mean ± SEM (n = 3 biologically independent experiments). Two-sided Student’s t-test was performed. g Spheres after the culture. Upper panels: Spheres from the indicated fractions. Scale bars: 100 μm. Right graph: Diameters of the spheres. Data are shown as mean ± SEM (n = 17, 36, and 31 biologically independent samples, respectively). The Tukey–Kramer test (two-sided) was performed. Lower panels: flowcytometric analysis of the induced spheres. h Expression of stromal domain-related genes after the culture. F+: Foxd1-GFP+PDGFRA+ dorsal SPs harvested at E11.5 (presented as a reference). G+: Osr1-GFP+ cells; R−P+: ROBO2PDGFRA+ cells; R+P+: ROBO2+PDGFRA+ cells. Data are shown as mean ± SEM (n = 3 biologically independent experiments). Two-sided Student’s t-test was performed. i Aggregation assay for UB branching. The ROBO2+PDGFRA+ (R+) fractions were cultured for 2 days in the indicated conditions, combined with E11.5 embryo-derived NPs and UBs (tdTomato+). Scale bars: 200 μm. PDGFRA+: freshly isolated stromal cells from E11.5 embryos used as a reference for re-aggregation. j Expression of genes related to dorsoventral patterning in GFP+ cells cultured from the ROBO2PDGFRA+ fraction of E9.5 Foxd1-GFP embryos. Data are shown as mean ± SEM (n = 3 biologically independent experiments). Two-sided Student’s t-test was performed. fh, j The source data are provided as a Source Data file.
Fig. 3
Fig. 3. Mouse ESC-derived SPs support the generation of the complex kidney structure.
a SP induction protocol from mouse ESCs. A: ActivinA (10 ng/ml); B: BMP4 (3 ng/ml); C10: CHIR (10 µM); C3: CHIR (3 µM); R: RA (0.1 μM); F: FGF9 (10 ng/ml). b Flow cytometric analysis of the induced cells at day 6.5 and 9.5. c Comparison of expression levels of stromal domain-related genes between nd-iS and iSPs. F+: Foxd1-GFP+PDGFRA+ dorsal SPs harvested at E11.5 (non-cultured; presented as a reference). Data are shown as mean ± SEM (n = 3 biologically independent experiments). Two-sided Student’s t-test was performed. The source data are provided as a Source Data file. d scRNA-seq analysis of mouse ESC-derived progenitors (iSPs, iNPs, iUBs) and E13.5 embryonic kidney. UMAP plots are shown. Arrows: dorsal SPs of the embryonic kidney. Arrowhead: nd-iS co-induced with iNP. EC: endothelial cells; Leu: leucocytes; iUB-S: stroma co-induced with iUB; *: dying cells. e UB branch numbers in the aggregates. Data are shown as mean ± SEM (n = 7, 7, and 8 biologically independent samples, respectively). The Tukey–Kramer test (two-sided) was performed. The source data are provided as a Source Data file. f Aggregates formed without stromal cells (−), with nd-iS, or with iSPs. NPs and UBs are isolated from the E11.5 embryonic kidneys. 1st column: GFP images of UBs; 2nd column: in situ hybridization of Wnt7 (UB stalks) and Ret (UB tips); 3rd column: in situ hybridization of Six2 (NPs), Foxd1 (SPs), and Ret (UB tips); 4th column: immunostaining of KRT8 (UBs), CDH1 (UBs, distal tubules), and LTL (proximal tubules); 5th column: immunostaining of KRT8 (UBs) and NPHS1 (glomerular podocytes). Scale bars: 100 μm. Six aggregates in each condition obtained from three independent experiments were analyzed.
Fig. 4
Fig. 4. Kidney organoids solely derived from ESCs exhibit the organotypic “higher-order structure” in vitro.
a Schematic diagram of kidney organoid formation. iSPs, iNPs, and iUBs derived from Hoxb7-GFP mouse ESCs are combined, and cultured at the air/liquid interface for 7 days. b UB branch numbers in kidney organoids. Data are shown as mean ± SEM (n = 16, 15, and 18 biologically independent samples, respectively). The Tukey–Kramer (two-sided) test was performed. The source data are provided as a Source Data file. c Mouse ESC-derived organoids formed without stromal cells (−), with nd-iS, or with iSPs. 1st column: GFP images of UBs; 2nd column: whole-mount immunostaining of SIX2 (NPs) and KRT8 (UBs); 3rd column: whole-mount immunostaining of KRT8 (UBs), NPHS1 (glomerular podocytes), LTL (proximal tubules), and CDH1 (UBs, distal tubules); 4th column: in situ hybridization of Wnt7 (UB stalks) and Ret (UB tips); 5th column: in situ hybridization of Six2 (NPs), Foxd1 (SPs), and Ret (UB tips); 6th column: in situ hybridization of Alx1 (medullary stroma), Lox (cortical stroma), and Fibin (outer layer of cortical stroma). Scale bars: 100 μm. Six organoids in each condition obtained from three independent experiments were analyzed. d Digitized images of the whole-mount staining data in the 2nd and 3rd columns of (c). Scale bars: 100 μm. Four organoids obtained from two independent experiments were analyzed.
Fig. 5
Fig. 5. Multiple types of interstitial cells are differentiated in the ESC-derived kidney upon transplantation.
a Differentiation of UBs and nephrons in mouse ESC-derived transplanted organoids (generated using iSPs or nd-iS). 1st column: GFP images of UBs; 2nd column: in situ hybridization of Wnt7b (UB stalks) and Aqp2 (principal cells); 3rd column: immunostaining of CAR2 (intercalated cells), AQP2 (principal cells), and KRT8 (UBs); 4th column: immunostaining of KRT8 (UBs), SLC12A1 (loops of Henle), and LTL (proximal tubules). Scale bars: columns 1–3, 50 µm; column 4, 100 µm. Six organoids in each condition obtained from three independent experiments were analyzed. b Differentiation of stromal cells. 1st column: in situ hybridization of Alx1 (medullary stroma) and Wnt4 (innermost medullar stroma); 2nd column: magnified images of the first columns; 3rd column: immunostaining of HOPX (mesangial cells), PECAM1 (ECs), and NPHS1 (glomerular podocytes); 4th column: magnified images of the 3rd columns. Scale bars: 100 μm. c Percentages of glomeruli equipped with HOPX+ mesangial cells. Data are shown as mean ± SEM. Six organoids in each condition obtained from three independent transplantation experiments were analyzed. All organoids were serially sectioned, and two sections per organoid were stained to calculate the percentages of HOPX+ mesangial cells. The non-parametric Mann–Whitney U test (two-sided) was performed. The source data are provided as a Source Data file. d Differentiation of mesangial cells and ureteric stroma. 1st column: in situ hybridization of Ren1 (renin cells), Agtra1 (mesangial cells), and Nphs1 (podocytes); 2nd column: staining of MYH11 (ureteric stroma), UPK1B (ureter epithelium), and KRT8 (UBs). Scale bars: 50 μm. All of the data were obtained at day 14 post-transplantation, except for the GFP images of UBs obtained at day 10 post-transplantation. Six organoids in each condition obtained from three independent experiments were analyzed.
Fig. 6
Fig. 6. Nephron, UB, and stromal lineages in the ESC-derived kidney express perinatal renal genes.
a UMAP plots of embryonic kidneys (E15.5 and P0) and mouse ESC-derived transplanted organoids (generated using iSPs or nd-iS). The lack of NPs and UB tips in the transplanted organoids is indicated by red and black arrows, respectively. Pod: podocytes; PEC: parietal epithelial cells; PT: proximal tubule; LoH: loop of Henle; DT: distal tubule; PC: principal cells; IC: intercalated cells; UE: uroepithelium; Ren: renin cells; Mes: mesangial cells; CS: cortical stroma; oMS: outer medullary stroma; iMS: inner medullary stroma; US: ureteric stroma; Leu: leukocytes; Lym: lymphocytes; EC: endothelial cells; *: organoid-specific clusters; #: proliferating cells. b UMAP plots of Xist. Xist is absent in nephrons, UBs, and stroma derived from male mouse ESCs, but detected in the female host-derived lymphocytes (Lym), leukocytes (Leu), and ECs. c UMAP plots of extracted stromal cells in the P0 kidney and organoids. Mes: mesangial cells; Ren: renin cells; CS: cortical stroma; oMS: outer medullary stroma; iMS: inner medullary stroma; US: ureteric stroma; SCS: subcapsular stroma; *: organoid-specific clusters; #: proliferating cells. d Unbiased hierarchal clustering analysis of the induced stroma and embryonic stroma. e UMAP plots of representative genes in the stromal cells of the embryonic kidneys (E15.5 and P0), iSP-derived organoids, and nd-iS-derived organoids. Ren: renin cells; Mes: mesangial cells; CS: cortical stroma; oMS: outer medullary stroma; iMS: inner medullary stroma; US: ureteric stroma; SCS: subcapsular stroma (red arrowhead). Black arrowheads indicate the lack of SPs in the transplanted organoids.

References

    1. Nishinakamura R. Human kidney organoids: Progress and remaining challenges. Nat. Rev. Nephrol. 2019;15:613–624. doi: 10.1038/s41581-019-0176-x. - DOI - PubMed
    1. Combes AN, et al. Single cell analysis of the developing mouse kidney provides deeper insight into marker gene expression and ligand-receptor crosstalk. Development. 2019;146:dev178673. doi: 10.1242/dev.178673. - DOI - PubMed
    1. England AR, et al. Identification and characterization of cellular heterogeneity within the developing renal interstitium. Development. 2020;147:dev190108. doi: 10.1242/dev.190108. - DOI - PMC - PubMed
    1. Han L, et al. Single cell transcriptomics identifies a signaling network coordinating endoderm and mesoderm diversification during foregut organogenesis. Nat. Commun. 2020;11:4158. doi: 10.1038/s41467-020-17968-x. - DOI - PMC - PubMed
    1. Costantini F, Kopan R. Patterning a complex organ: Branching morphogenesis and nephron segmentation in kidney development. Dev. Cell. 2010;18:698–712. doi: 10.1016/j.devcel.2010.04.008. - DOI - PMC - PubMed

Publication types