. 2022 Feb 1;13(1):590.
doi: 10.1038/s41467-022-28257-0.

PplD is a de-N-acetylase of the cell wall linkage unit of streptococcal rhamnopolysaccharides

Affiliations

PplD is a de-N-acetylase of the cell wall linkage unit of streptococcal rhamnopolysaccharides

Jeffrey S Rush et al. Nat Commun. .

Abstract

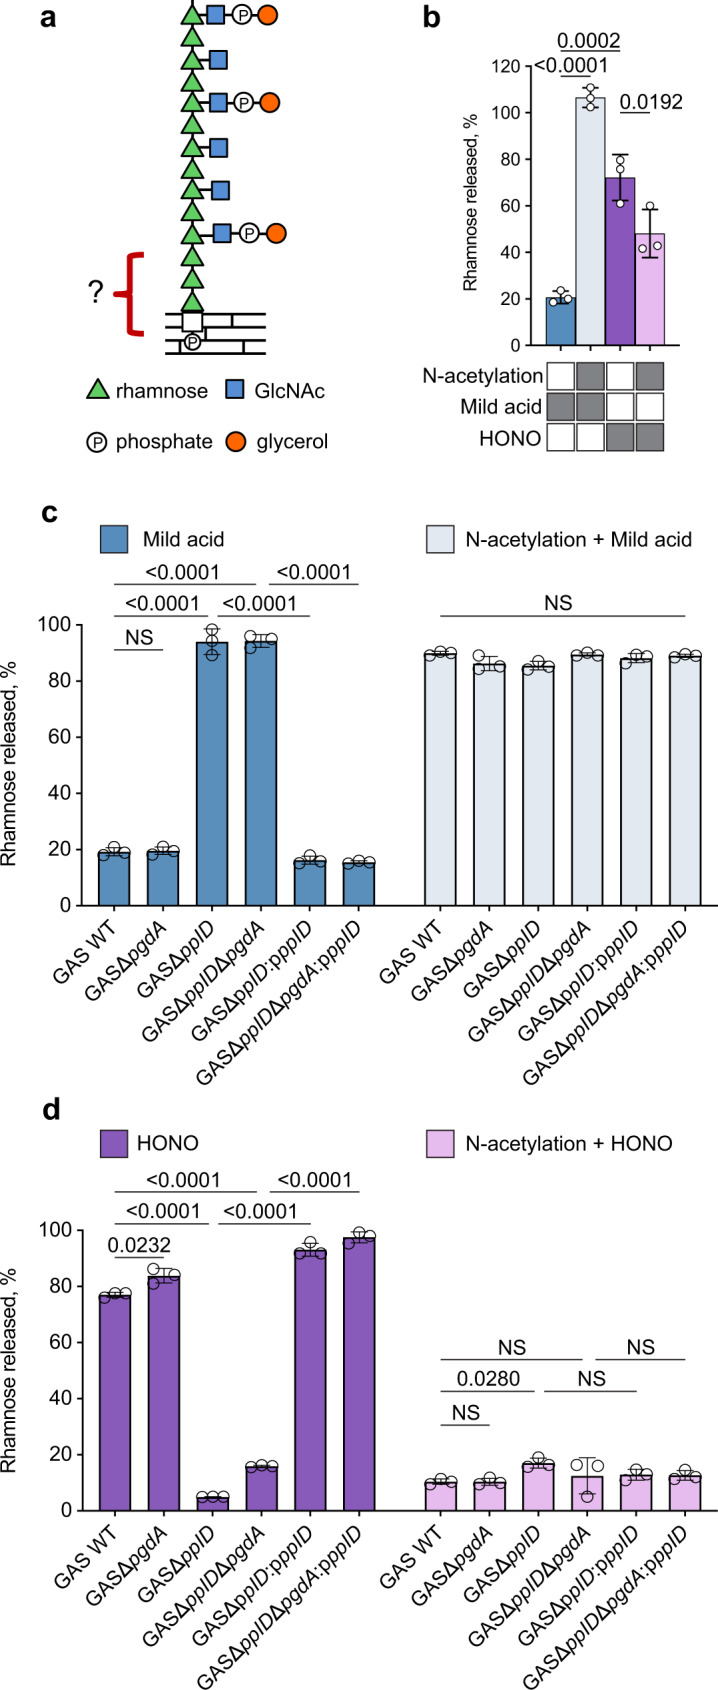
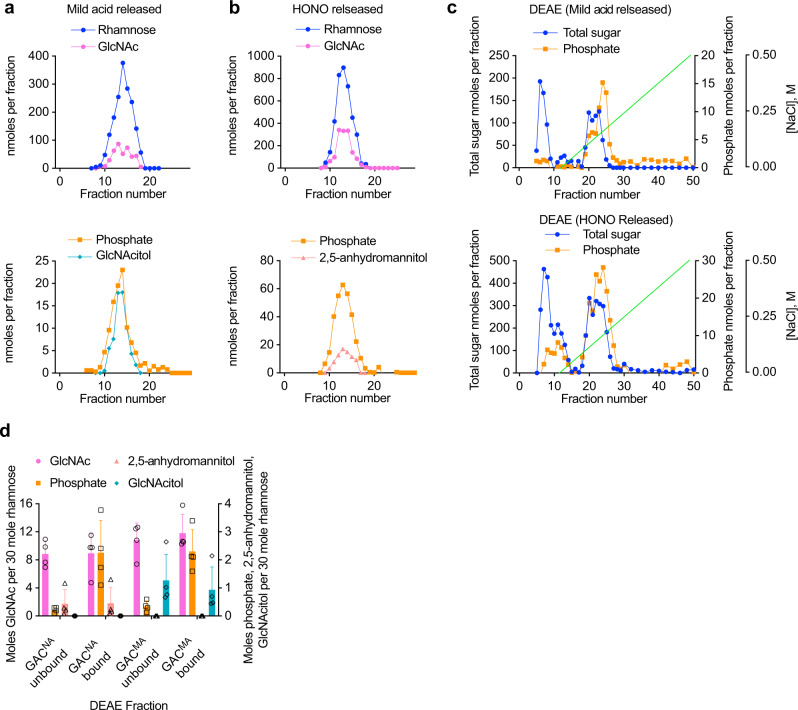
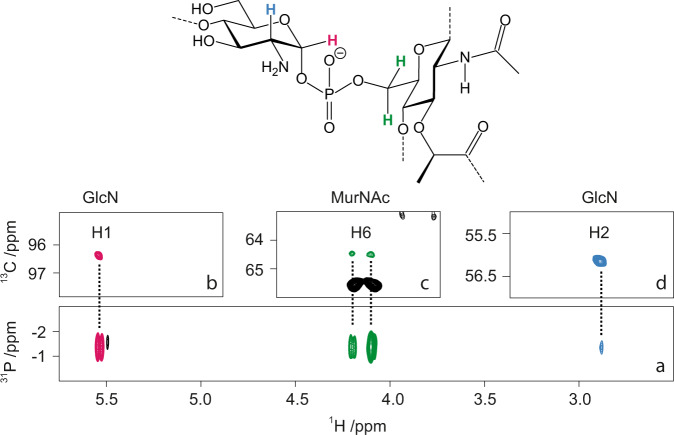
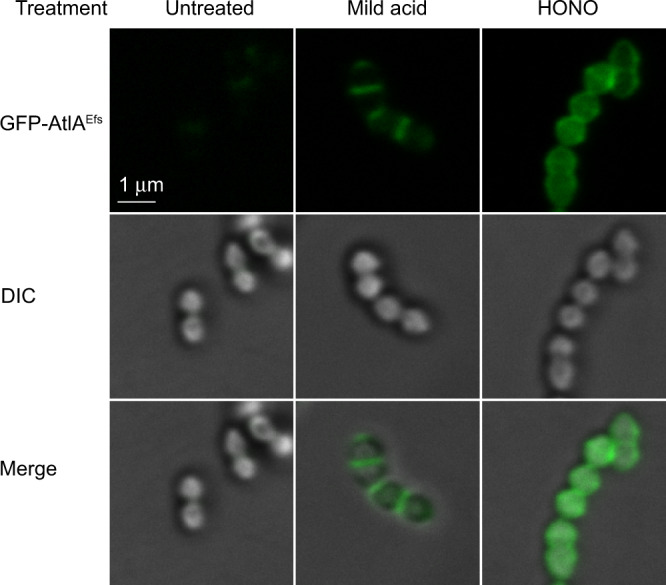
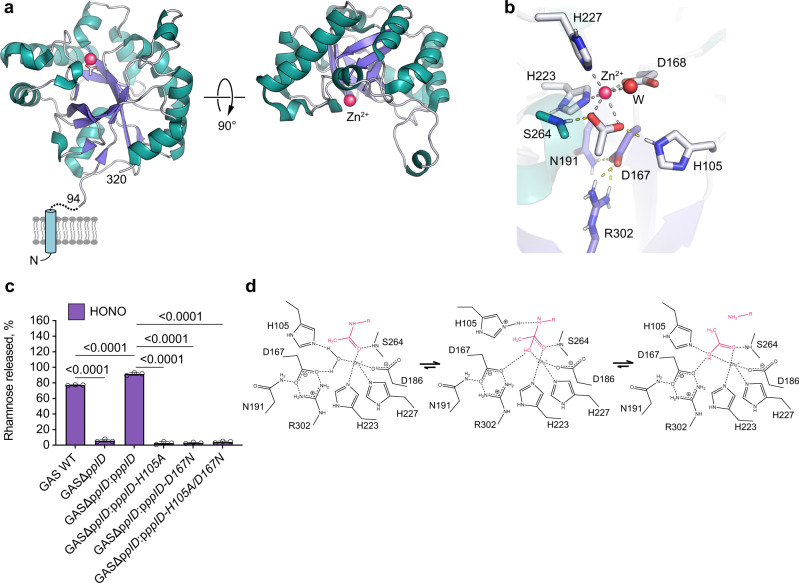
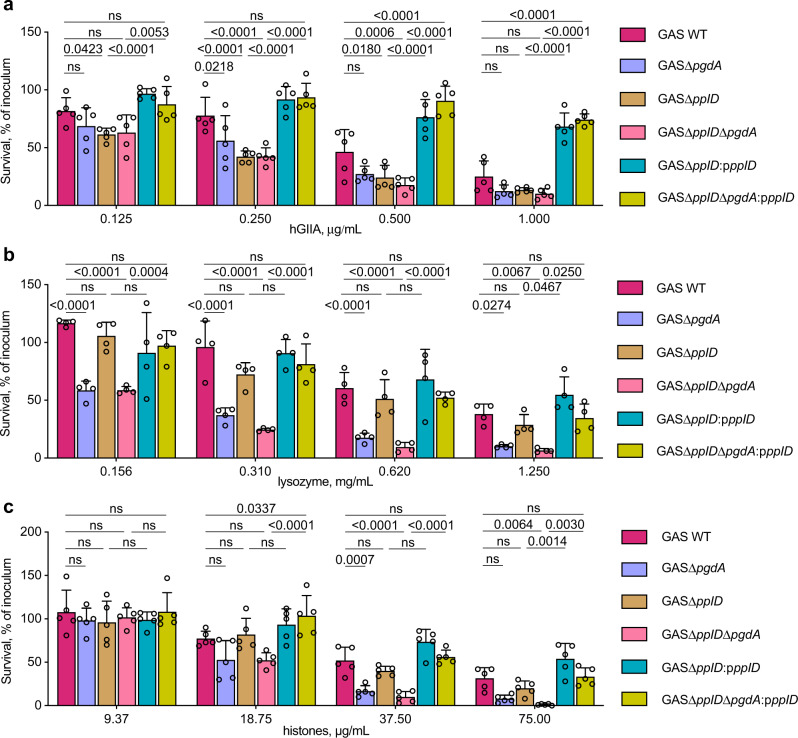
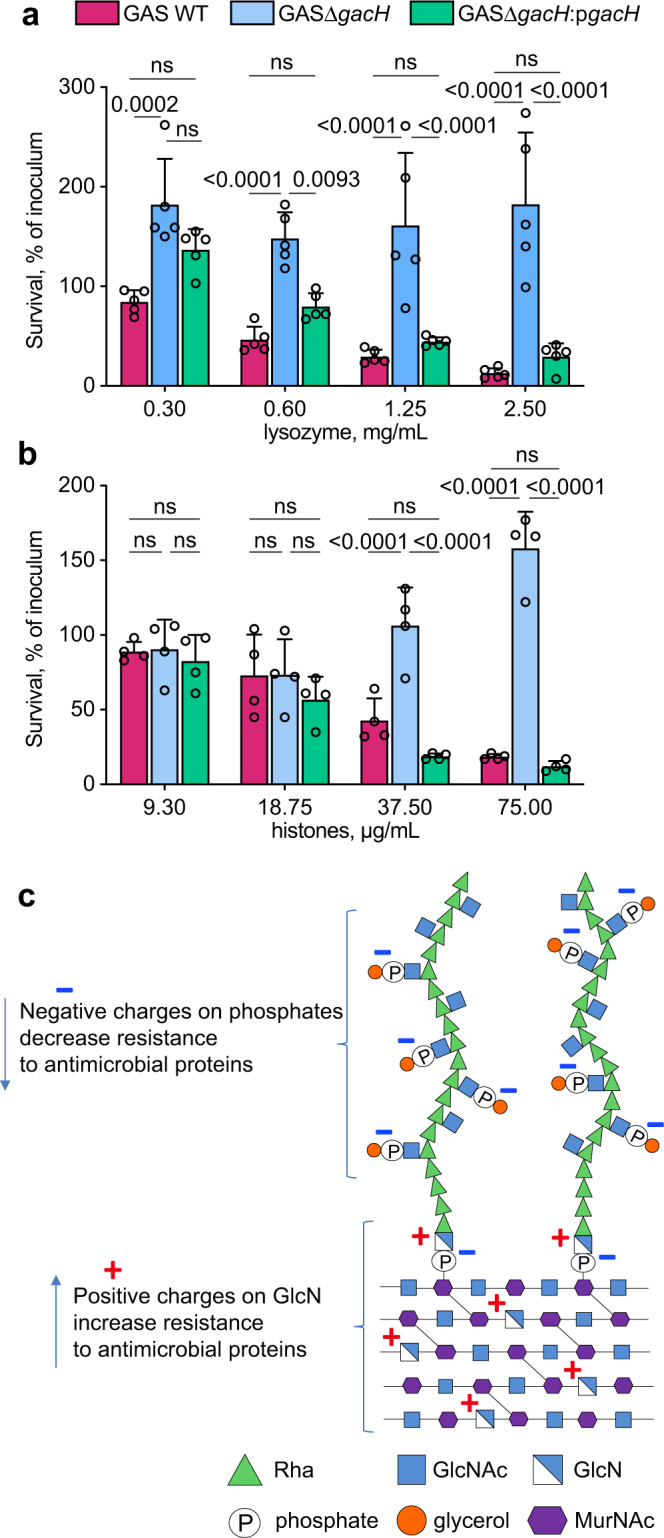
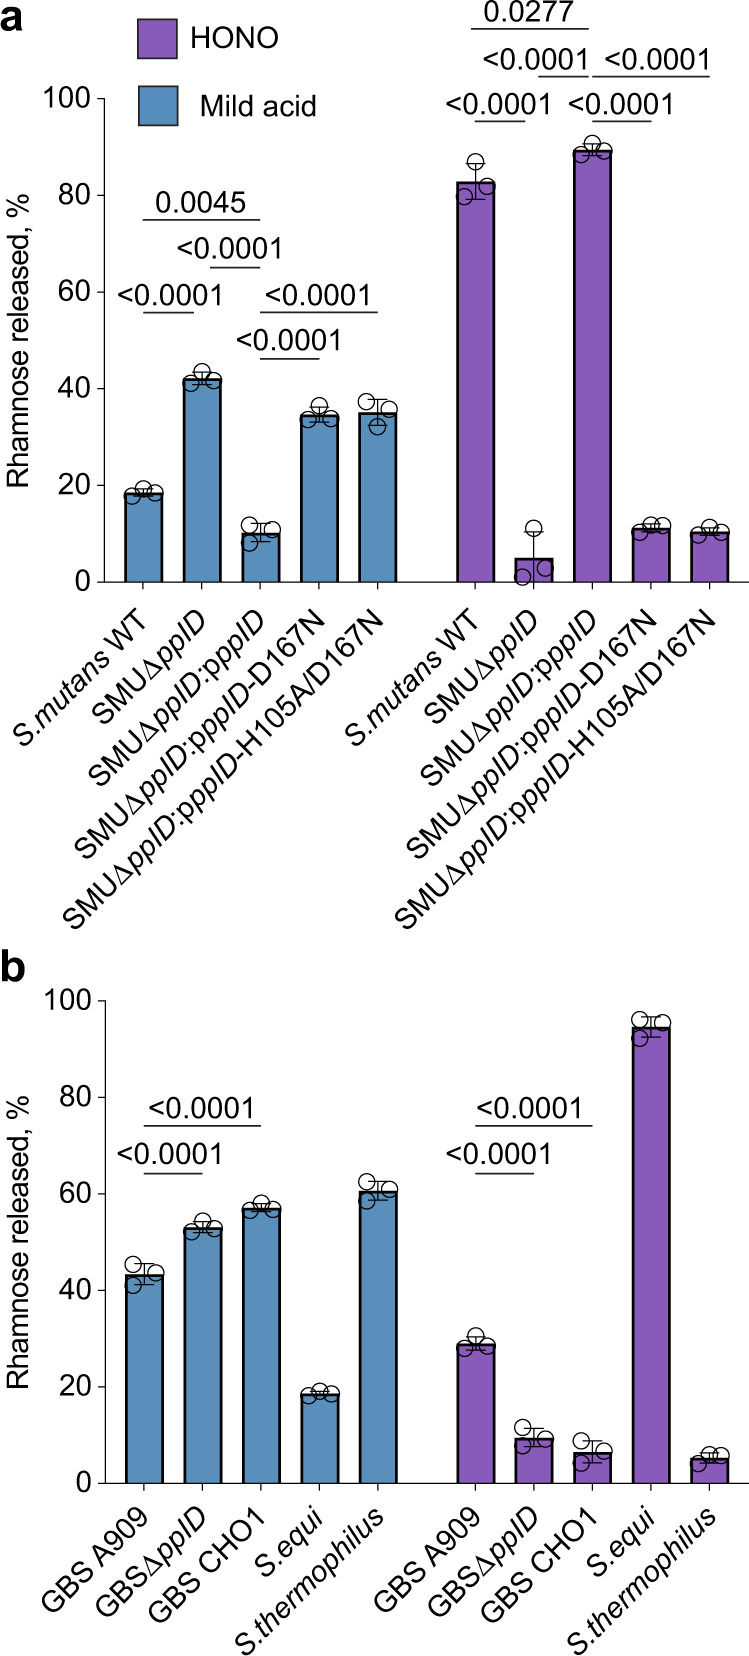
The cell wall of the human bacterial pathogen Group A Streptococcus (GAS) consists of peptidoglycan decorated with the Lancefield group A carbohydrate (GAC). GAC is a promising target for the development of GAS vaccines. In this study, employing chemical, compositional, and NMR methods, we show that GAC is attached to peptidoglycan via glucosamine 1-phosphate. This structural feature makes the GAC-peptidoglycan linkage highly sensitive to cleavage by nitrous acid and resistant to mild acid conditions. Using this characteristic of the GAS cell wall, we identify PplD as a protein required for deacetylation of linkage N-acetylglucosamine (GlcNAc). X-ray structural analysis indicates that PplD performs catalysis via a modified acid/base mechanism. Genetic surveys in silico together with functional analysis indicate that PplD homologs deacetylate the polysaccharide linkage in many streptococcal species. We further demonstrate that introduction of positive charges to the cell wall by GlcNAc deacetylation protects GAS against host cationic antimicrobial proteins.


Conflict of interest statement

The authors declare no competing interests.

Figures

Fig. 1
Fig. 1. Analysis of GAC released from the GAS cell wall by chemical treatments.
a Molecular model illustrating GAC covalently attached to peptidoglycan via a phosphodiester bond. GAC contains a → 3)α-Rha(1 → 2)α-Rha(1 → repeating backbone. The β-GlcNAc side-chains are linked to the 3 position of the α-1,2-linked Rha,. Phosphate groups in GAC are involved in the phosphodiester bond linking glycerol to the GlcNAc side-chain and the GAC reducing terminal sugar residue to peptidoglycan. b Release of GAC from GAS cell wall by mild acid hydrolysis or HONO deamination, before and after chemical N-acetylation. The treatment conditions are indicated by gray rectangles below the bar graph. c Release of GAC from GAS sacculi by mild acid hydrolysis, before (left) and after (right) chemical N-acetylation. d Release of GAC from GAS sacculi by HONO deamination, before (left) and after (right) chemical N-acetylation. In bd the concentration of GAC released from the sacculi was estimated by the modified anthrone assay described in “Methods” and normalized to total GAC content in sacculi. Symbols and error bars represent the mean and S.D., respectively (n = 3 biologically independent replicates). Data are mean values ± S.D., n = 3 biologically independent experiments. In b P values were calculated by one-way ANOVA with Tukey’s multiple comparisons test. In c, d P values were calculated by two-way ANOVA with Tukey’s multiple comparisons test. Source data for bd are provided as a Source data file.
Fig. 2
Fig. 2. Glycosyl composition analysis of GAC released from cell wall by the chemical treatments and purified by size-exclusion and ion-exchange chromatography.
a Size-exclusion chromatography of GAC released from GAS cell wall by mild acid hydrolysis or b deamination with HONO. Upper and lower panels show the composition of the BioGel P150 fractions of the individual GAC preparations. Prior to the chromatography, the extracted GAC material was reduced chemically with sodium borohydride. Fractions were analyzed for phosphate content by malachite green assay following digestion with perchloric acid. Rha and GlcNAc contents were measured by GC-MS as TMS-methyl-glycosides. GlcNAcitol and 2,5-anhydromannitol contents were estimated by GC-MS as alditol acetates. The chromatographic profiles are representative of more than three separate experiments. c Ion-exchange chromatography of GAC released from the GAS cell wall by mild acid (upper panel) and HONO (lower panel). Fractions containing the GAC material from (a, b) were pooled, concentrated, desalted by spin column, loaded onto DEAE-Toyopearl and eluted with a NaCl gradient (0–0.5 M). Fractions were analyzed for total sugar content by anthrone assay and total phosphate content by malachite green assay following perchloric acid digestion. The experiments were performed at least three times and yielded the same results. Data from one representative experiment are shown. d Glycosyl composition analysis of the GAC material purified by ion-exchange chromatography. The GAC material released by either deamination with HONO (GACNA) or mild acid hydrolysis (GACMA) was analyzed as shown in (c). Fractions unbound (flow-through) and bound (eluted with a NaCl gradient) to the DEAE column were pooled, concentrated, desalted by spin column and analyzed by GC-MS to determine the Rha, GlcNAc, 2,5-anhydromannitol and GlcNAcitol concentrations as described above. Malachite green assay was used to assay the phosphate concentration. The concentrations of GlcNAc, 2,5-anhydromannitol, GlcNAcitol and phosphate are expressed as moles per 30 moles of Rha. Columns and error bars represent the mean and S.D., respectively (n = 4 biologically independent replicates). Source data are provided as a Source data file.
Fig. 3
Fig. 3. Chemical structure of the GAC-peptidoglycan linkage region determined by NMR analysis.
Representative structure of the linkage region of GAC anchored to the peptidoglycan layer (top). 1H,31P-HMBC NMR spectrum (a) with a 90 ms delay for the evolution of long-range J couplings shows the key correlation between proton H1 (b) and H2 (d) of GlcN, and the two protons in position 6 of MurNAc (c) to a unique 31P signal at −1.35 ppm, characteristic of a phosphodiester linkage between the two residues. bd Show the corresponding signals in the multiplicity-edited 1H,13C-HSQC NMR spectrum. The two H6 signals of MurNAc were observed in opposite phase due to the multiplicity selection.
Fig. 4
Fig. 4. Binding of GFP-AtlAEfs to GAS sacculi.
Intact sacculi (untreated), sacculi subjected to mild acid hydrolysis (mild acid), or deamination with HONO (HONO) were incubated with GFP-AtlAEfs, and examined by fluorescence microscopy (GFP-AtlAEfs, top panels) and differential interference contrast (DIC, middle panels). An overlay of fluorescence and DIC (merge) is shown in the bottom panels. The experiments were performed independently three times and yielded the same results. Representative image from one experiment is shown. Scale bar is 1 µm.
Fig. 5
Fig. 5. PplD deacetylates GlcNAc in the GAC-peptidoglycan linkage region.
a Predicted topology of PplD showing a transmembrane helix and structure of extracellular domain with the enzymatic active site is depicted on left panel. Right panel depicts the structure of ePplD viewing at the active site with the Zn2+ ion shown as a magenta sphere. b A close-up view of the active site PplD structure in complex with acetate. c The sacculi purified from GAS WT, GASΔpplD, GASΔpplD:ppplD, GASΔpplD:ppplD-H105A, GASΔpplD:ppplD-D167N, and GASΔpplD:ppplD-H105A/D167N were subjected to deamination with HONO. The concentration of GAC released from the sacculi was estimated by the modified anthrone assay and normalized to total GAC content in the analyzed materials. Symbols and error bars represent the mean and S.D., respectively (n = 3 biologically independent replicates). P values were calculated by one-way ANOVA with Tukey’s multiple comparisons test. Source data for (c) are provided as a Source data file. d Proposed catalytic mechanism for PplD-mediated deacetylation of the GAC-peptidoglycan linkage region.
Fig. 6
Fig. 6. N-deacetylases PplD and PgdA contribute to protection of GAS against AMPs.
ac Analysis of resistance of GAC mutants deficient in N-deacetylation of GlcNAc mediated by PplD and PgdA to a hGIIA, b lysozyme, and c histone mixture. Data are mean values ± S.D., n = 5 biologically independent experiments in (a, c), n = 4 biologically independent experiments in (b). P values were calculated by two-way ANOVA with Bonferroni’s multiple comparison test. Source data are provided as a Source data file.
Fig. 7
Fig. 7. The role of the GroP modification in GAS protection against histones and lysozyme.
a, b Analysis of resistance of GAC mutants deficient in the GroP modification to a lysozyme, and b histone mixture. Data are mean values ± S.D., n = 5 biologically independent experiments in (a), n = 4 biologically independent experiments in (b). P values were calculated by two-way ANOVA with Bonferroni’s multiple comparison test. Source data for (a, b) are provided as a Source data file. c Introduction of charges to the GAS cell wall by GlcNAc deacetylation and GroP modification modulates resistance to host cationic antimicrobial proteins.
Fig. 8
Fig. 8. Analysis of PplD-mediated deacetylation in streptococcal species.
a Release of SCC from the sacculi purified from S. mutans strains by mild acid hydrolysis (left) or deamination with HONO (right). b Release of the Rha-containing polysaccharides from the cell wall purified from GBS, S. equi and S. thermophilus strains by mild acid hydrolysis (left) or deamination with HONO (right). The concentration of polysaccharide released from the sacculi or cell wall was estimated by the modified anthrone assay and normalized to total content of polysaccharide in the starting material. Symbols and error bars represent the mean and S.D., respectively (n = 3 biologically independent replicates). P values were calculated by two-way ANOVA with Tukey’s multiple comparisons test. Source data are provided as a Source data file.

References

    1. Mistou MY, Sutcliffe IC, van Sorge NM. Bacterial glycobiology: rhamnose-containing cell wall polysaccharides in Gram-positive bacteria. FEMS Microbiol. Rev. 2016;40:464–479. - PMC - PubMed
    1. Brown S, Santa Maria JP, Jr., Walker S. Wall teichoic acids of Gram-positive bacteria. Annu Rev. Microbiol. 2013;67:313–336. - PMC - PubMed
    1. Denapaite D, Bruckner R, Hakenbeck R, Vollmer W. Biosynthesis of teichoic acids in Streptococcus pneumoniae and closely related species: lessons from genomes. Microb. Drug Resist. 2012;18:344–358. - PubMed
    1. Dale, J. B. et al. in Streptococcus pyogenes: Basic Biology to Clinical Manifestations (eds Ferretti, J. J., Stevens, D. L. & Fischetti, V. A.) (2016). - PubMed
    1. Huang DH, Rama Krishna N, Pritchard DG. Characterization of the group A streptococcal polysaccharide by two-dimensional 1H-nuclear-magnetic-resonance spectroscopy. Carbohydr. Res. 1986;155:193–199. - PubMed

Publication types