Observational Study
. 2022 Feb 1;13(1):448.
doi: 10.1038/s41467-021-26615-y.

The DNA methylome of cervical cells can predict the presence of ovarian cancer

Affiliations
Observational Study

The DNA methylome of cervical cells can predict the presence of ovarian cancer

James E Barrett et al. Nat Commun. .

Abstract

The vast majority of epithelial ovarian cancer arises from tissues that are embryologically derived from the Müllerian Duct. Here, we demonstrate that a DNA methylation signature in easy-to-access Müllerian Duct-derived cervical cells from women with and without ovarian cancer (i.e. referred to as the Women's risk IDentification for Ovarian Cancer index or WID-OC-index) is capable of identifying women with an ovarian cancer in the absence of tumour DNA with an AUC of 0.76 and women with an endometrial cancer with an AUC of 0.81. This and the observation that the cervical cell WID-OC-index mimics the epigenetic program of those cells at risk of becoming cancerous in BRCA1/2 germline mutation carriers (i.e. mammary epithelium, fallopian tube fimbriae, prostate) further suggest that the epigenetic misprogramming of cervical cells is an indicator for cancer predisposition. This concept has the potential to advance the field of risk-stratified cancer screening and prevention.


Conflict of interest statement

R.M. received an honorarium for grant review from the Israel National Institute for Health Policy Research and from MSD, Astra Zeneca, and GSK for advisory board meetings. UCLB (UCL’s commercialisation company) has filed a patent on some aspects described in the paper—M.W. and J.E.B. are named as inventors on this patent. J.E.B., C.H., and M.W. are shareholders of Sola Diagnostics GmbH, which holds an exclusive licence to the intellectual property that protects the commercialisation of the WID-OC test. All other authors declare no competing interests.

Figures

Fig. 1
Fig. 1. Sample heterogeneity, differential methylation, and development of discriminatory index.
a Distribution of p-values obtained by comparing cases and controls at each CpG site and after controlling for immune cell proportion and age. b The distribution of different cell types in the discovery dataset inferred using the EpiDISH algorithm. p-values were computed using a two-tailed Mann–Whitney test. For indicated significant differences, exact p-values = 0.00014 (epithelial), <0.0001 (neutrophil), <0.0001 (fibroblast), <0.0001 (eosinophil). The centre line of each box corresponds to the median. The lower and upper hinges correspond to the first and third quartiles. The upper whisker extends from the hinge to the largest value no further than 1.5 * IQR from the hinge (where IQR is the inter-quartile range, or distance between the first and third quartiles). The lower whisker extends from the hinge to the smallest value at most 1.5 * IQR of the hinge. Data beyond the end of the whiskers are plotted individually. c An example of a CpG with epithelial specific differential methylation. d Area under the curve (AUC) values in the internal validation set as a function of the number of CpGs used to train the classifier. e ROC curves of the WID-OC-index in the internal validation set for samples with an immune cell (IC) proportion ≤0.5 and >0.5. f Distribution of the WID-OC-index with respect to immune cell proportion in the internal validation set. g Distribution of the estimated variance in epithelial and immune cells across all CpGs used in the WID-OC- index. h Odds ratios corresponding to the four genomic regions when comparing the CpGs used in the WID-OC-index to the overall EPIC array. Error bars correspond to 95% confidence intervals computed using the median-unbiased estimation method. For indicated significant differences, all exact p values <0.0001. i AUC values in the internal validation set after training classifiers on different subsets of the CpGs used in the WID-OC-index. The top n CpGs were either retained or removed. CpGs were also split into separate bins of size 500. Source data are provided as a Source Data file.
Fig. 2
Fig. 2. External validation.
a The WID-OC-index versus immune cell proportion in an independent external validation set. b ROC curve from the external validation set. c The WID-OC-index versus immune cell proportion in a separate cohort of endometrial cancer samples and the same control samples from the internal validation set. d ROC curve from the endometrial cancer dataset. e The WID- OC-index versus immune cell proportion in a separate cohort of breast cancer samples and the same control samples from the internal validation set. f ROC curve from the breast cancer dataset. g The WID-OC-index versus immune cell proportion in an independent cohort of BRCA1 mutation carriers. h ROC curve from the BRCA1 dataset. Source data are provided as a Source Data file.
Fig. 3
Fig. 3. Association with epidemiological, clinical, and technical factors.
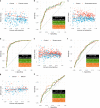
a The WID-OC-index versus age in control samples from the internal and external validation datasets. b ROC curves for women above and below 50 years of age. c The WID-OC-index versus a 28 SNP ovarian cancer polygenic risk score (PRS) in the internal validation dataset. d ROC curve corresponding to the PRS score. e The distribution of the WID-OC-index across different histological subtypes (endometrioid borderline, mucinous-clear cell cancer, carcinosarcoma, and serous cancer with no information on grade have been classified as “other cancers”). p-values were computed using a two-tailed Mann–Whitney test. For indicated significant difference, exact p-value = 0.013. f The distribution of the WID-OC-index across different cancer stages. p-values were computed using a two-tailed Mann–Whitney test. For indicated significant difference, exact p value = 0.0023. For box plots in e and f, the centre line of each box corresponds to the median. The lower and upper hinges correspond to the first and third quartiles. The upper whisker extends from the hinge to the largest value no further than 1.5 * IQR from the hinge (where IQR is the inter-quartile range). The lower whisker extends to the smallest value at most 1.5 * IQR of the hinge. Data beyond the end of the whiskers are plotted individually. Source data are provided as a Source Data file.
Fig. 4
Fig. 4. Inferred proportion of tumour DNA and functional assessment of the WID-OC-index.
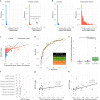
The estimated proportion of tumour DNA in each cervical smear sample as estimated using the EpiDISH algorithm for controls and a ovarian cancers and b endometrial cancers. c Distribution of the WID-OC-index with respect to tumour DNA fraction in controls and endometrial cancers. d ROC curve for samples with tumour DNA < 1% in the endometrial cancer set. e Results from real-time PCR to detect ZNF154, a pan-cancer marker primarily discovered in ovarian cancer. p-values were computed using a two-tailed Mann–Whitney test. For indicated significant differences, all exact p values < 0.001. The centre line of each box corresponds to the median. The lower and upper hinges correspond to the first and third quartiles. The upper whisker extends from the hinge to the largest value no further than 1.5 * IQR from the hinge (where IQR is the inter-quartile range). The lower whisker extends to the smallest value at most 1.5 * IQR of the hinge. Data beyond the end of the whiskers are plotted individually. f The WID-OC-index evaluated in eight different cell lines. g, h shows a subset of ENCODE tissue samples. The germline mutation proportion refers to the proportion of cancers in each tissue type that have a BRCA1 and BRCA2 mutation. p-values were computed using a two-tailed correlation test. Source data are provided as a Source Data file.

References

    1. Jayson GC, Kohn EC, Kitchener HC, Ledermann JA. Ovarian cancer. Lancet. 2014;384:1376–1388. doi: 10.1016/S0140-6736(13)62146-7. - DOI - PubMed
    1. Clyde MA, et al. Risk prediction for epithelial ovarian cancer in 11 United States-based case-control studies: incorporation of epidemiologic risk factors and 17 confirmed genetic loci. Am. J. Epidemiol. 2016;184:579–589. doi: 10.1093/aje/kww091. - DOI - PMC - PubMed
    1. Yang X, et al. Evaluation of polygenic risk scores for ovarian cancer risk prediction in a prospective cohort study. J. Med. Genet. 2018;55:546–554. doi: 10.1136/jmedgenet-2018-105313. - DOI - PMC - PubMed
    1. Pearce CL, et al. Population distribution of lifetime risk of ovarian cancer in the United States. Cancer Epidemiol. Biomark. Prev. 2015;24:671–676. doi: 10.1158/1055-9965.EPI-14-1128. - DOI - PMC - PubMed
    1. Jervis S, et al. A risk prediction algorithm for ovarian cancer incorporating BRCA1, BRCA2, common alleles and other familial effects. J. Med. Genet. 2015;52:465–475. doi: 10.1136/jmedgenet-2015-103077. - DOI - PMC - PubMed

Publication types