. 2022 Feb 1;13(1):601.
doi: 10.1038/s41467-022-28287-8.

SARS-CoV-2 genomes from Saudi Arabia implicate nucleocapsid mutations in host response and increased viral load

Affiliations

SARS-CoV-2 genomes from Saudi Arabia implicate nucleocapsid mutations in host response and increased viral load

Tobias Mourier et al. Nat Commun. .

Abstract

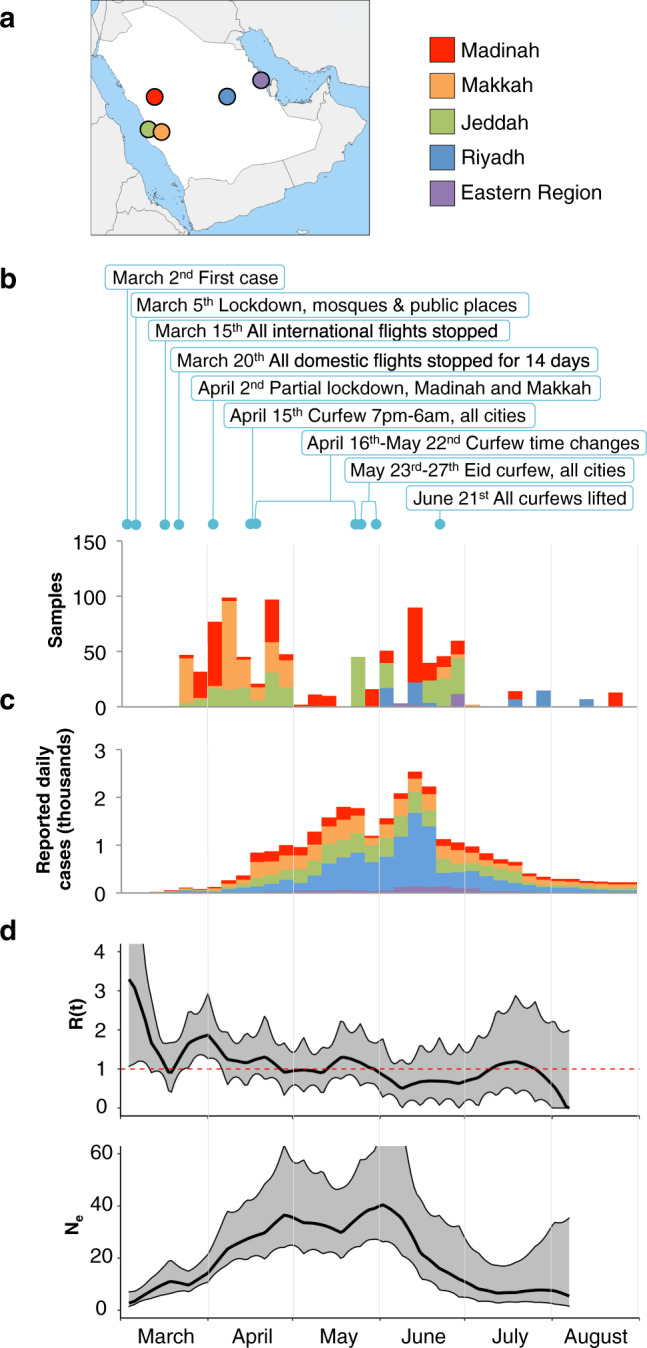
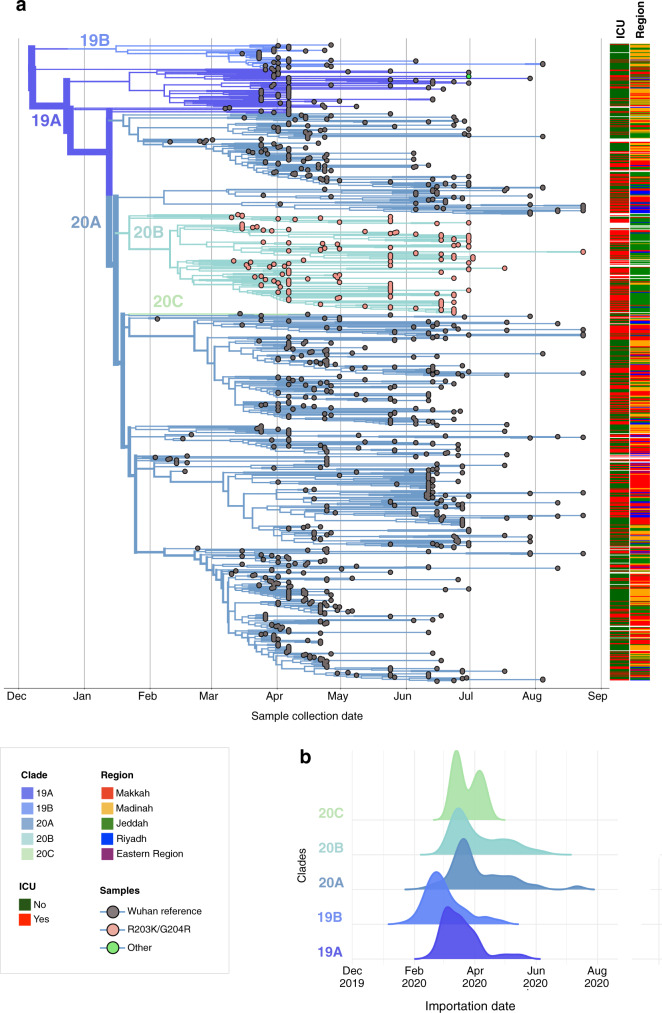
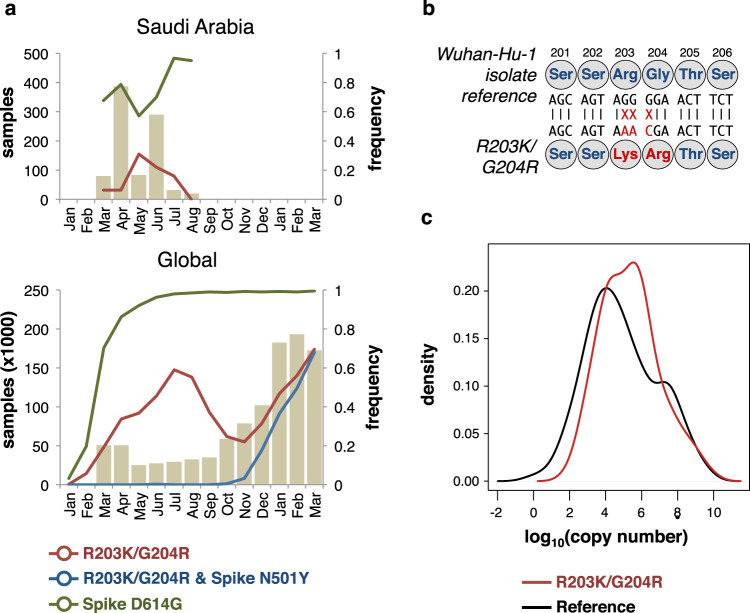
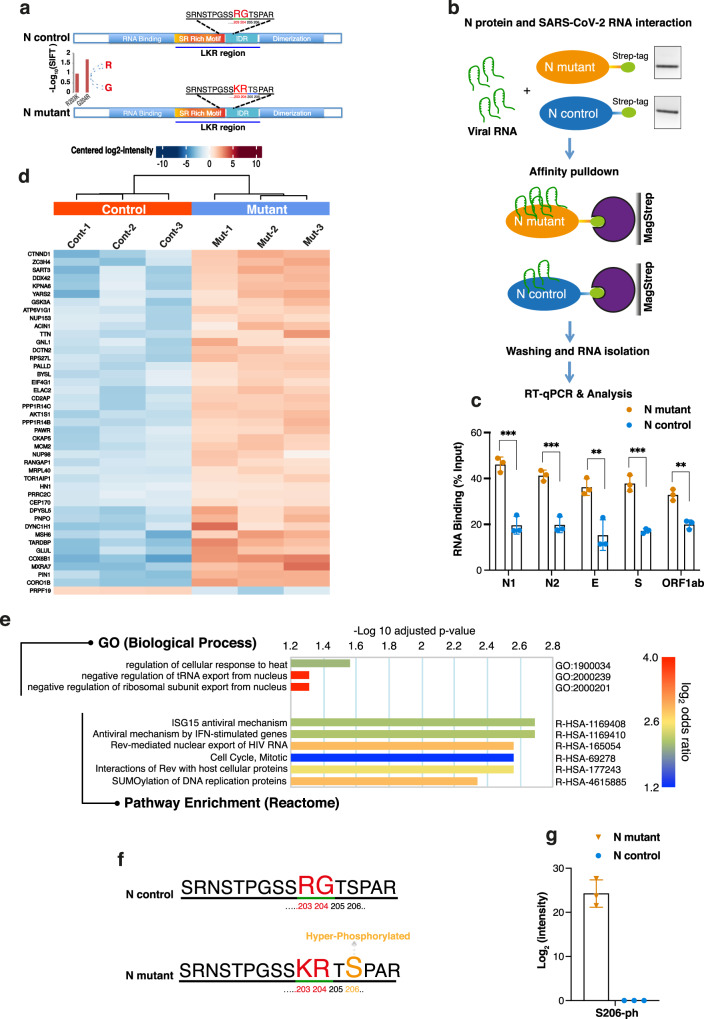
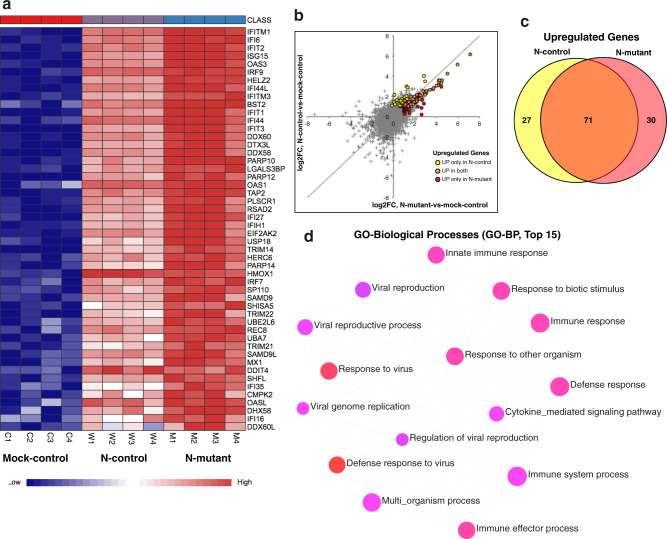
Monitoring SARS-CoV-2 spread and evolution through genome sequencing is essential in handling the COVID-19 pandemic. Here, we sequenced 892 SARS-CoV-2 genomes collected from patients in Saudi Arabia from March to August 2020. We show that two consecutive mutations (R203K/G204R) in the nucleocapsid (N) protein are associated with higher viral loads in COVID-19 patients. Our comparative biochemical analysis reveals that the mutant N protein displays enhanced viral RNA binding and differential interaction with key host proteins. We found increased interaction of GSK3A kinase simultaneously with hyper-phosphorylation of the adjacent serine site (S206) in the mutant N protein. Furthermore, the host cell transcriptome analysis suggests that the mutant N protein produces dysregulated interferon response genes. Here, we provide crucial information in linking the R203K/G204R mutations in the N protein to modulations of host-virus interactions and underline the potential of the nucleocapsid protein as a drug target during infection.


Conflict of interest statement

The authors declare no competing interests.

Figures

Fig. 1
Fig. 1. Sample overview and population genetics.
a Locations of the sampling cities within Saudi Arabia. b Stacked bars showing the numbers of samples retrieved from the 4 cities and the Eastern region during the first six months of the pandemic. Cities are colored as in panel a. Months are shown at the bottom of the figure, and each month is divided into 5-day intervals. New daily cases for the city of Khobar are shown on the Eastern Region plot. Major restrictions imposed by the Ministry of Health and by Royal decrees are indicated above plots. c Stacked bars showing the average numbers of new daily cases in sampling cities (Supplementary Note 1). d Estimate of effective reproduction number [Rt] over time in Saudi Arabia (top) and the estimate of effective population size [Ne], the relative population size required to produce the diversity seen in the sample (bottom). Central black lines show median estimates, and gray confidence areas denote the 95% credible intervals. The red horizontal red line represents an R of 1, the level required to sustain epidemic growth.
Fig. 2
Fig. 2. Phylodynamics of SARS-CoV-2 samples in Saudi Arabia.
a Global Time-scaled phylogeny of 952 Saudi samples colored by Nextstrain clades. Samples are shown as circles and colored according to their genotype at genome positions 28,881–28,883. Intensive Care Unit (ICU) status, patient outcome, and sampling region are indicated on the right of the tree. b Distributions of importation dates for the five Nextstrain (nextstrain.org) clades found in Saudi Arabia colored by clade.
Fig. 3
Fig. 3. Higher viral loads in samples with R203K/G204R SNPs.
a Top: The numbers of samples from Saudi Arabia presented in this study are shown as bars by their sampling date (January 2020–March 2021). Bottom: Samples deposited in GISAID. On both plots, lines show the fraction of samples having the R203K/G204R SNPs (red line), having both the R203K/G204R SNPs and the Spike protein N501Y SNP (blue line), and having the Spike protein D614G SNP (green line). b Overview of the three SNPs underlying the N protein R203K/G204R changes. Amino acid numbers in the N protein are shown above. c Density distributions of virus copy numbers derived from Ct measurements. Ct values from the N1 primer pairs were normalized by RNase P primer pair values and converted to copy numbers from a standard curve. Only samples processed using the TaqPath™ kit (Thermofisher) were included (see Methods).
Fig. 4
Fig. 4. RNA-binding and Affinity Purification Mass-Spectrometry (AP-MS) analysis of mutant and control SARS-CoV-2 N protein.
a A schematic diagram showing the SARS-CoV-2 N protein different domains (Upper: control, Lower: mutant) and highlighting the mutation site (R203K and G204R) and the linker region (LKR) containing a serine-arginine rich motif (SR-motif). The bar-plot (lower panel) indicates the SIFT predicted deleteriousness score of substitution at position 203 and 204 from R to K and G to R respectively. b Sketch of In vitro RNA immunoprecipitation (RIP) procedure used for analysis of viral RNA interaction with mutant and control N protein (See methods for details). Isolated RNAs were analyzed by RT-qPCR using specific viral N gene (N1 and N2), E gene, S gene, and ORF1ab region. c Bar chart shows level of viral RNA retrieval (% input) with mutant and control N protein (± SD from n = 3 independent experiments, [two-sided t-test, p-values N1:0.00080 (***), N2:0.00088 (***), E:0.008 (**), S:0.00059 (***), and ORF1ab:0.002 (**)]). d Identification of host-interacting partners of mutant and control SARS-CoV-2 N protein by Affinity Mass-Spectrometry. Heatmap showing significantly differentially changed human proteins (3 replicates) interactome in mutant versus control N protein AP-MS analysis. e Gene Ontology (GO)-enrichment analysis of significantly changed terms between mutant and control proteins in terms of biological process and pathway enrichment. The scale shows p-value adjusted Log2 of odds ratio mutant versus control. f Profiling of phosphorylation status of mutant and control N protein by Mass-Spectrometry. Sketch showing part of SR-rich motif of SARS-CoV-2 N protein containing the KR mutation site (R203K and G204R) (Lower). The hyper-phosphorylated serine 206 (as shown in (g)) in the mutant N protein near the KR mutation site is indicated in orange color. g Phosphorylation status of mutant and control N protein was analyzed by mass spectrometry (±SD from n = 3 biologically independent experiments per affinity condition). Bar-plot shows the Log2 intensities of phosphorylated peptide (Serine 206) in control and mutant condition (see Supplementary Data 4).
Fig. 5
Fig. 5. Transcriptional profiling of mutant and control N transfected cells.
Calu-3 cells were transfected with plasmids expressing the full-length N-control and N-mutant protein along with mock control (4 biological replicates per condition). 48-h post-transfection total RNA was isolated and subjected to RNA-sequencing using illumina NovaSeq 6000 platform. a Heatmap shows normalized expression of top significantly differentially expressed genes in N-mutant and N-control conditions (adj p-value <0.05 and log2 fold-change cutoff ≥1). Genes enriched in interferon and immune-related processes are overexpressed in the N-mutant transfected cells. The heatmap was generated by the visualization module in the NetworkAnalyst. b Plot showing comparison of fold-changes for all DE genes in N-mutant and N-control conditions. Differentially expressed genes display higher up-regulation in the N-mutant condition (as orange dots that represent common up-regulated genes are skewed towards the lower half of the diagonal). c Venn diagram shows the common and unique up-regulated genes in both conditions. d GO-enrichment analysis (top 15 pathways based on p-value and FDR are shown) of up-regulated genes. The enriched GO BP (Biological Processes) term is related to defense and interferon response. The enriched terms display an interconnected network with overlapping gene sets (from the list). Each node represents an enriched term and colored by its p-value from red to blue in ascending order (red shows the smallest p-value) as shown in Supplementary Data 6. The size of each node corresponds to number of linked genes from the list.

References

    1. Organization, W. H. Coronavirus Disease (COVID-19) Weekly Epidemiological Update and Weekly Operational Updatewww.who.int/emergencies/diseases/novel-coronavirus-2019/situation-reports (2020).
    1. Dong E, Du H, Gardner L. An interactive web-based dashboard to track COVID-19 in real time. Lancet Infect. Dis. 2020;20:533–534. - PMC - PubMed
    1. Center, J. H. U. M. C. R. COVID-19 Dashboardhttps://coronavirus.jhu.edu/map.html (2020).
    1. Ebrahim SH, Memish ZA. COVID-19: preparing for superspreader potential among Umrah pilgrims to Saudi Arabia. Lancet. 2020;395:e48. - PMC - PubMed
    1. Memish, Z. A., Aljerian, N. & Ebrahim, S. H. Tale of three seeding patterns of SARS-CoV-2 in Saudi Arabia. Lancet Infect. Dis.10.1016/S1473-3099(20)30425-4 (2020). - PMC - PubMed

Publication types

MeSH terms

Substances