. 2022 May;32(5):477-490.
doi: 10.1038/s41422-022-00614-0. Epub 2022 Feb 1.

Comprehensive metabolomics expands precision medicine for triple-negative breast cancer

Affiliations

Comprehensive metabolomics expands precision medicine for triple-negative breast cancer

Yi Xiao et al. Cell Res. 2022 May.

Abstract

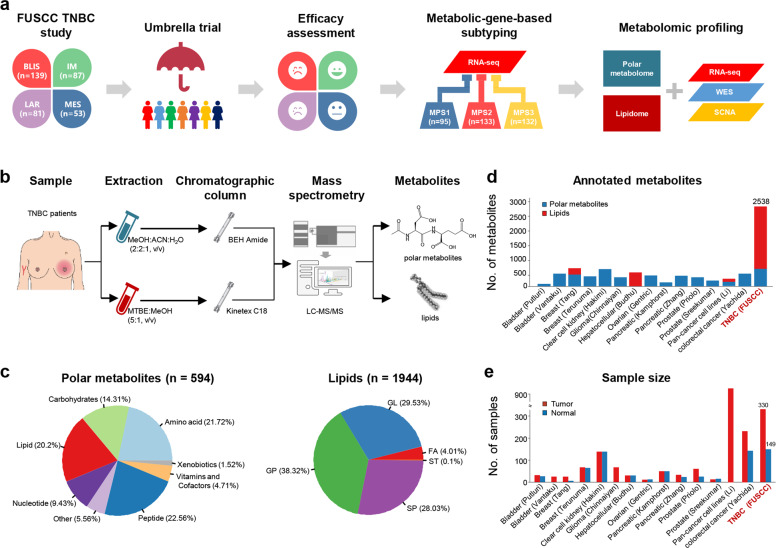
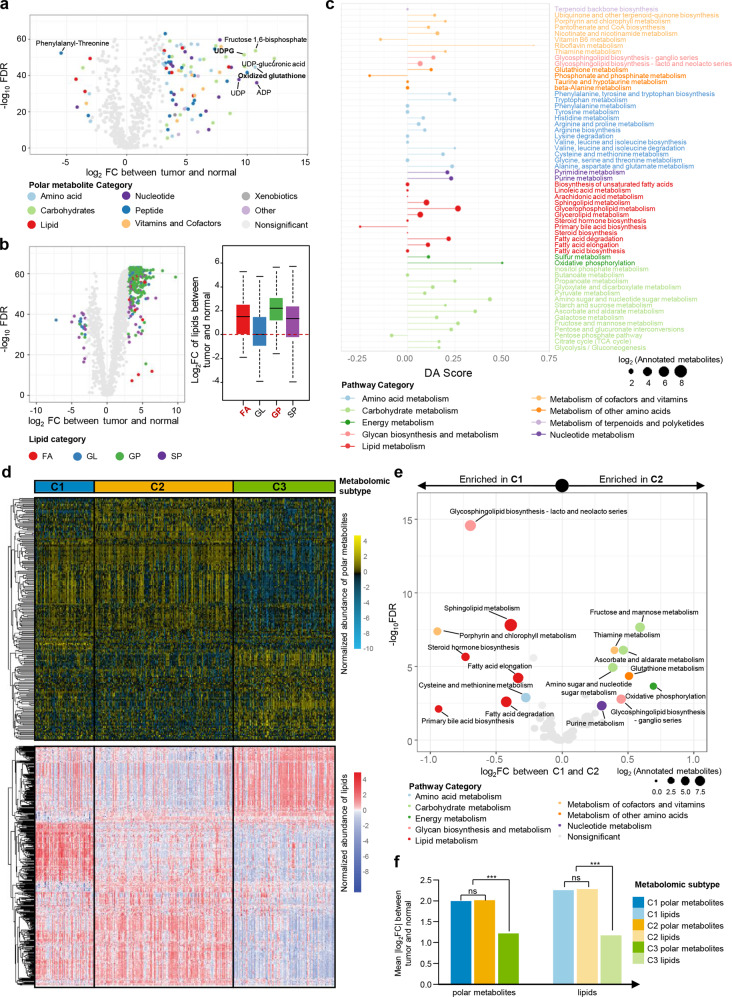
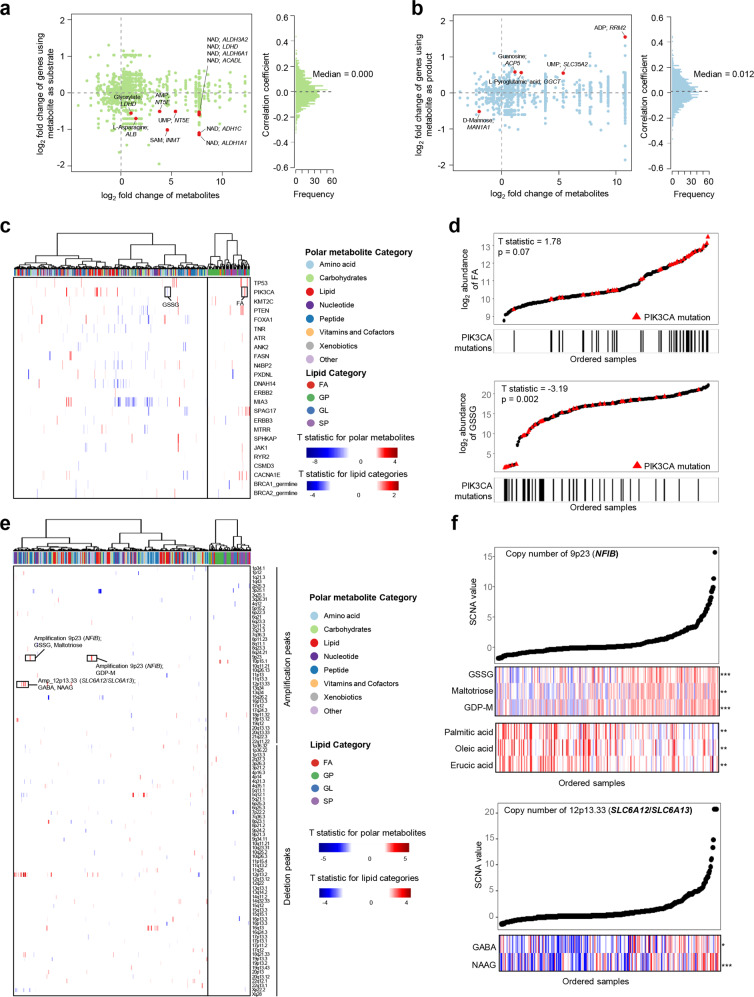
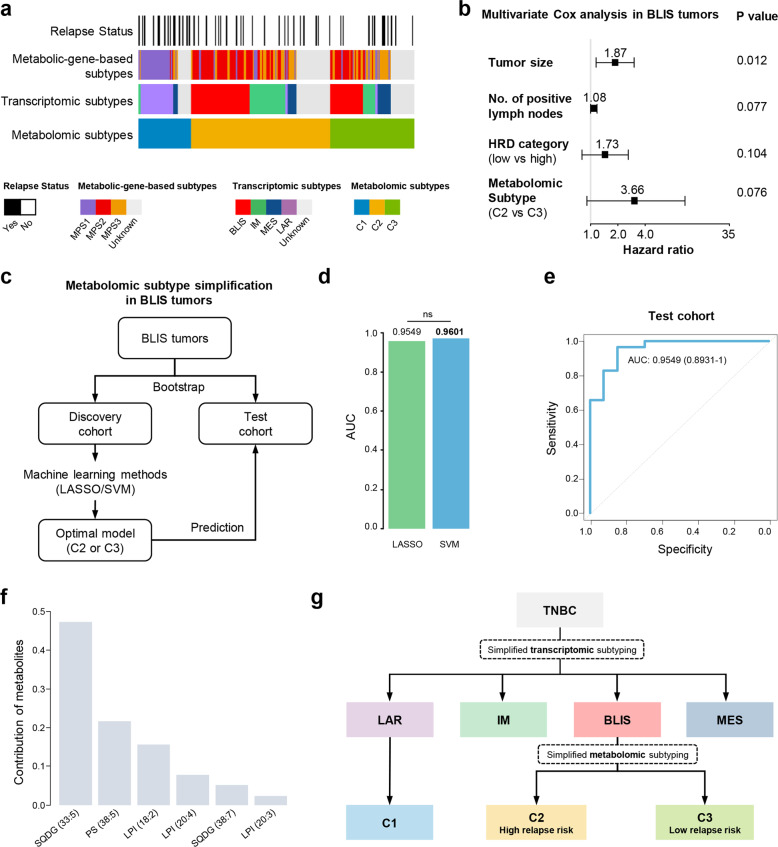
Metabolic reprogramming is a hallmark of cancer. However, systematic characterizations of metabolites in triple-negative breast cancer (TNBC) are still lacking. Our study profiled the polar metabolome and lipidome in 330 TNBC samples and 149 paired normal breast tissues to construct a large metabolomic atlas of TNBC. Combining with previously established transcriptomic and genomic data of the same cohort, we conducted a comprehensive analysis linking TNBC metabolome to genomics. Our study classified TNBCs into three distinct metabolomic subgroups: C1, characterized by the enrichment of ceramides and fatty acids; C2, featured with the upregulation of metabolites related to oxidation reaction and glycosyl transfer; and C3, having the lowest level of metabolic dysregulation. Based on this newly developed metabolomic dataset, we refined previous TNBC transcriptomic subtypes and identified some crucial subtype-specific metabolites as potential therapeutic targets. The transcriptomic luminal androgen receptor (LAR) subtype overlapped with metabolomic C1 subtype. Experiments on patient-derived organoid and xenograft models indicate that targeting sphingosine-1-phosphate (S1P), an intermediate of the ceramide pathway, is a promising therapy for LAR tumors. Moreover, the transcriptomic basal-like immune-suppressed (BLIS) subtype contained two prognostic metabolomic subgroups (C2 and C3), which could be distinguished through machine-learning methods. We show that N-acetyl-aspartyl-glutamate is a crucial tumor-promoting metabolite and potential therapeutic target for high-risk BLIS tumors. Together, our study reveals the clinical significance of TNBC metabolomics, which can not only optimize the transcriptomic subtyping system, but also suggest novel therapeutic targets. This metabolomic dataset can serve as a useful public resource to promote precision treatment of TNBC.

Trial registration: ClinicalTrials.gov NCT03805399.


Conflict of interest statement

The authors declare no competing interests.

Figures

Fig. 1
Fig. 1. Overview of polar metabolome and lipidome detection in TNBC.
a A sketch map showing the combined analysis using previously obtained transcriptomic data and the metabolomics data reported in this study for TNBC precision medicine. b A schematic summarizing the workflow for metabolite profiling. c The numbers and proportions of annotated polar metabolites and lipids in our study. Comparison of the number of annotated metabolites (d) and the number of samples (e) between our study and previous studies. BLIS, basal-like immunesuppressed; IM, immunomodulatory; LAR, luminal androgen receptor; MES, mesenchymal-like; MPS, metabolic-pathway-based subtypes; FA, fatty acids; GL, glycerolipids; GP, glycerophospholipids; SP, sphingolipids; ST, sterol lipids.
Fig. 2
Fig. 2. The metabolomic landscape of triple-negative breast cancer.
a, b volcano plots of the 594 annotated polar metabolites (a) and 1944 lipids (b) profiled. Metabolites of different categories were individually color-coded. Right part of panel b: Log2 fold changes of the abundances of different categories of lipids in TNBC tumor tissues as compared with normal tissues. Log2 fold change value of 0 (the dashed red line) indicates the same level of lipid abundance between the tumor and the normal. c A pathway-based analysis of metabolomic changes between tumor and normal tissues. The DA score captures the average, gross changes for all metabolites in a pathway. A score of 1 indicates that all measured metabolites in the pathway increase in the tumor compared to normal tissues, and a score of −1 indicates that all measured metabolites in a pathway decrease. Pathways with no less than three measured metabolites were used for DA score calculation. d SNF clustering of metabolomic data. e Pathway abundance (PA) scores between C1 and C2 subtypes. The PA score was calculated as the mean log2 fold change of the abundances of measured metabolites in this pathway. f Degree of overall metabolomic dysregulation among three metabolomic subtypes. For each metabolomic subtype, the mean log2 fold change of metabolites between tumor and normal tissues was calculated to represent the overall degree of metabolomic dysregulation.
Fig. 3
Fig. 3. Systematic evaluations linking polar metabolome and lipidome to genomic features.
a, b Correlation of mRNA expression of metabolic genes with the abundances of paired metabolites as substrates (a) or products (b). Metabolite-gene pairs were derived from the Recon 3D dataset. Pairs with significant differences between tumor and normal tissues and significant correlations were annotated in the plot. c Heatmap showing the associations between the abundances of metabolites and the presence of mutations within the indicated genes. The mutations include high frequency somatic mutations (mutated in at least 6% of the cases in at least one metabolomic subtype) within cancer-related genes and high frequency germline mutations in BRCA1 and BRCA2. T statistics were calculated by a linear regression model that adjusted the cofounding factors. d Correlations between PIK3CA mutations and FA subclass (top panel) and GSSG levels (bottom panel). All lipids belonging to the FA subclass (n = 10) were included. The mean abundance of the ten metabolites was regarded as the abundance of FA subclass. All samples were ordered based on the abundance (y-axis) of FA subclass (top panel) or GSSG (bottom panel), and the ones with PIK3CA mutations were highlighted in red and indicated by the corresponding lines displayed in x-axis. e Heatmap showing the associations between abundances of metabolites and copy number values of TNBC SCNA peaks. T statistics were calculated by a linear regression model that adjusted the cofounding factors. f Top panel: correlations between the copy number values of 9p23 and the abundances of GSSG, maltotriose, GDP-M and some FAs. Bottom panel: correlations between the copy number values of 12p13.33 and the abundances of GABA and NAAG. SCNA-related metabolites are shown as lines and samples were ordered by increasing copy number values. The abundances of the metabolite are illustrated in colors. ***P < 0.001, **P < 0.01; *P < 0.05; ns, P ≥ 0.05.
Fig. 4
Fig. 4. Metabolomic subtyping refines the transcriptomic subtyping in BLIS tumors and can be achieved by machine-learning methods.
a Associations of metabolomic subtypes with transcriptomic subtypes, metabolic-gene-based subtypes and relapse status of TNBCs. b Association of tumor size, number of positive lymph nodes, homologous recombination defect (HRD) categories and metabolomic subtypes with relapse-free survival (RFS) in patients with BLIS tumors. Multivariate Cox regression model was used for analysis. The hazard ratios were shown with 95% confidence intervals. Proportion hazard assumption was tested in advance. c Design of the analytical pipeline for metabolomic subtyping via machine-learning methods for patients with BLIS tumors. Bootstrap method was used for the classification of discovery and test cohorts. Two machine-learning methods (LASSO and SVM) were used for model construction. d Comparison of the efficacies of two machine-learning methods for the test cohort. e Efficacy of the LASSO regression model in predicting metabolomic subtypes of BLIS tumors was reflected by ROC curves with AUCs reported. f Contribution of the six metabolites to the LASSO regression model. g The integration of transcriptomic and metabolomic subtyping system for potential clinical utilization. The simplified transcriptomic subtyping through four immunohistochemistry markers was previously developed by our group and widely used in clinical setting in our center. LASSO, the least absolute shrinkage and selectionator operator; SVM, Support Vector Machine; SQDG, sulfoquinovosyl diacylglycerol; LPI, Lysophosphatidylinositol; PS, phosphatidylserine.
Fig. 5
Fig. 5. Analysis of ceramide metabolism in the LAR subtype revealed S1P as a potential therapeutic target.
a Log2 fold change of lipid subclasses between tumor and normal tissues and between LAR and non-LAR tumors. Log2 fold change of each lipid subclass was calculated as the mean log2 fold change of the abundances of lipids belonging to this subclass. b Metabolomic changes in sphingolipid (SP) metabolism. Log2 fold changes of the abundances of metabolites in tumor samples (LAR or non-LAR) as compared with normal tissues were illustrated. c Transcriptomic changes in three SP metabolism-related pathways. ssGSEA scores of the pathways based on transcriptomics were calculated and compared among LAR tumors, non-LAR tumors and normal tissues. d Proportions of isotope-labeled intermediates that are involved in the de novo synthesis and degradation of the ceramide pathway in LAR and non-LAR cell lines. MDA-MB-453 and MFM-223 cell lines of LAR subtype as well as BT-549 and LM2-4175 cell lines of non-LAR subtype were used for experiments. Each sample was detected with three replicates. e, f Viability detection of PDOs after blocking different steps involved in de novo synthesis and degradation of ceramide pathway (n = 5 different PDOs with three replicates for each group). The efficacy of inhibition (e) and representative images (f) were illustrated. The concentrations of the inhibitors were as follows: NCT-503, 30 µM; PF-543, 10 µM; Opaganib, 50 µM; Siponimod, 30 µM; JTE-013, 30 µM; FTY-720, 1 µM. g Pharmacological tests of PF-543 and FTY-720 using mini-PDX models. h Drug sensitivity results for mini-PDX models of LAR and non-LAR tumors (n = 3 different mini-PDX with three replicates for each group). Statistical comparisons in d, e and h were conducted using two-tailed Student’s t-test. Data are presented as means ± SEM. Scale bars, 200 μm. ***P < 0.001, **P < 0.01; *P < 0.05; ns, P ≥ 0.05. Cer, ceramides; AS, α-hydroxy fatty acid-sphingosine; AP, α-hydroxy fatty acid-phytospingosine; NS, non-hydroxyfatty acid-sphingosine; BS, β-hydroxy fatty acidsphingosine; ADS, α-hydroxy fatty acid-dihydrosphingosine; NDS, non-hydroxy fatty acid-dihydrosphingosine; HexCer, Hexosylceramide; OxPE, oxidized phosphatidylethanolamine; OxPC, oxidized phosphatidylcholine; SPT, serine palmitoyltransferases; CERS, (dihydro)ceramide synthases; CDase, ceramidase; SPHK, sphingosine kinase.
Fig. 6
Fig. 6. Identification of NAAG as a crucial tumor-promoting metabolite in BLIS tumors.
a Screening criteria of metabolites potentially promoting tumor progression in BLIS tumors. b RFS of patients with different NAAG abundances of BLIS tumors. The P value was calculated by the log rank test. c Confirmation of NAAG by comparison with standard compound. Measured MS/MS spectral fragmentation profiles (top, in red) matched those of chemical standards (bottom, in gray). d Illustration of the NAAG metabolism pathway. e, f mRNA expression of RIMKLA and RIMKLB (e) and their relationship with NAAG abundance in BLIS tumors (f). g Quantification of cell proliferation after knocking down RIMKLB with shRNA and the complement of NAAG. h Right panel: quantification of cells migrating across transwell filters and invading through matrigel-coated transwells after knocking down RIMKLB with shRNA and the complement of NAAG. Left panel: representative images of three replicates. Ten random fields were counted per insert at 20×. i Experimental design. j, k Effect of RIMKLB knockdown and NAAG complement on tumor growth (j) and tumor weight (k) (n = 6 for each group). Statistical comparisons in gk were conducted using two-tailed Student’s t-test. Data are presented as means ± SEM. Scale bars, 200 μm. ***P < 0.001, **P < 0.01; *P < 0.05; ns, P ≥ 0.05. NAA, N-acetyl-aspartic acid.

Comment in

References

    1. Denkert C, Liedtke C, Tutt A, von Minckwitz G. Molecular alterations in triple-negative breast cancer-the road to new treatment strategies. Lancet. 2017;389:2430–2442. - PubMed
    1. Lehmann BD, et al. Identification of human triple-negative breast cancer subtypes and preclinical models for selection of targeted therapies. J. Clin. Invest. 2011;121:2750–2767. - PMC - PubMed
    1. Burstein MD, et al. Comprehensive genomic analysis identifies novel subtypes and targets of triple-negative breast cancer. Clin. Cancer Res. 2015;21:1688–1698. - PMC - PubMed
    1. Jiang YZ, et al. Genomic and transcriptomic landscape of triple-negative breast cancers: subtypes and treatment strategies. Cancer Cell. 2019;35:428–440 e5. - PubMed
    1. Jiang YZ, et al. Molecular subtyping and genomic profiling expand precision medicine in refractory metastatic triple-negative breast cancer: the FUTURE trial. Cell Res. 2021;31:178–186. - PMC - PubMed

Publication types

Substances

Associated data