. 2022 Feb;23(2):287-302.
doi: 10.1038/s41590-021-01105-x. Epub 2022 Feb 1.

The volume-regulated anion channel LRRC8C suppresses T cell function by regulating cyclic dinucleotide transport and STING-p53 signaling

Affiliations

The volume-regulated anion channel LRRC8C suppresses T cell function by regulating cyclic dinucleotide transport and STING-p53 signaling

Axel R Concepcion et al. Nat Immunol. 2022 Feb.

Abstract

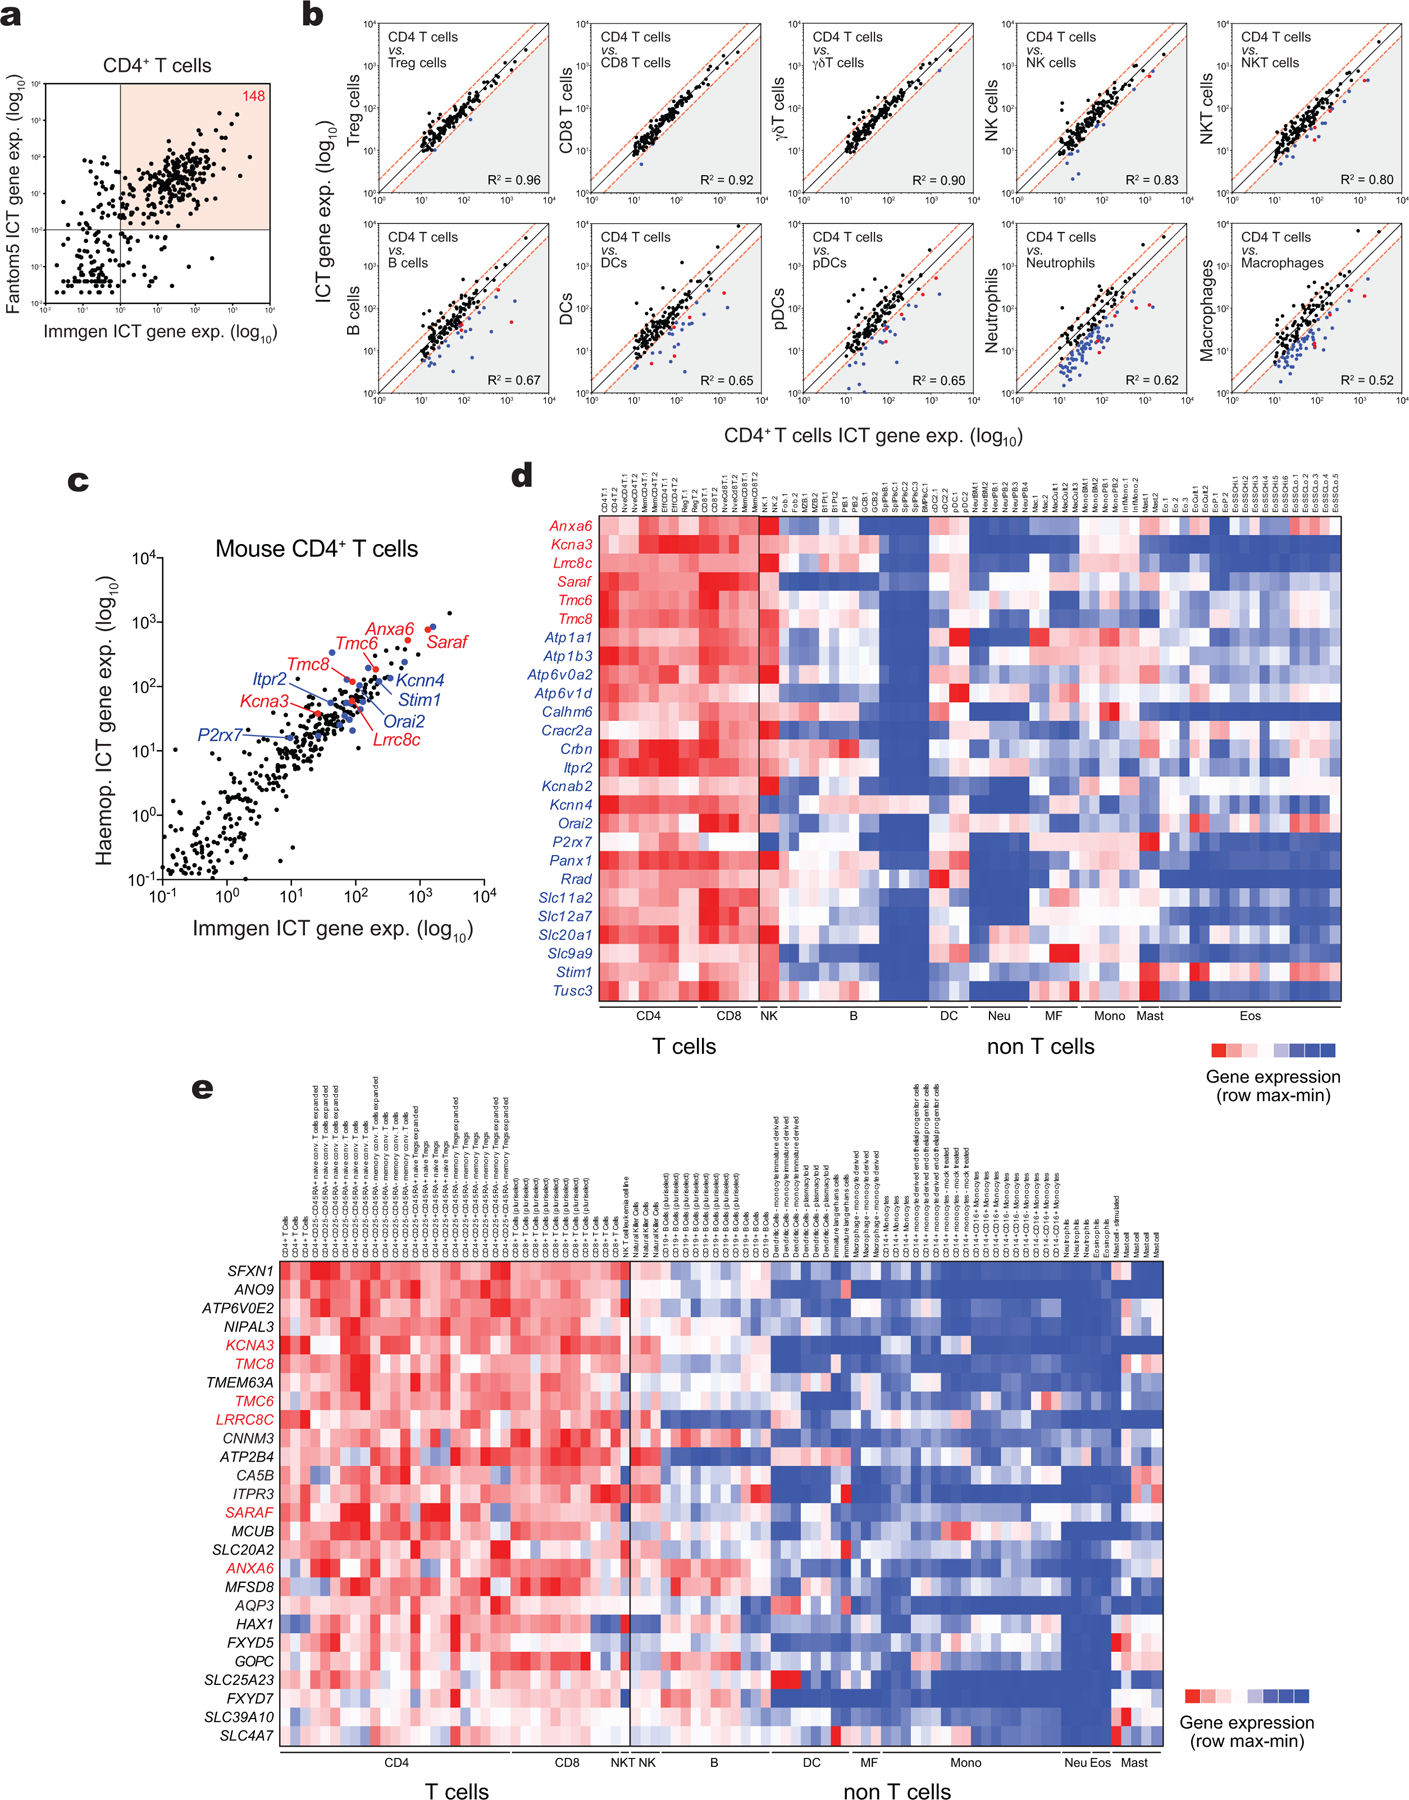
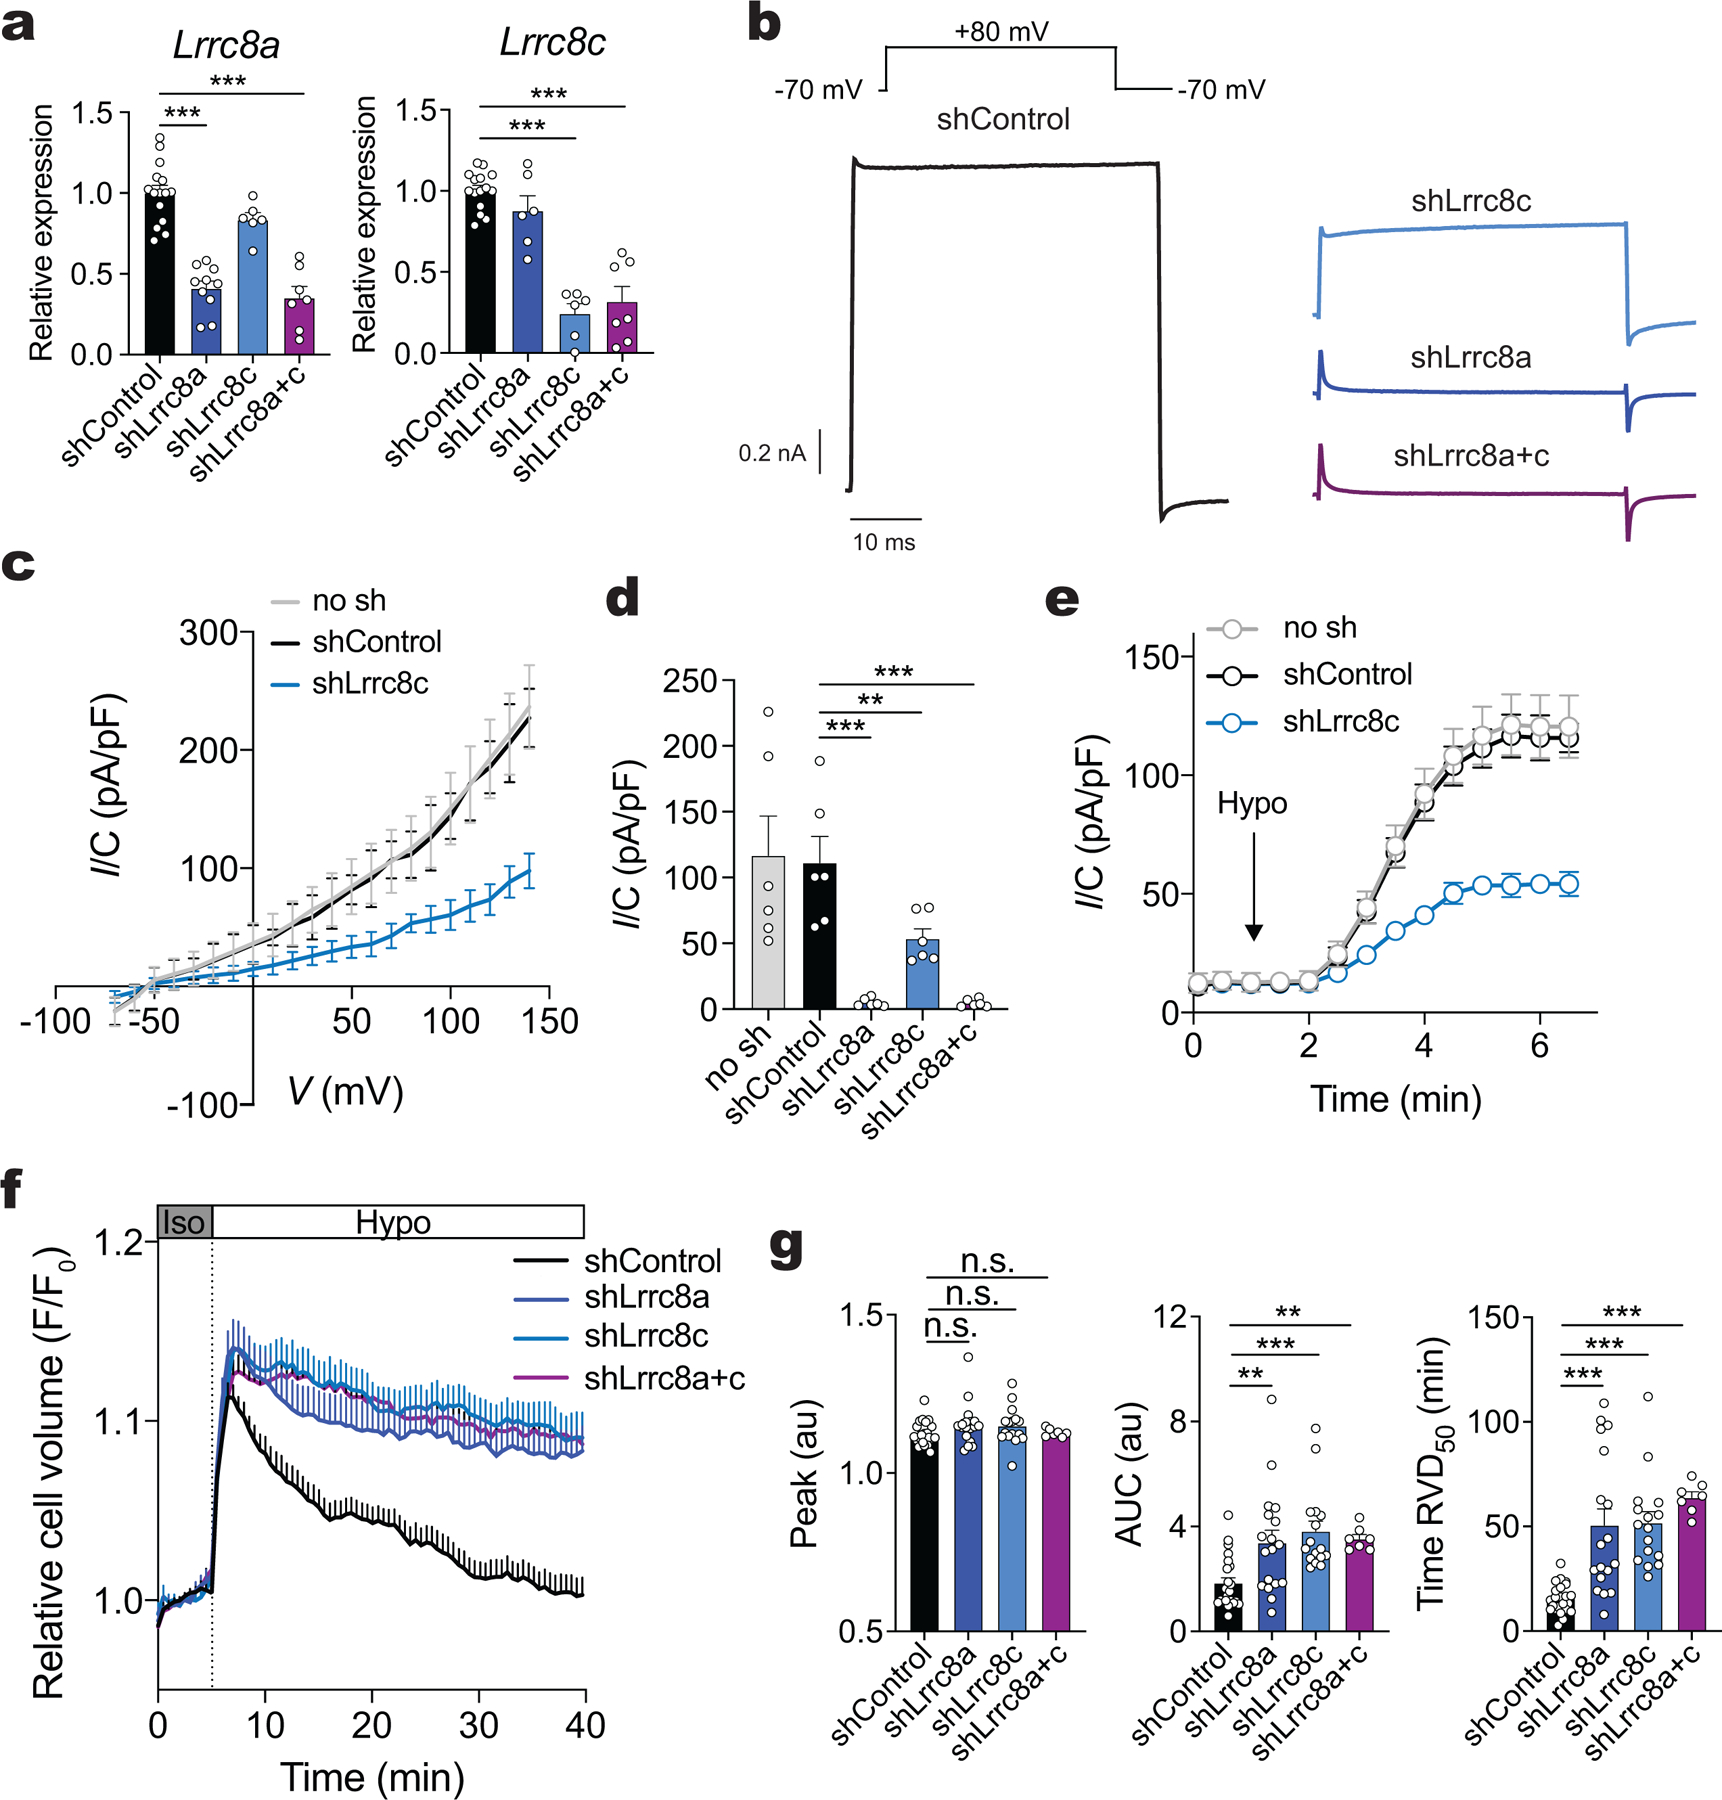
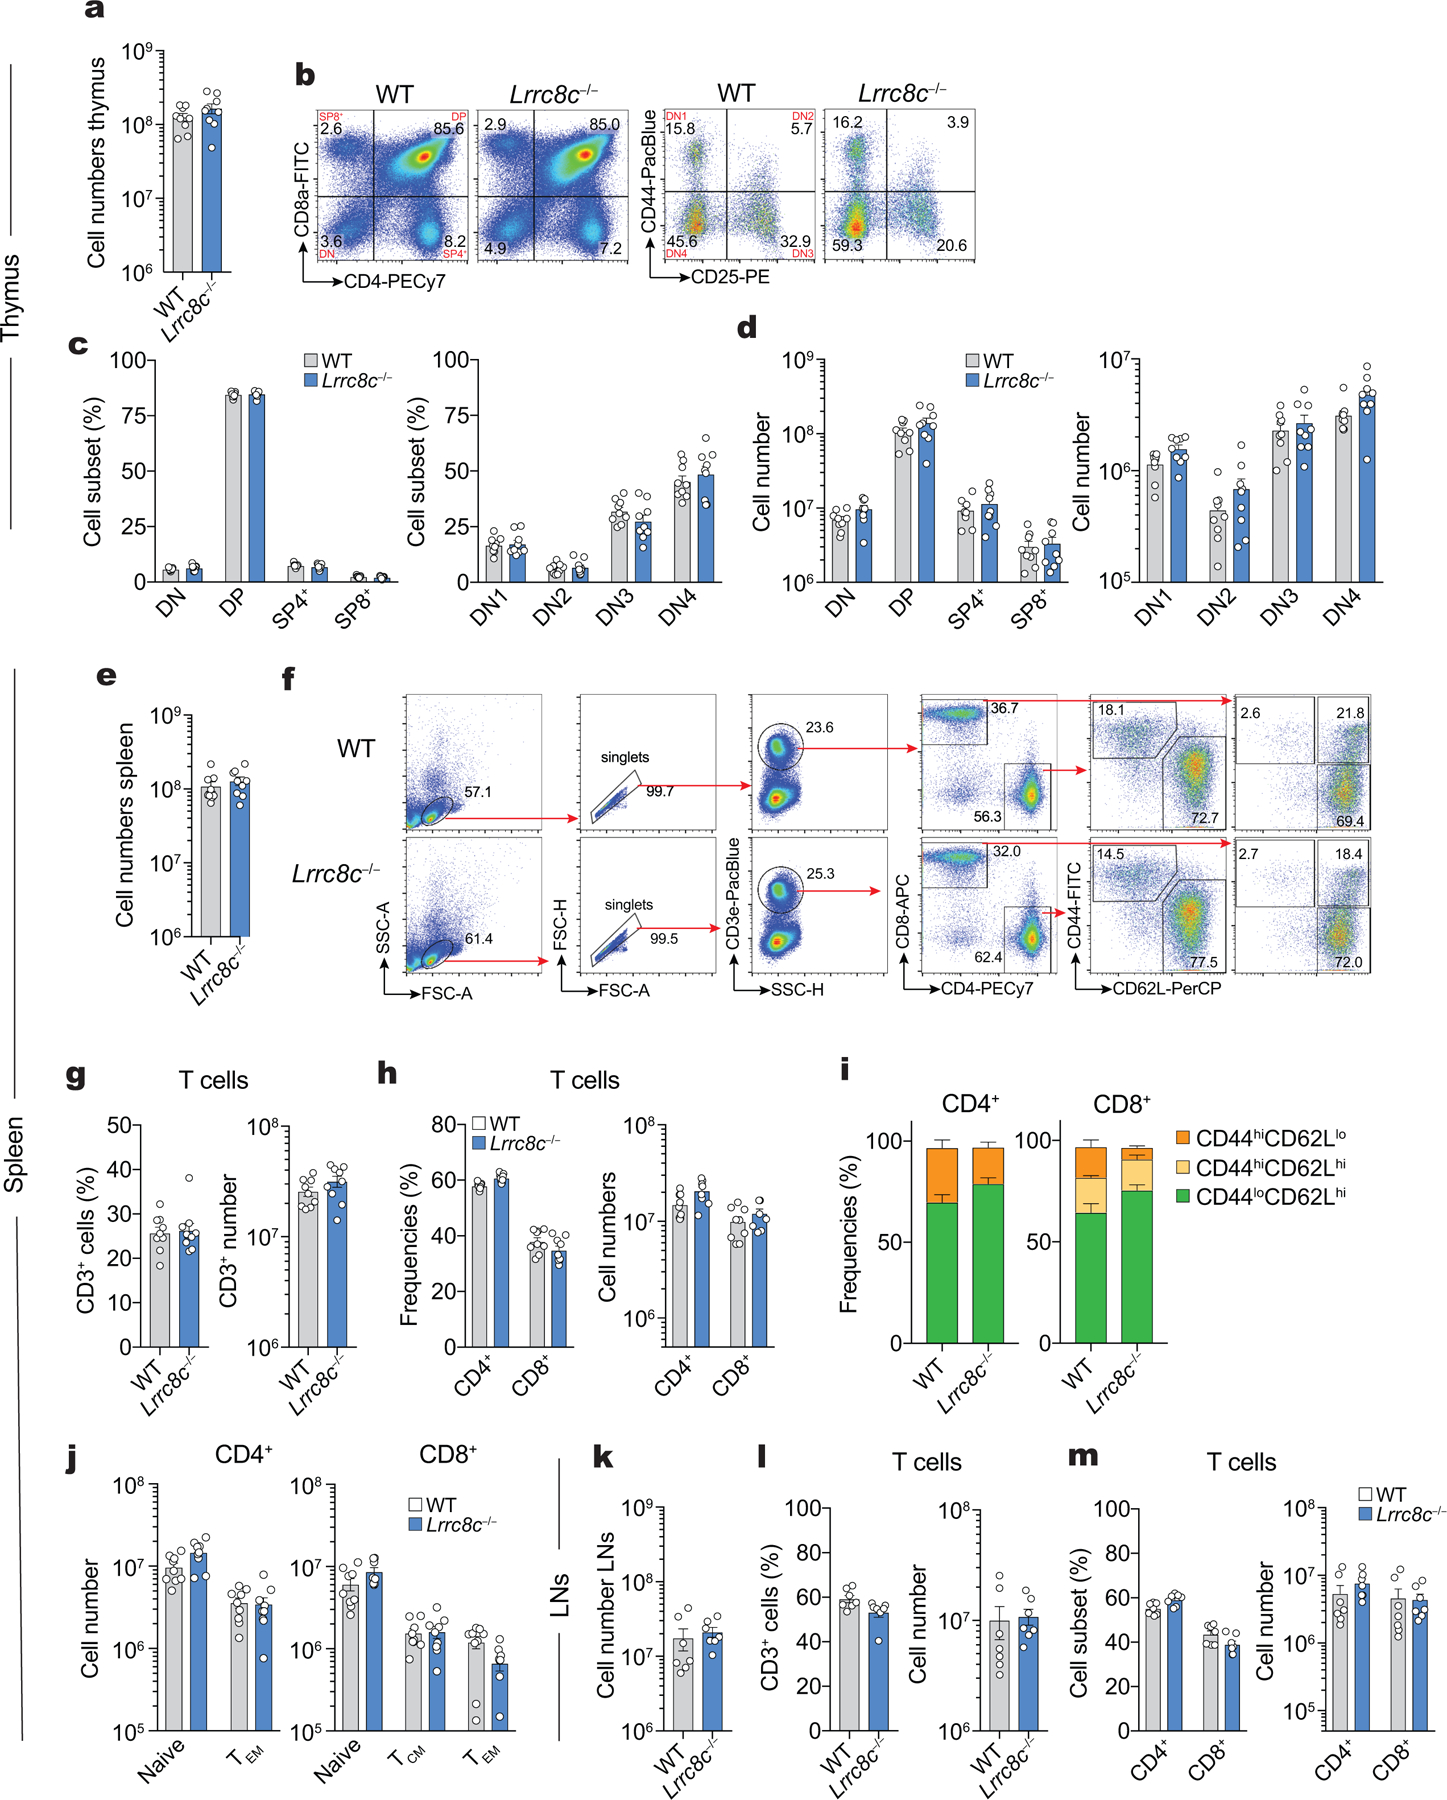
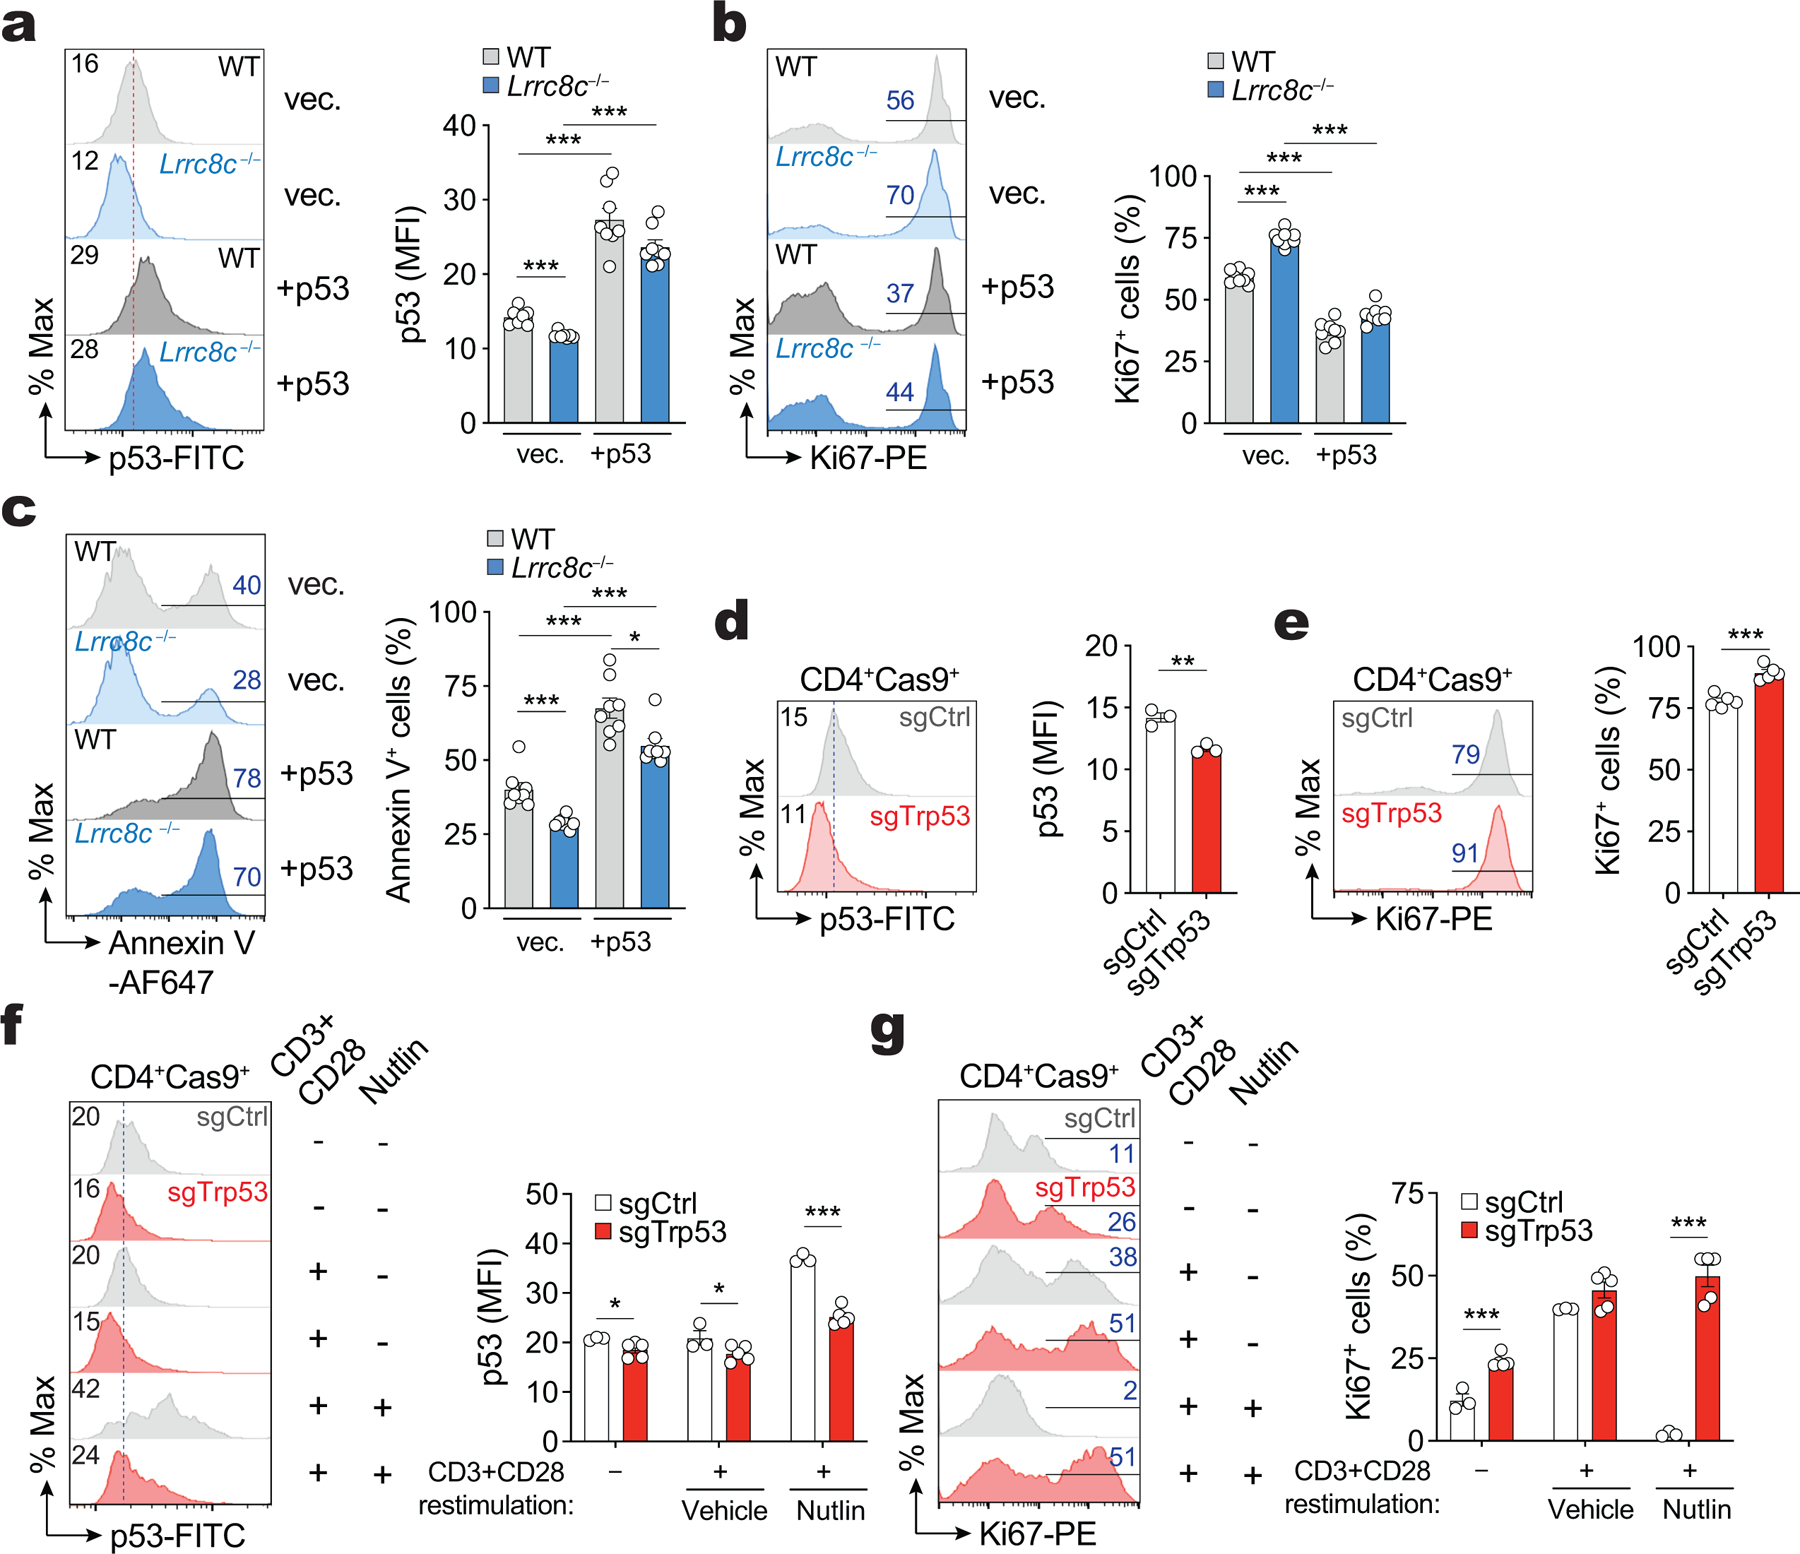
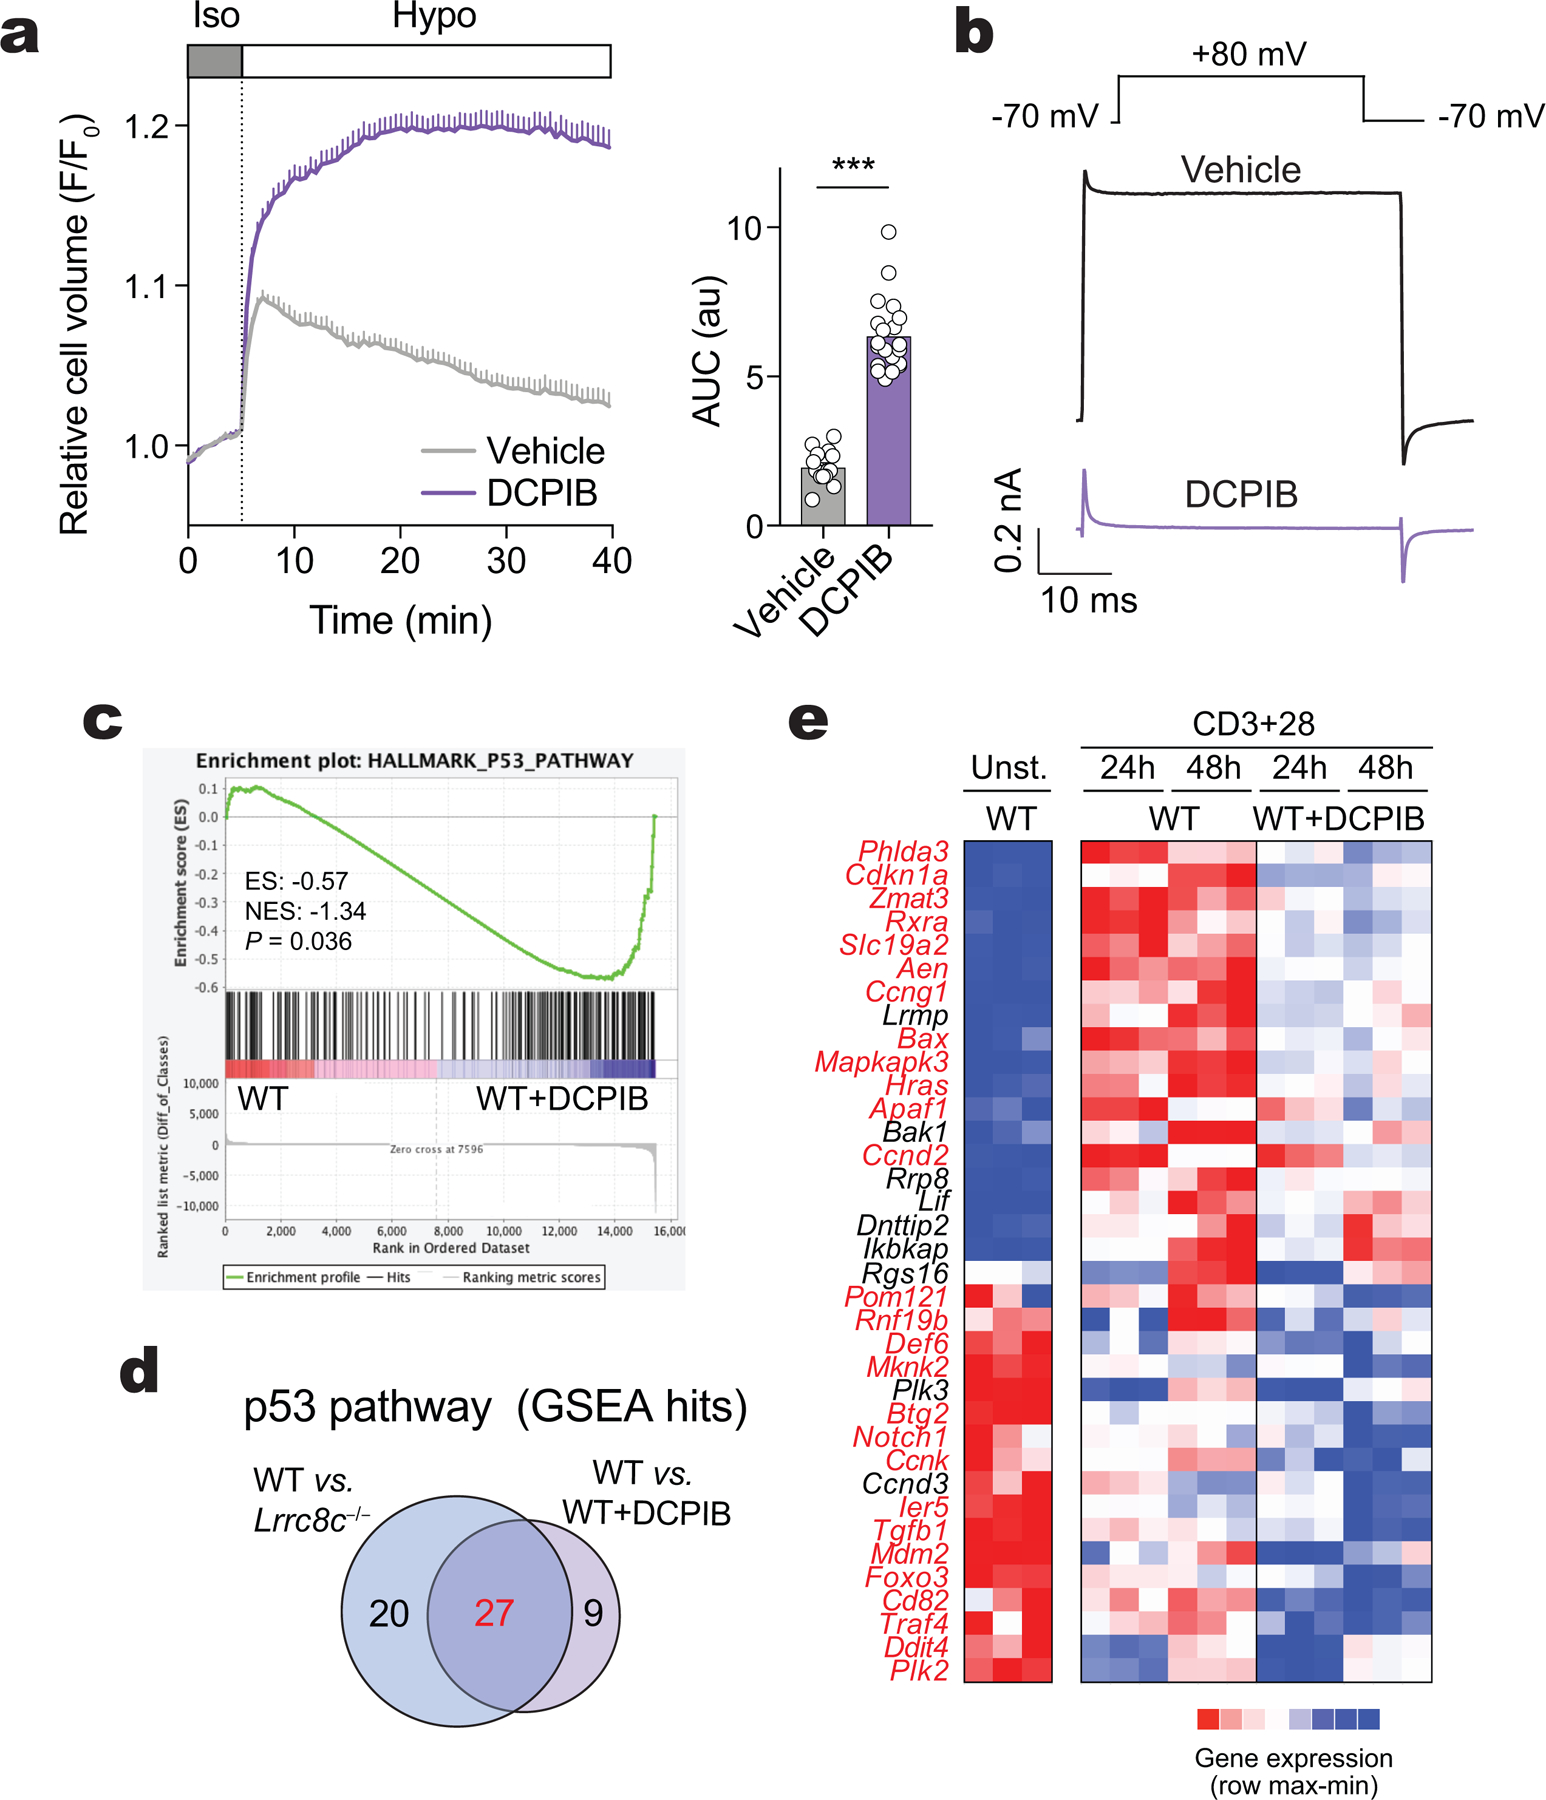
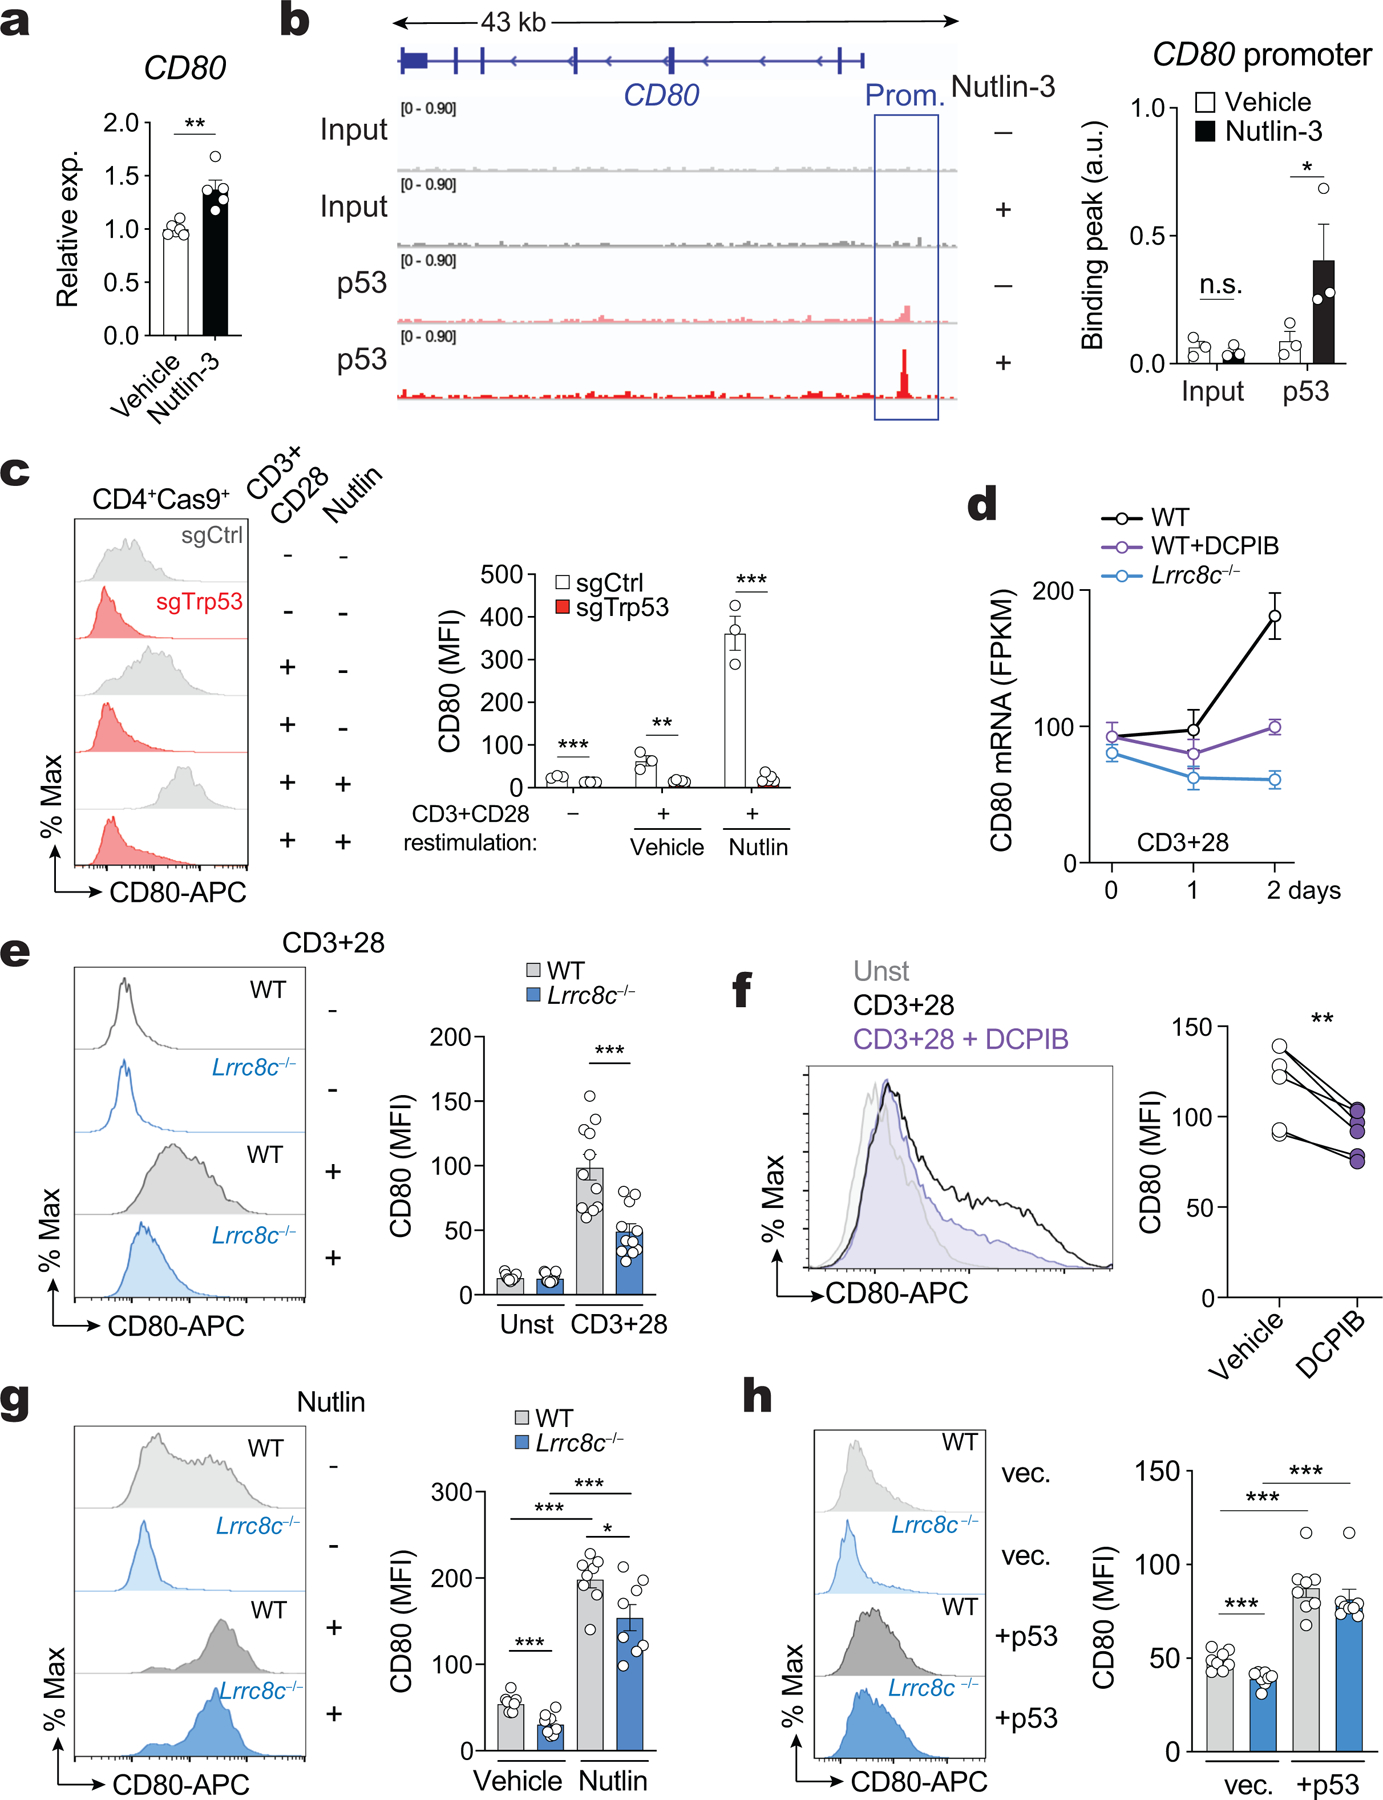
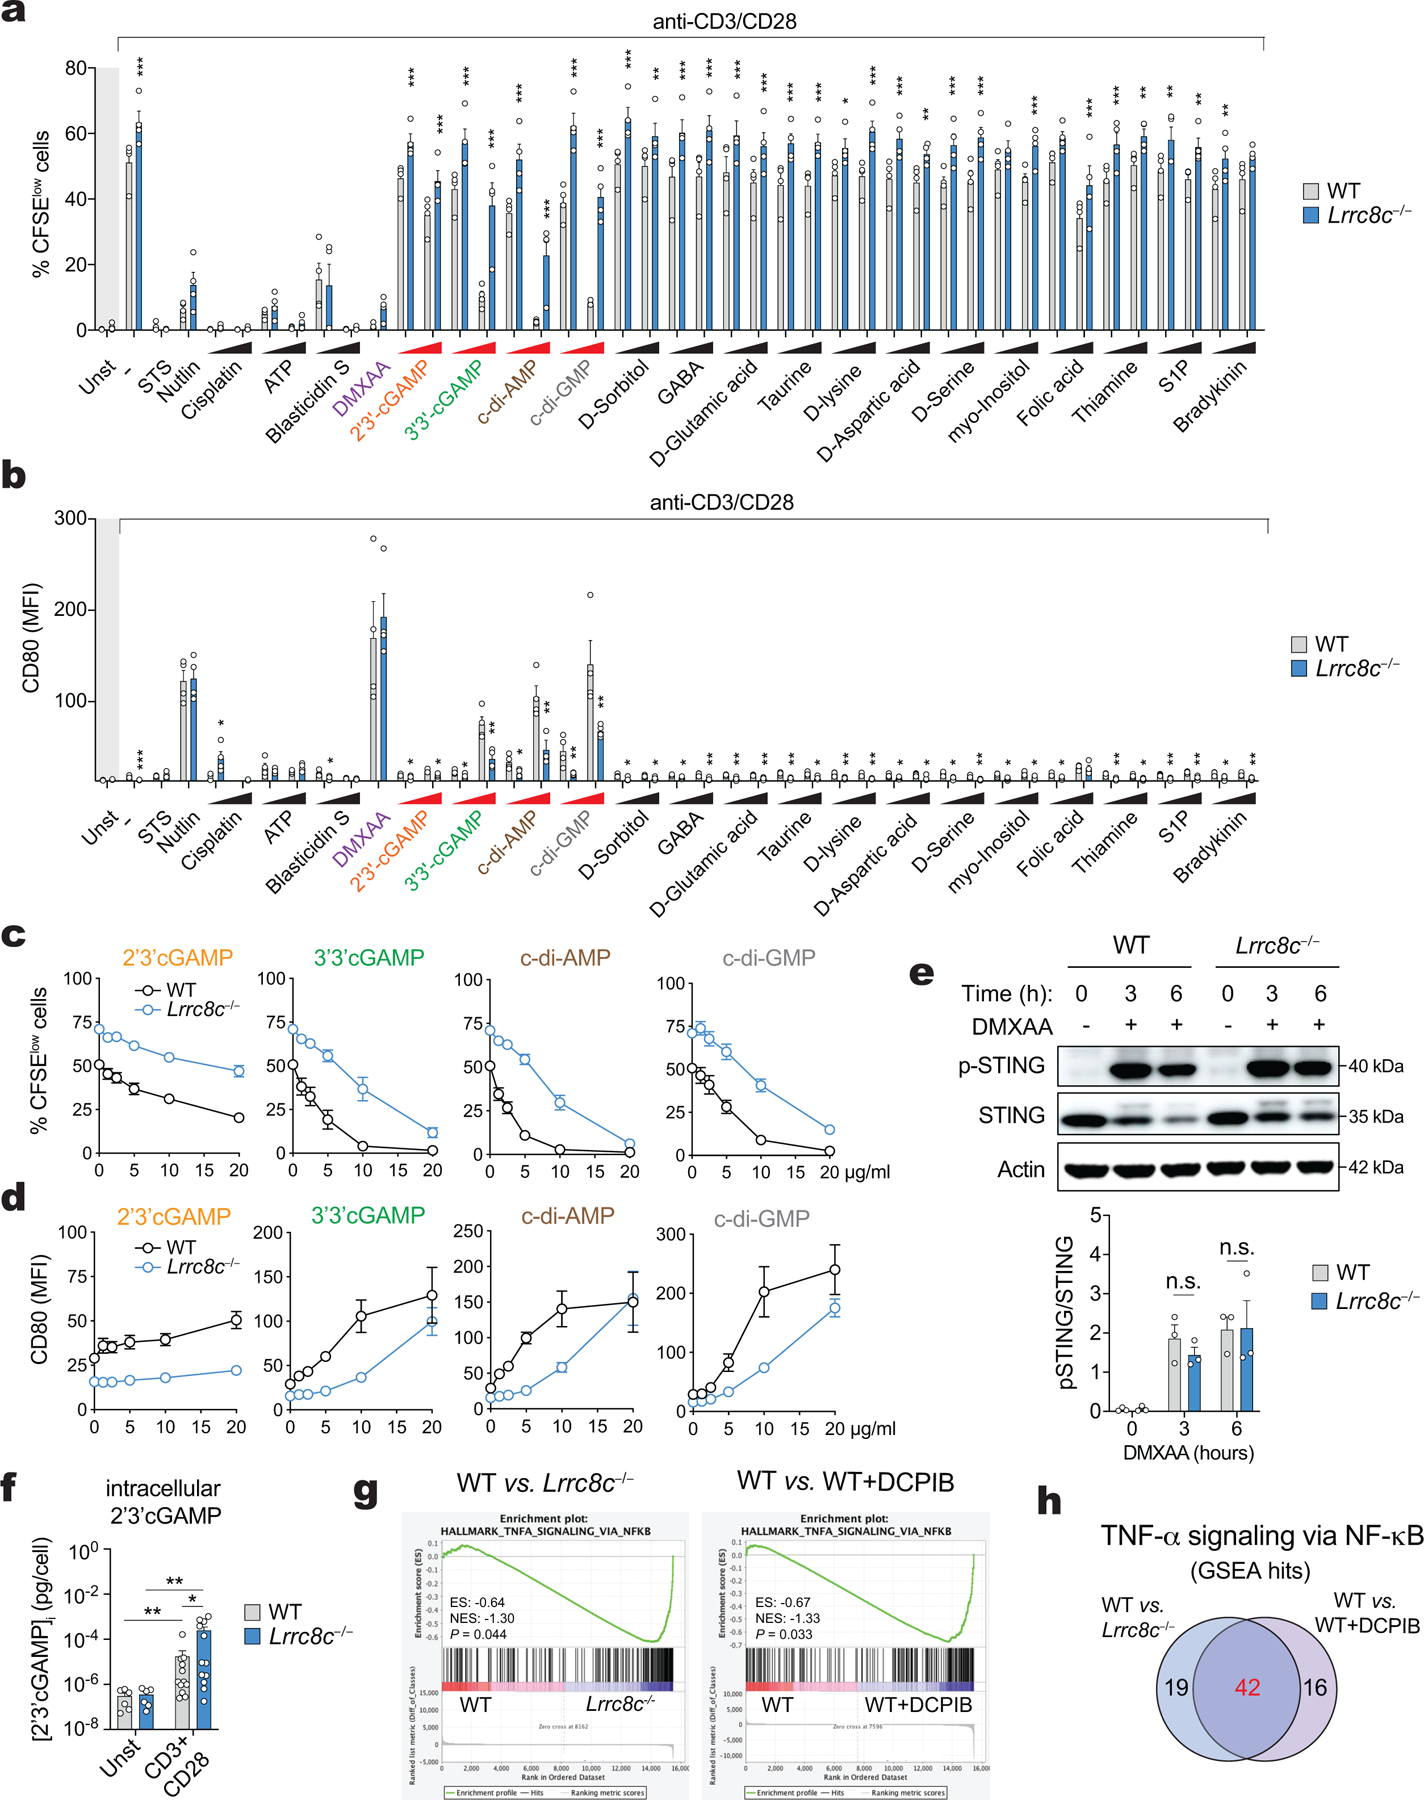
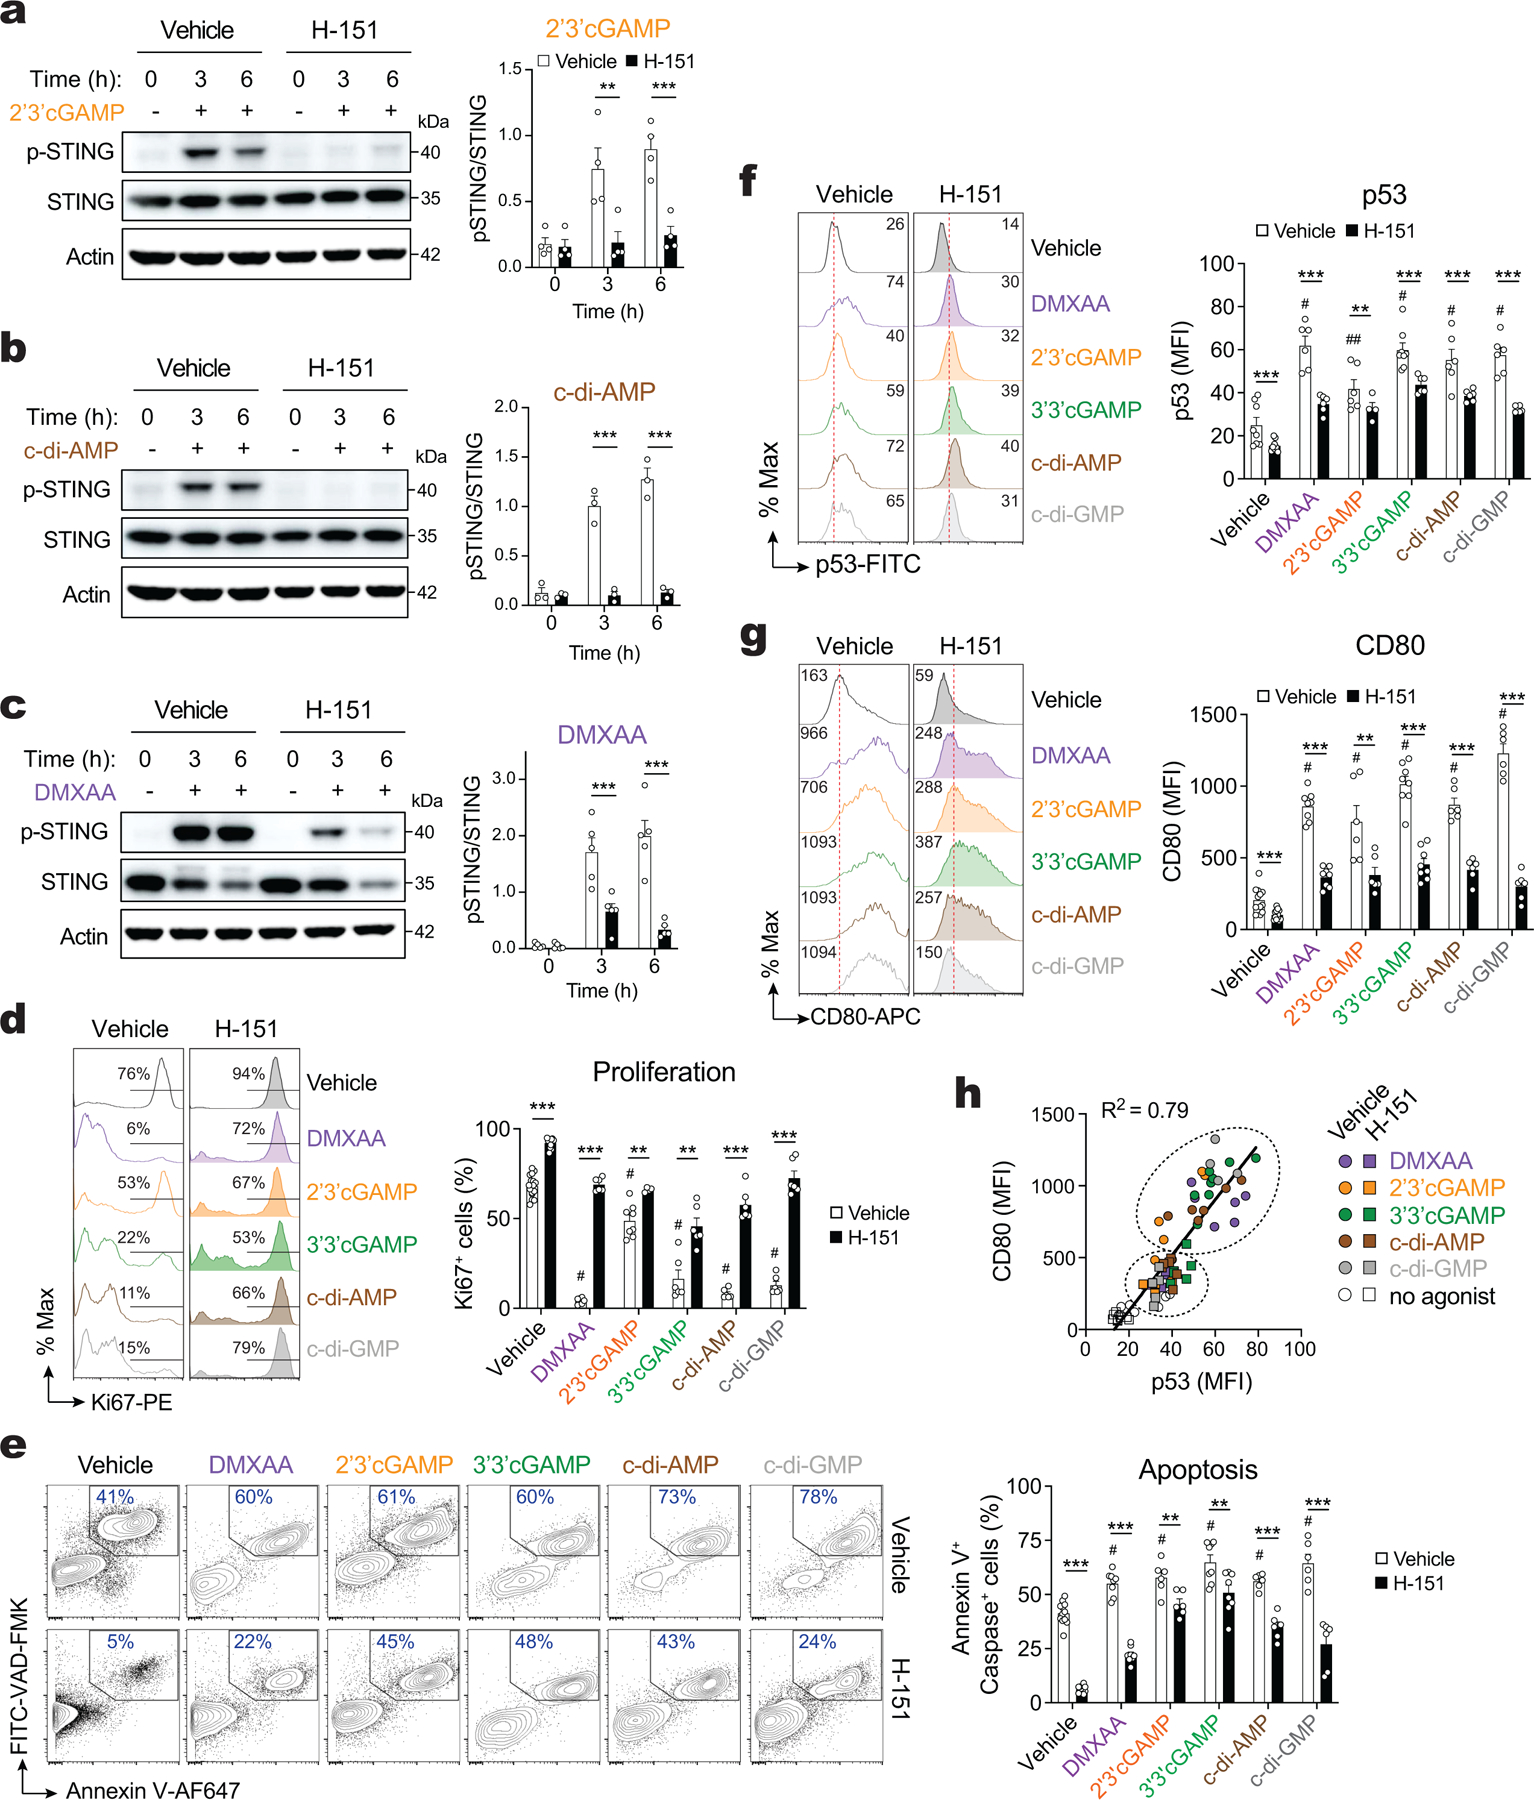
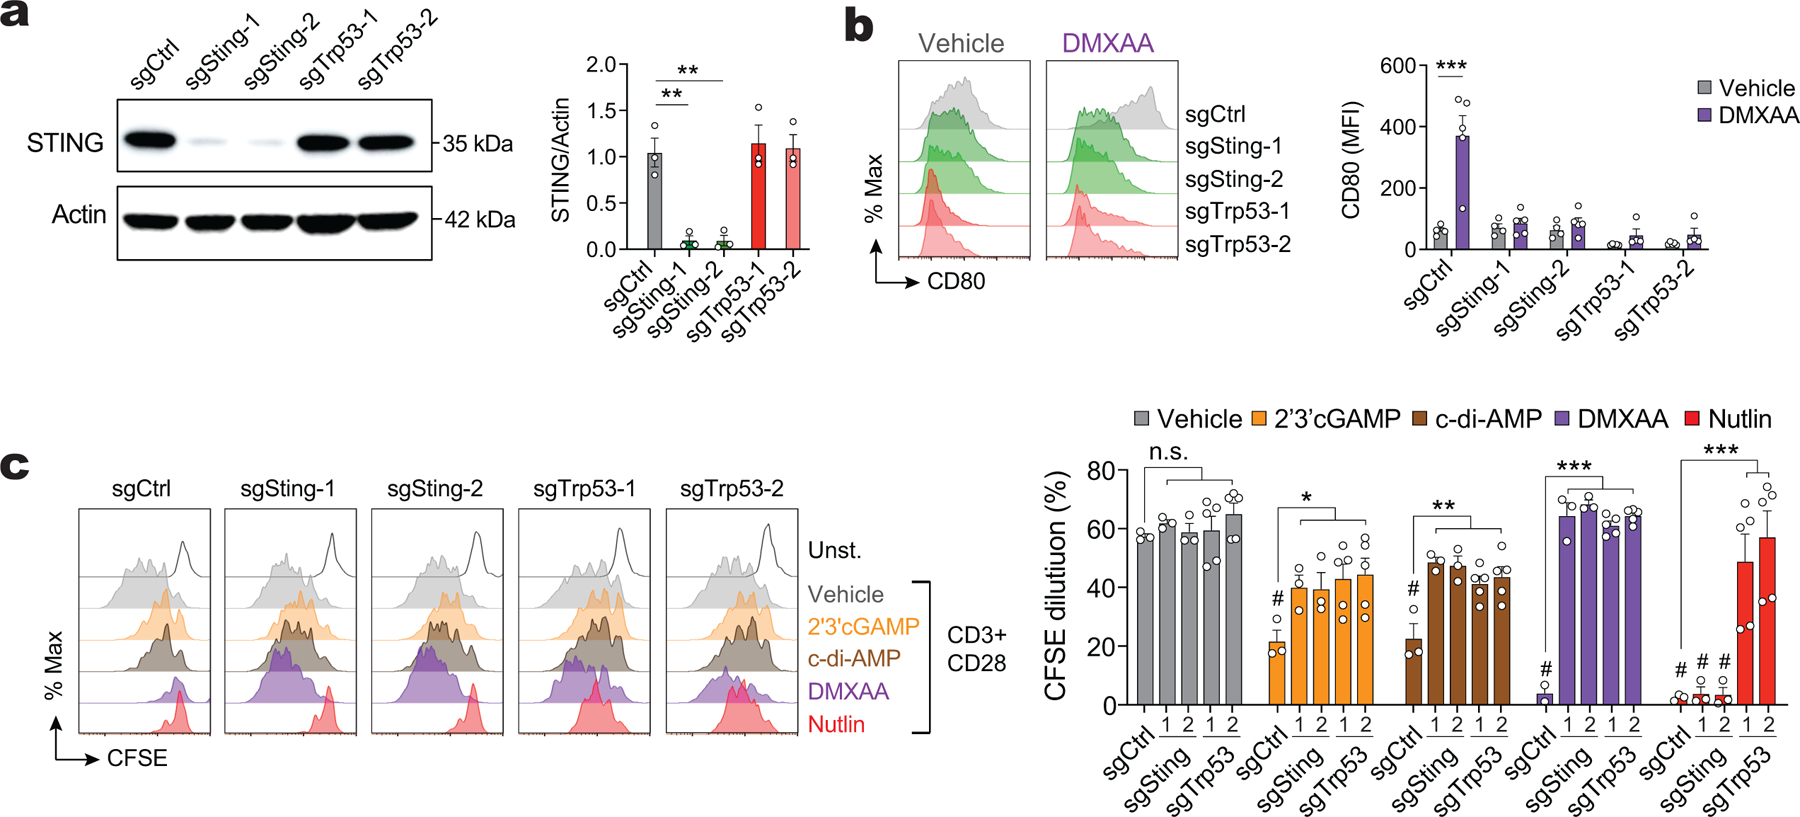
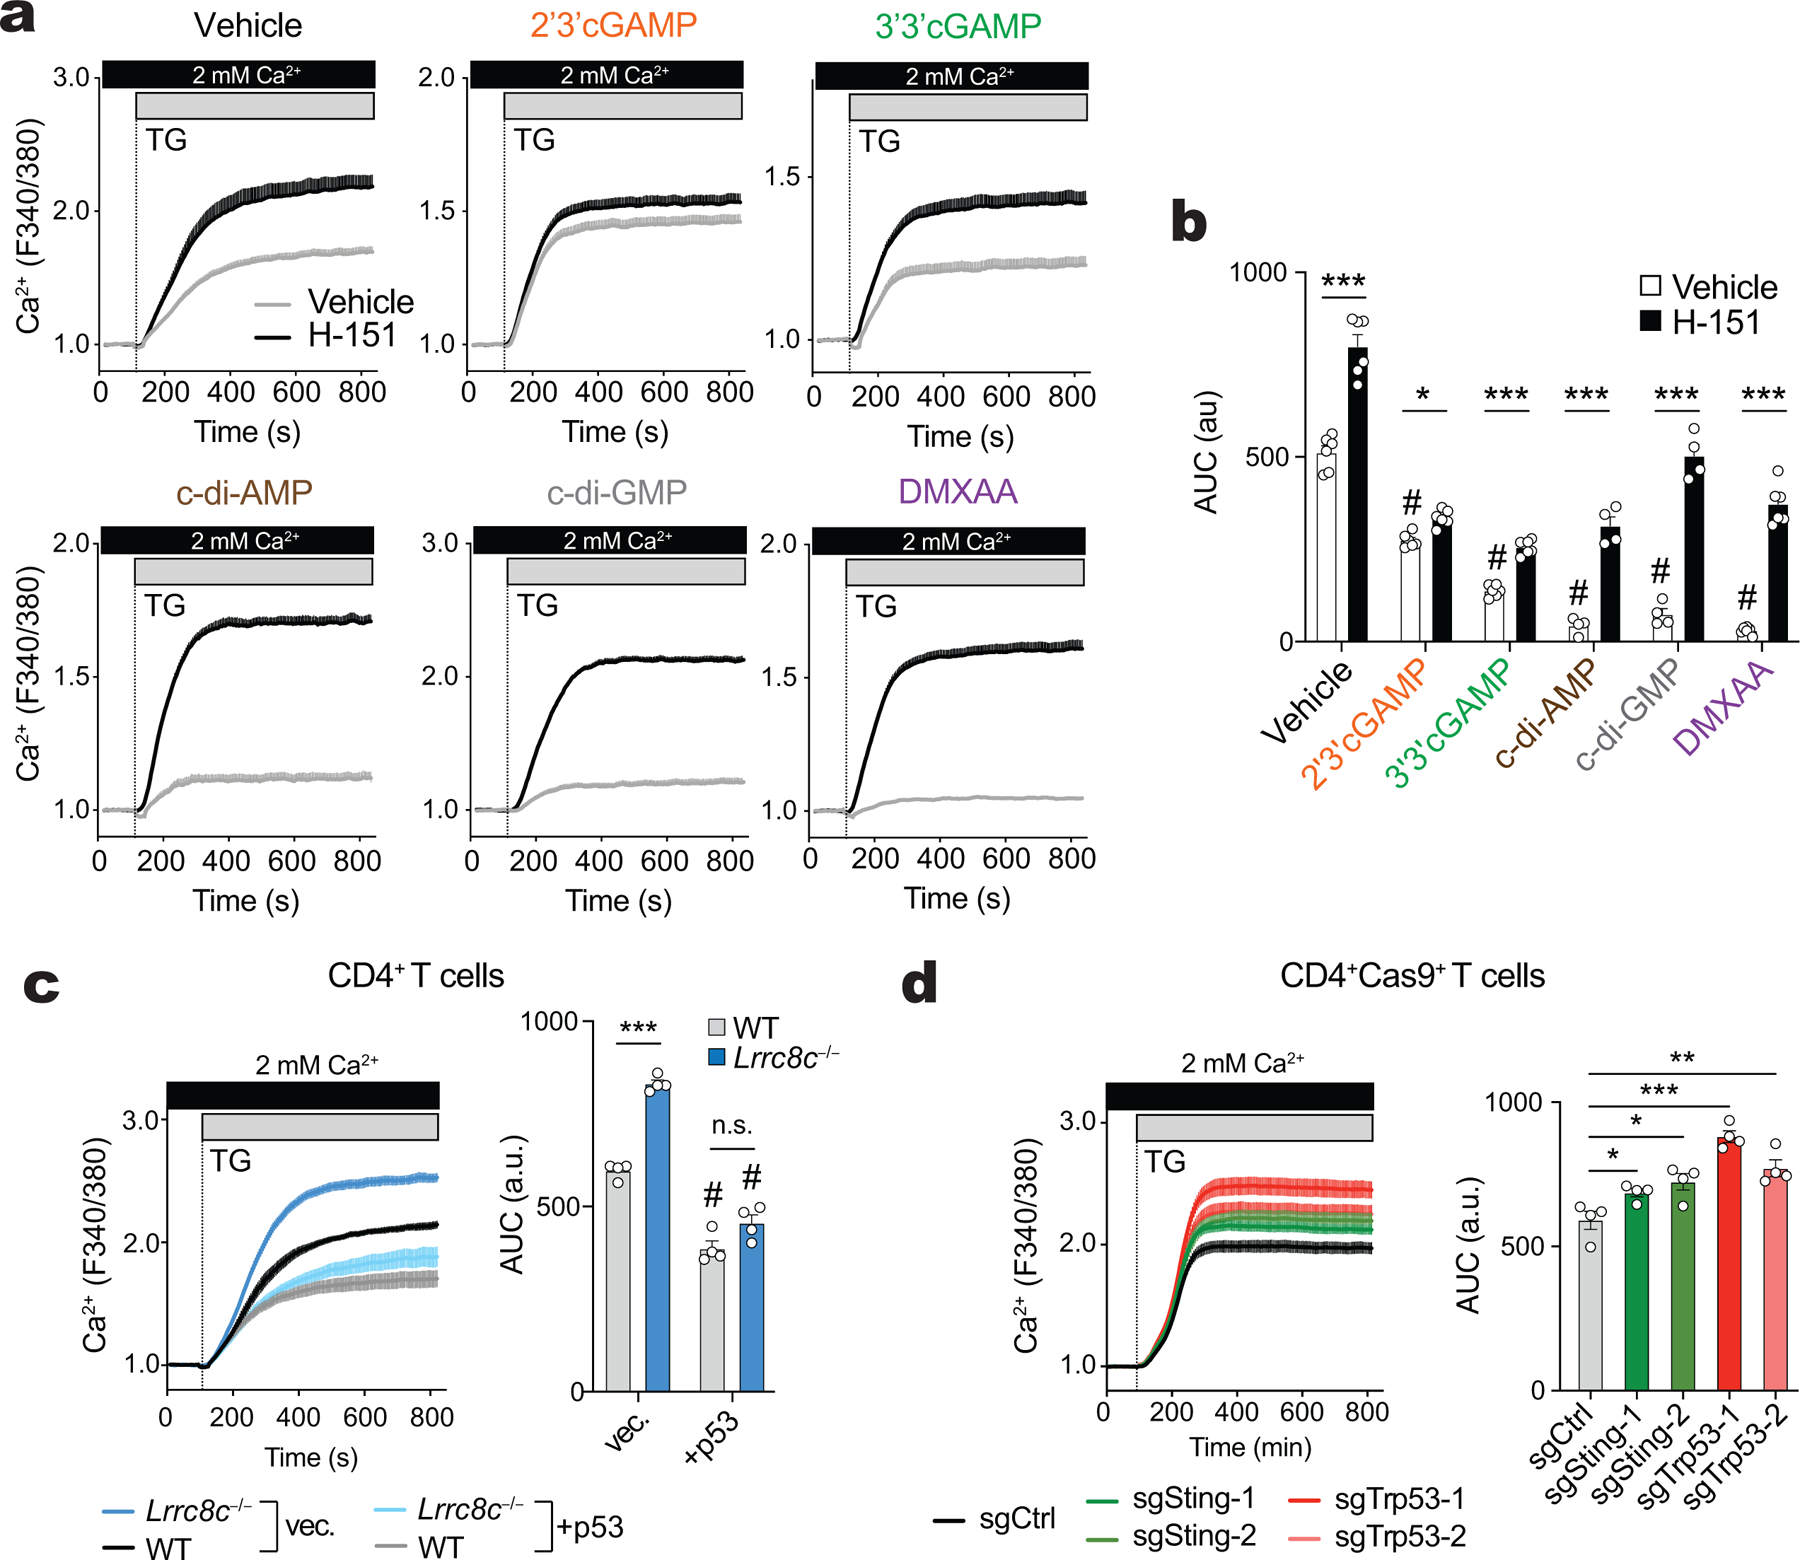
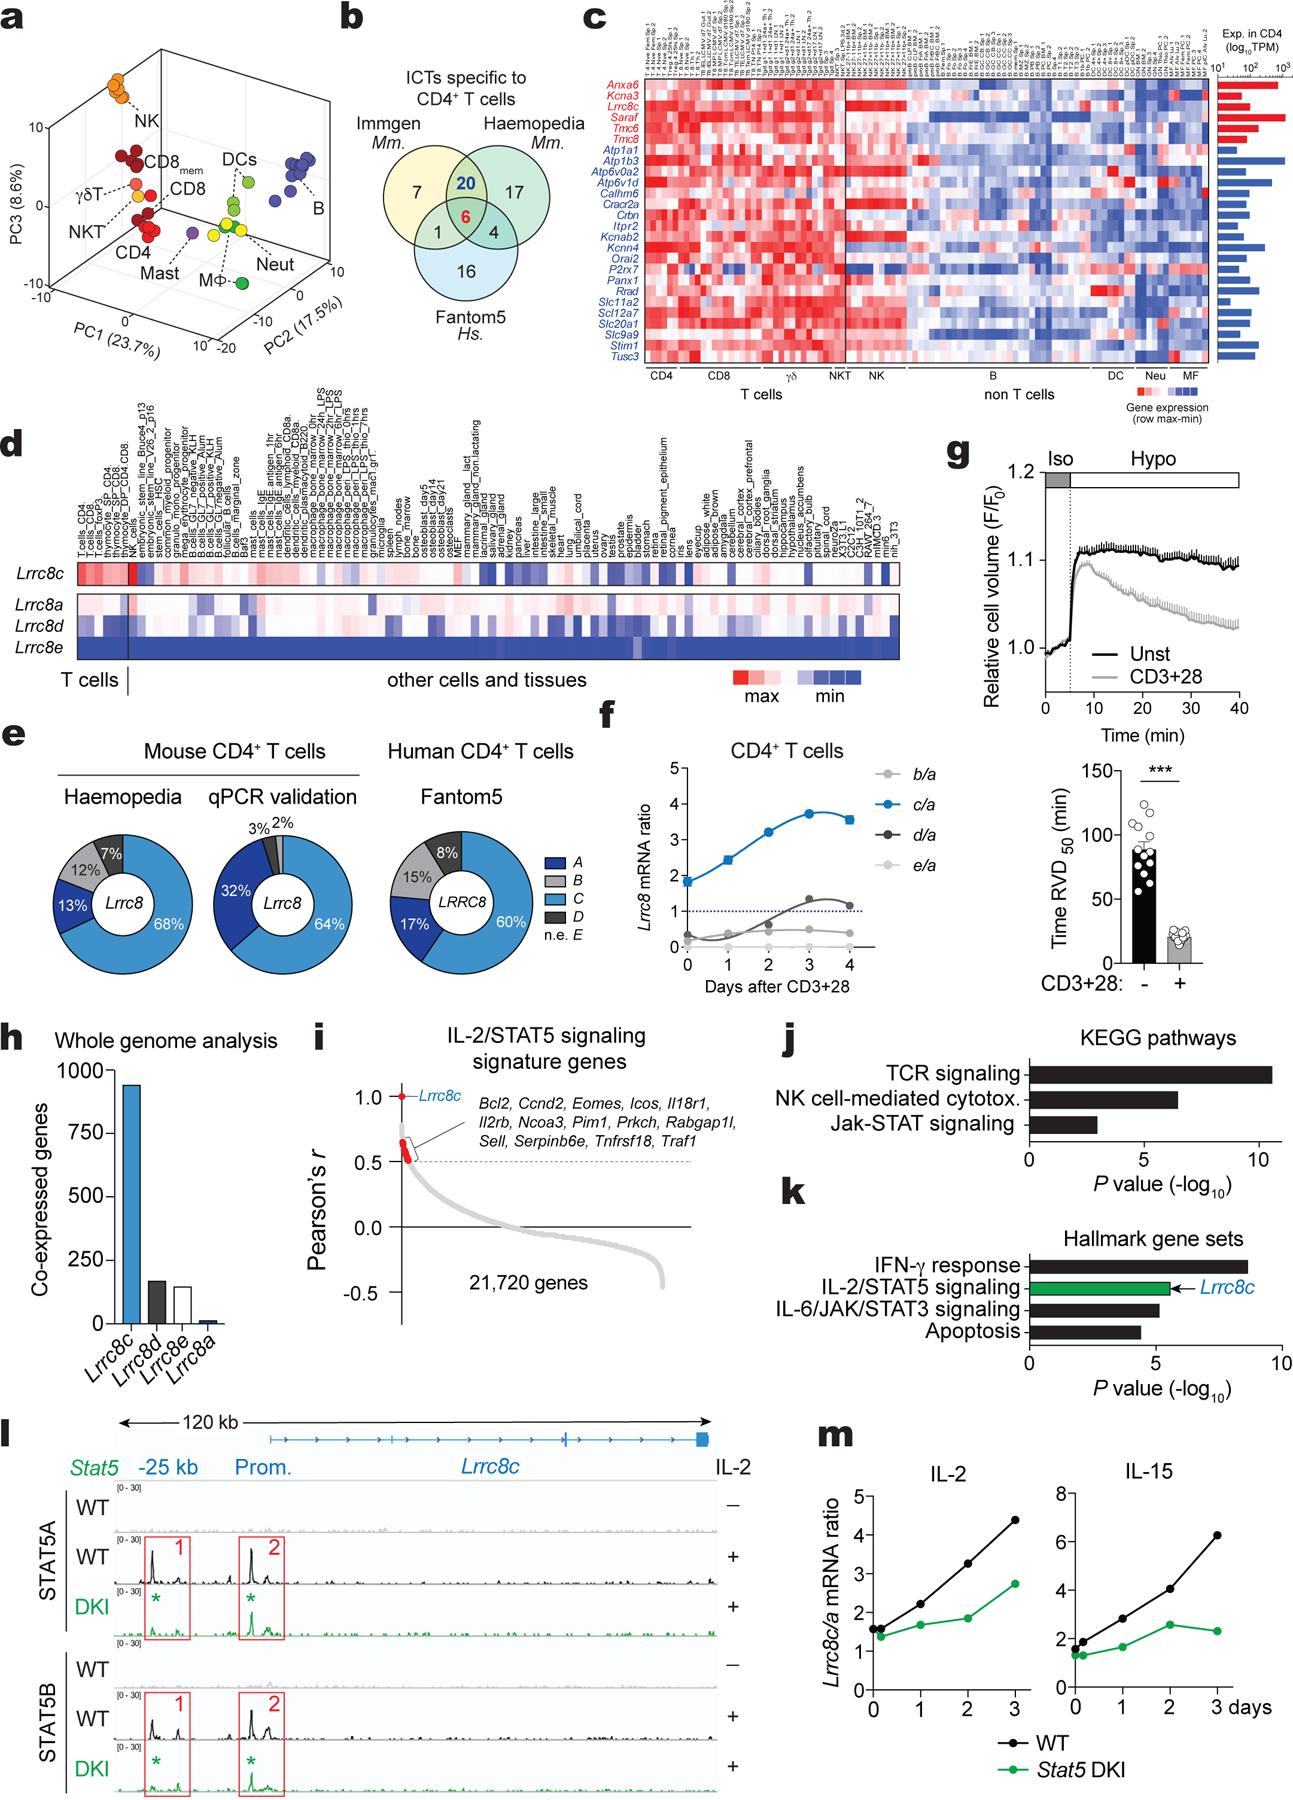
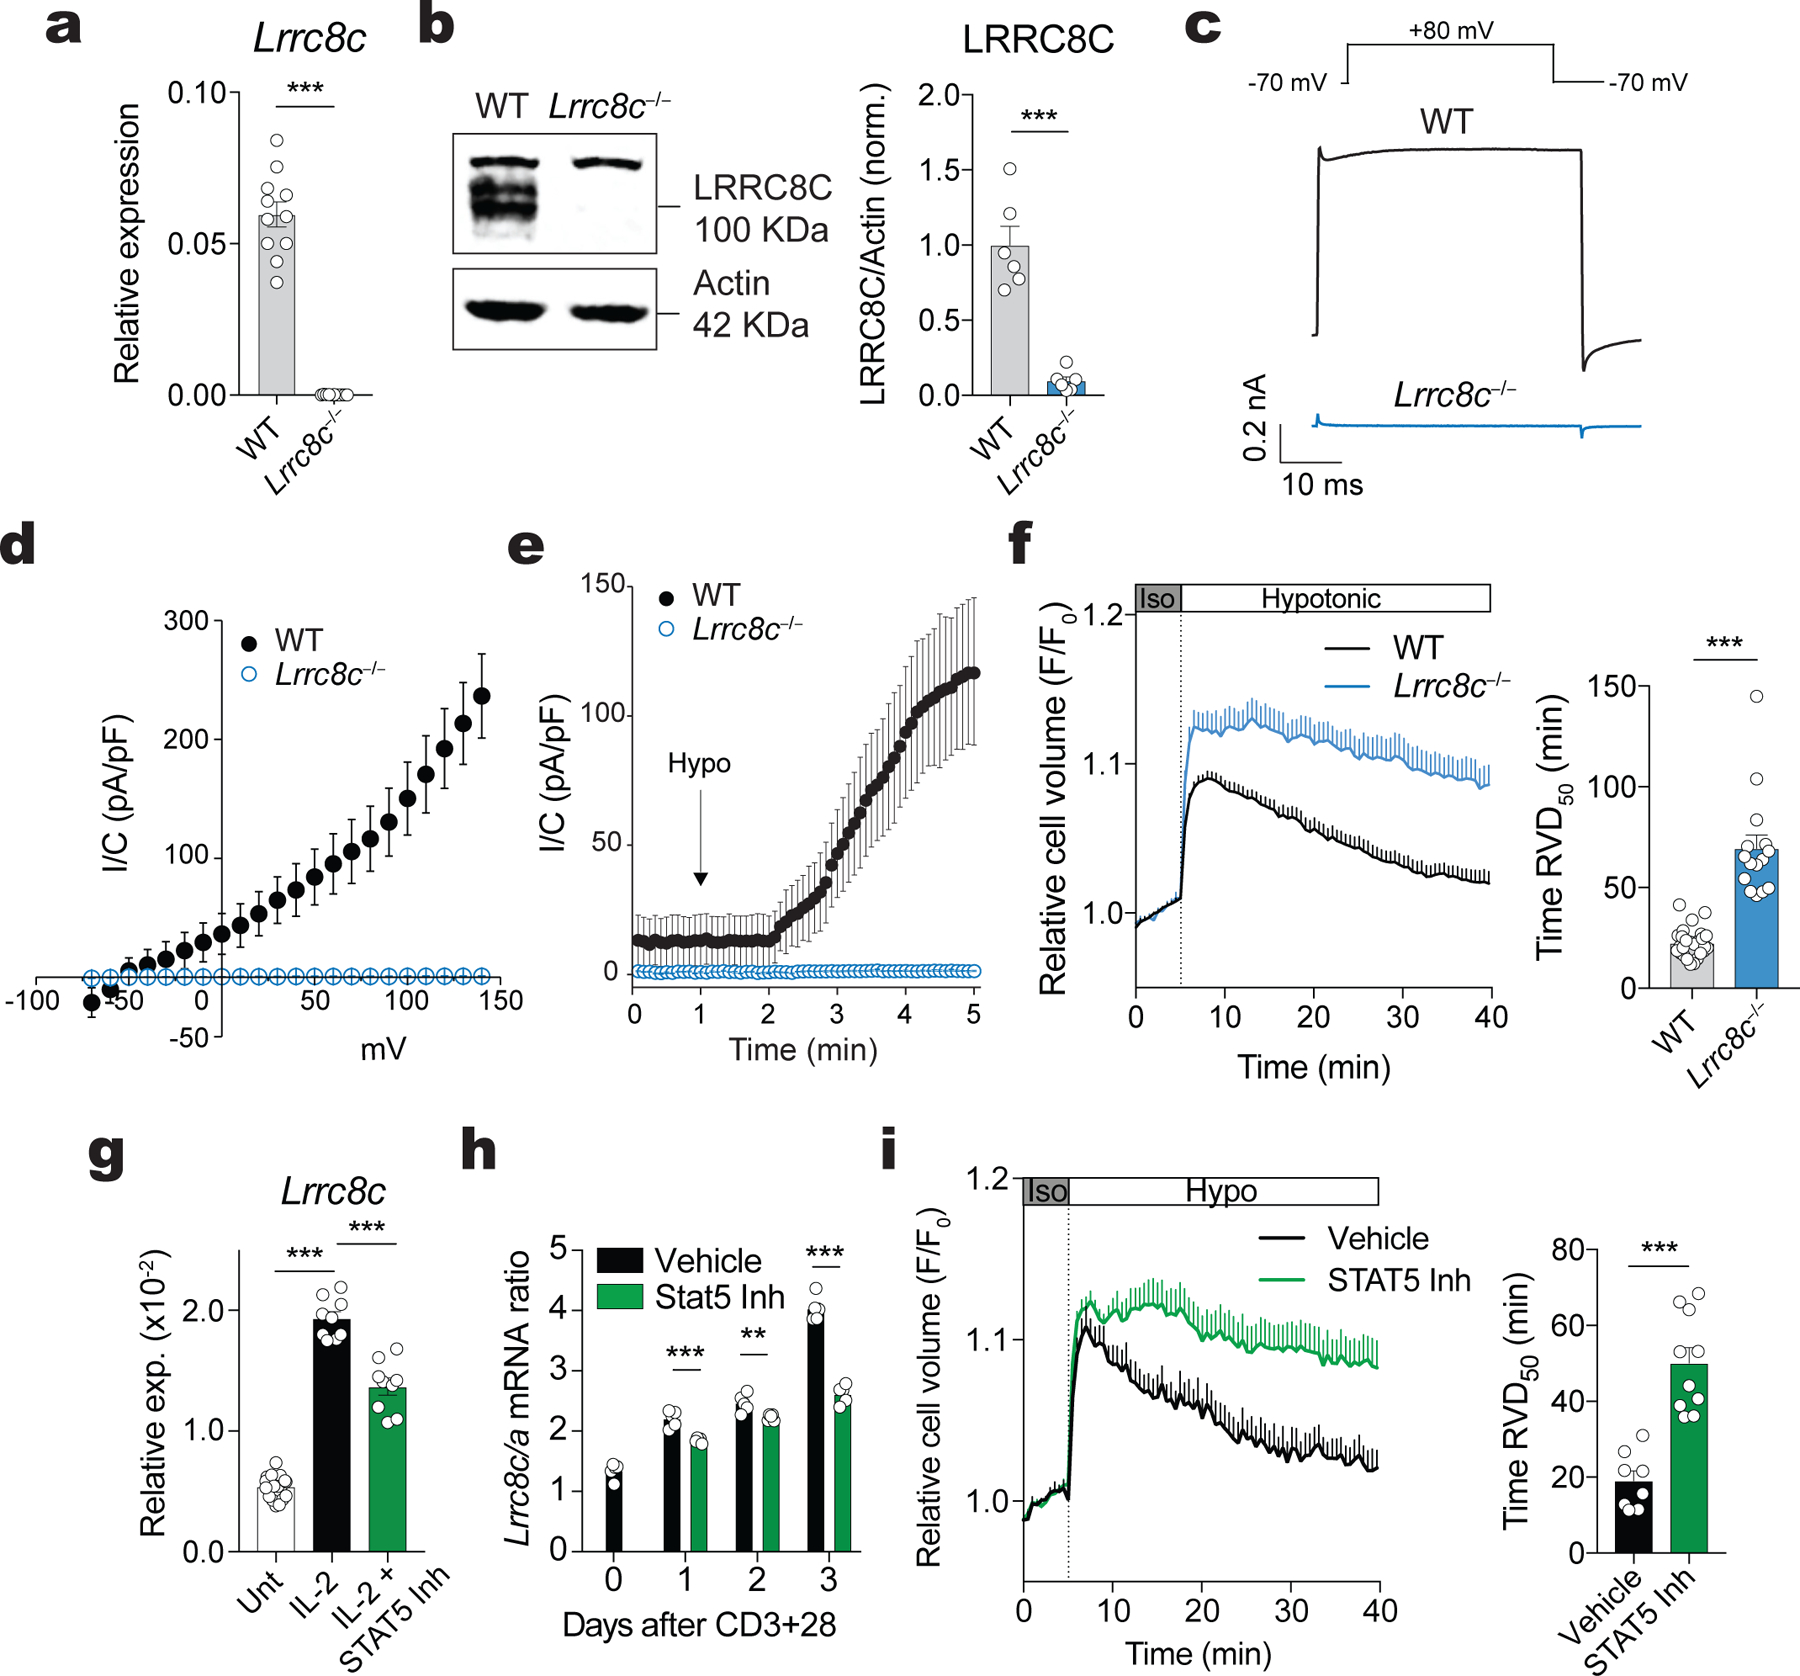
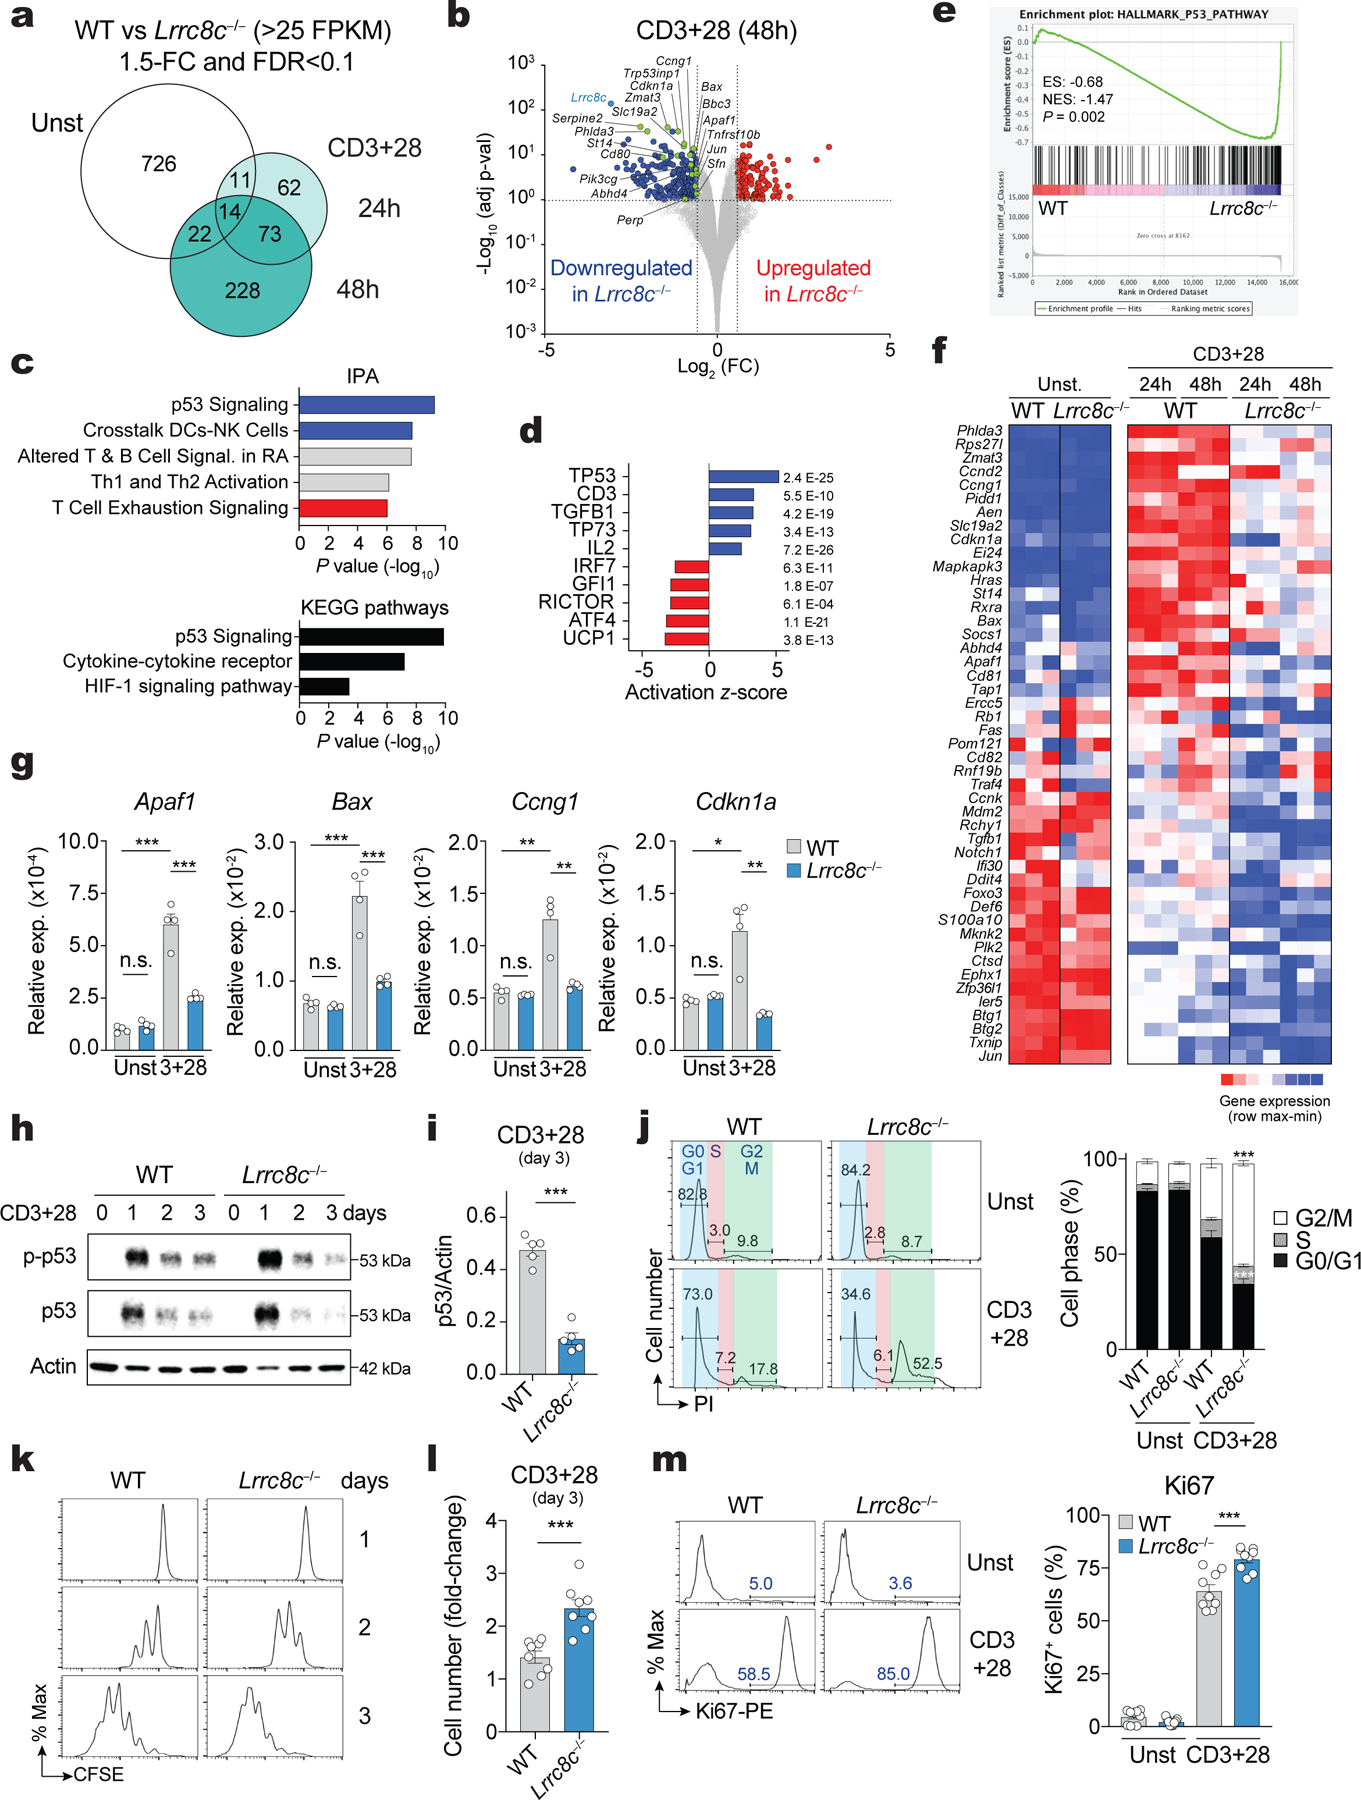
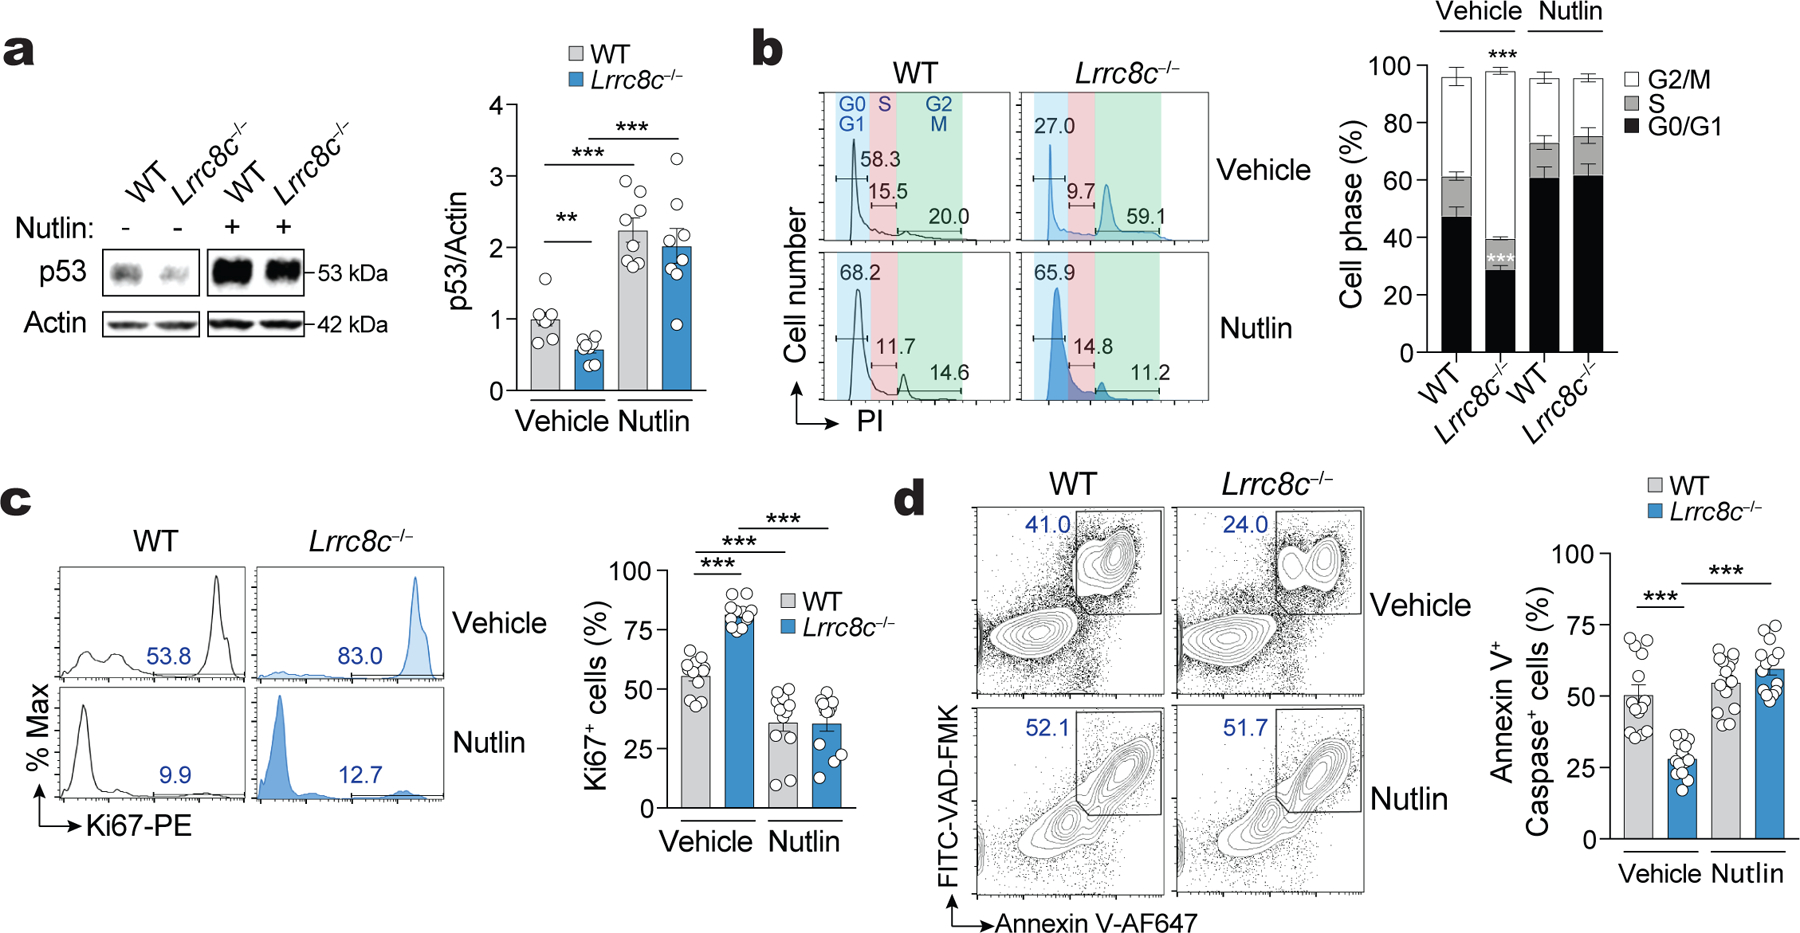
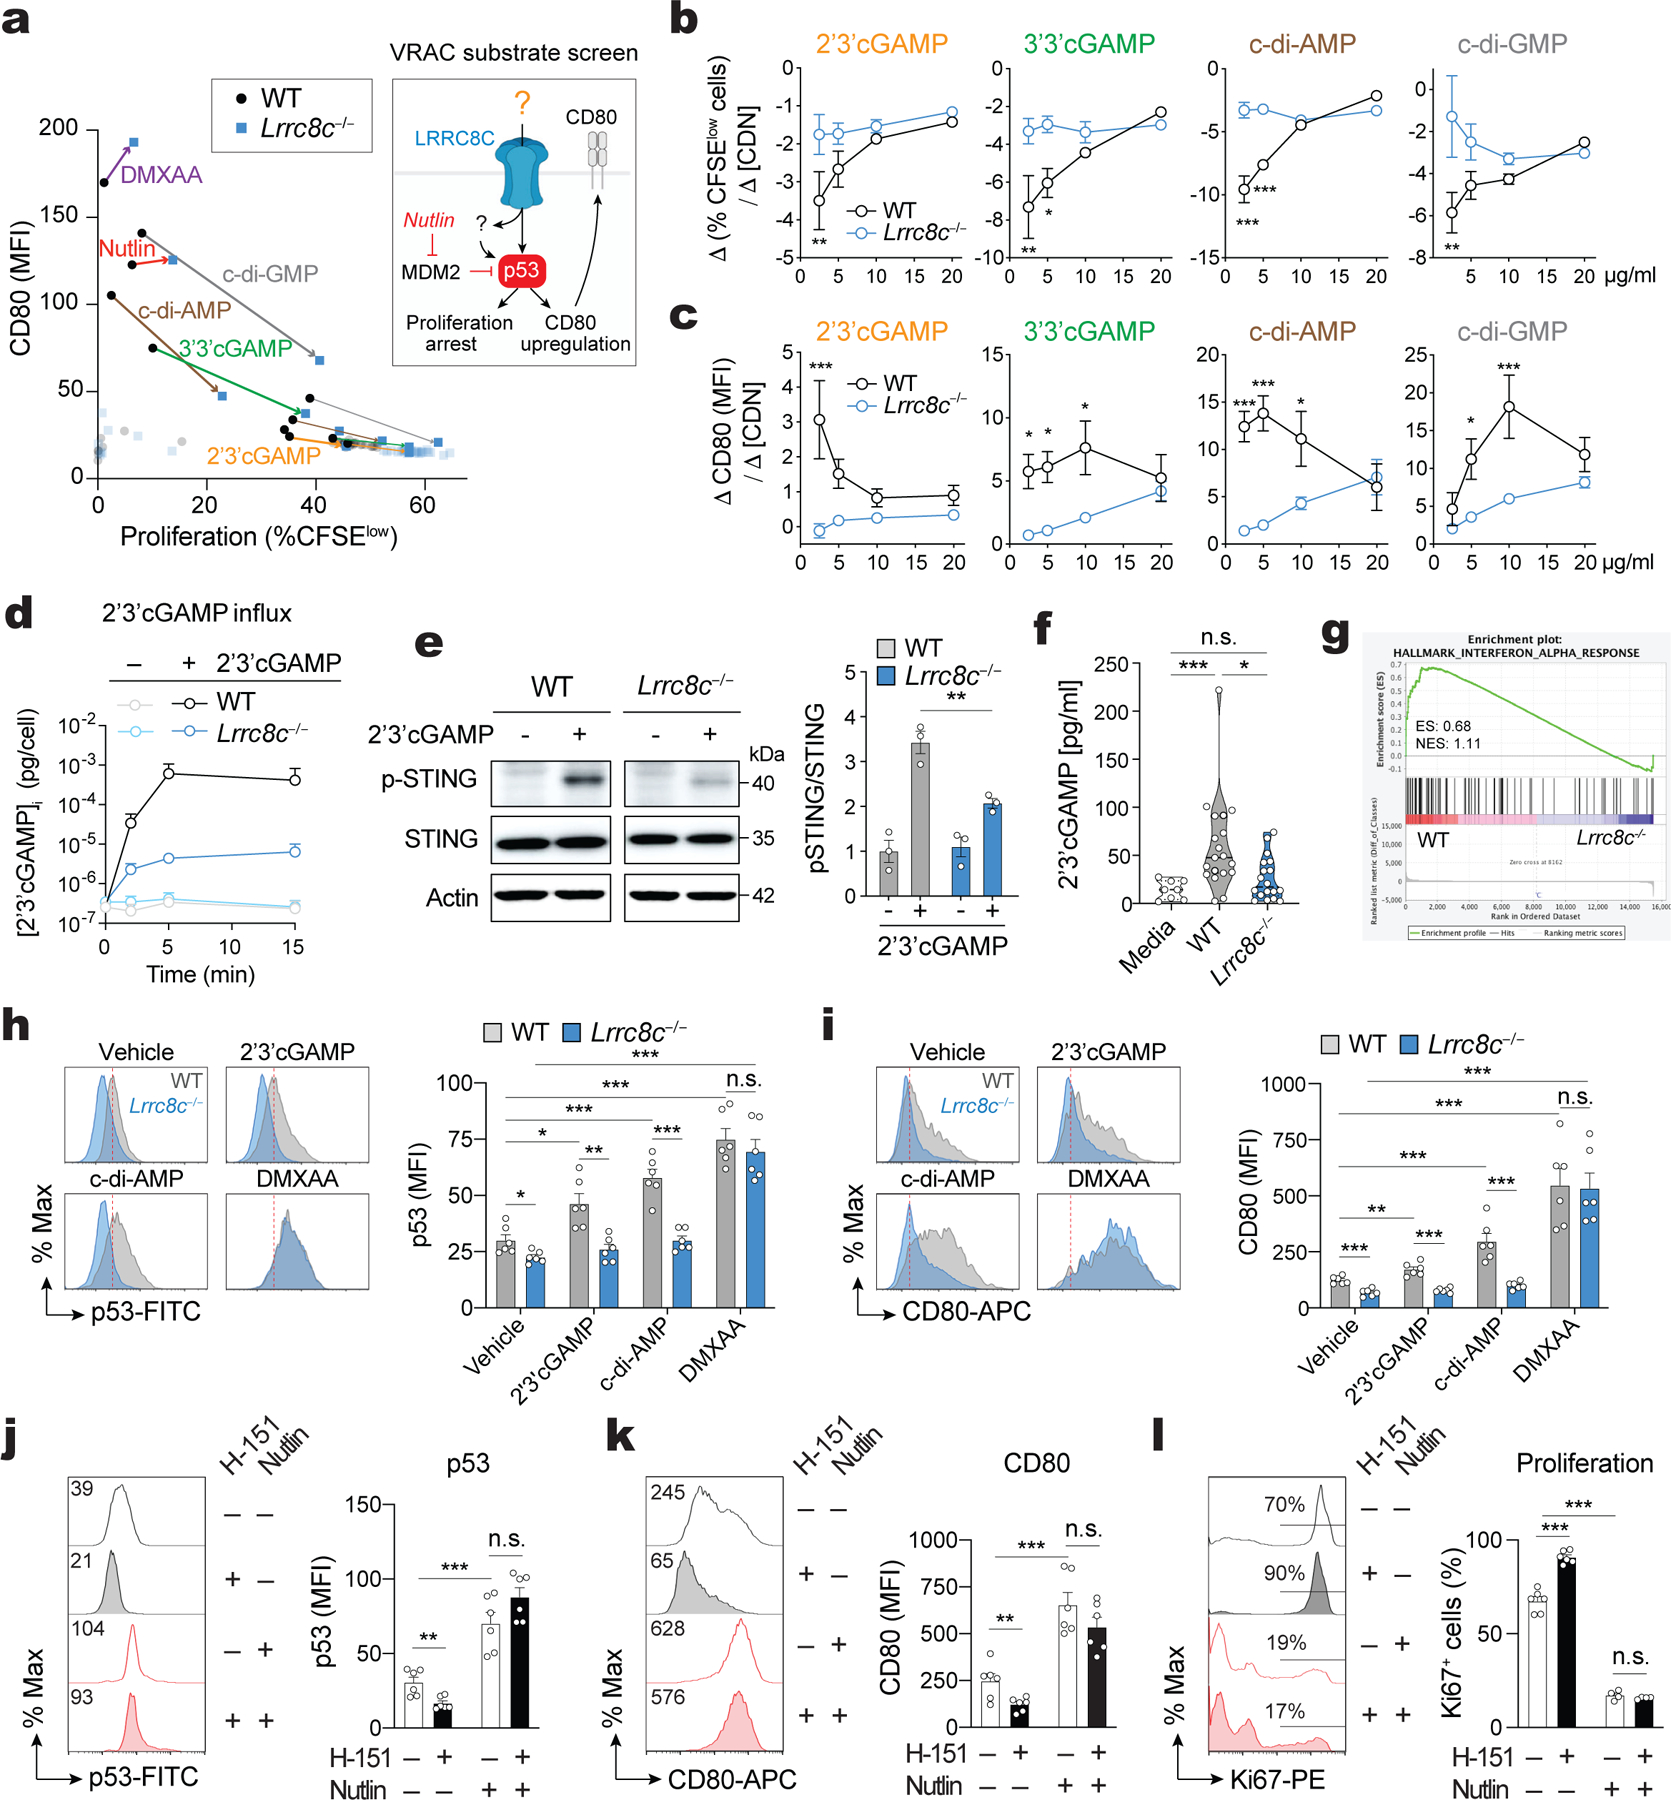
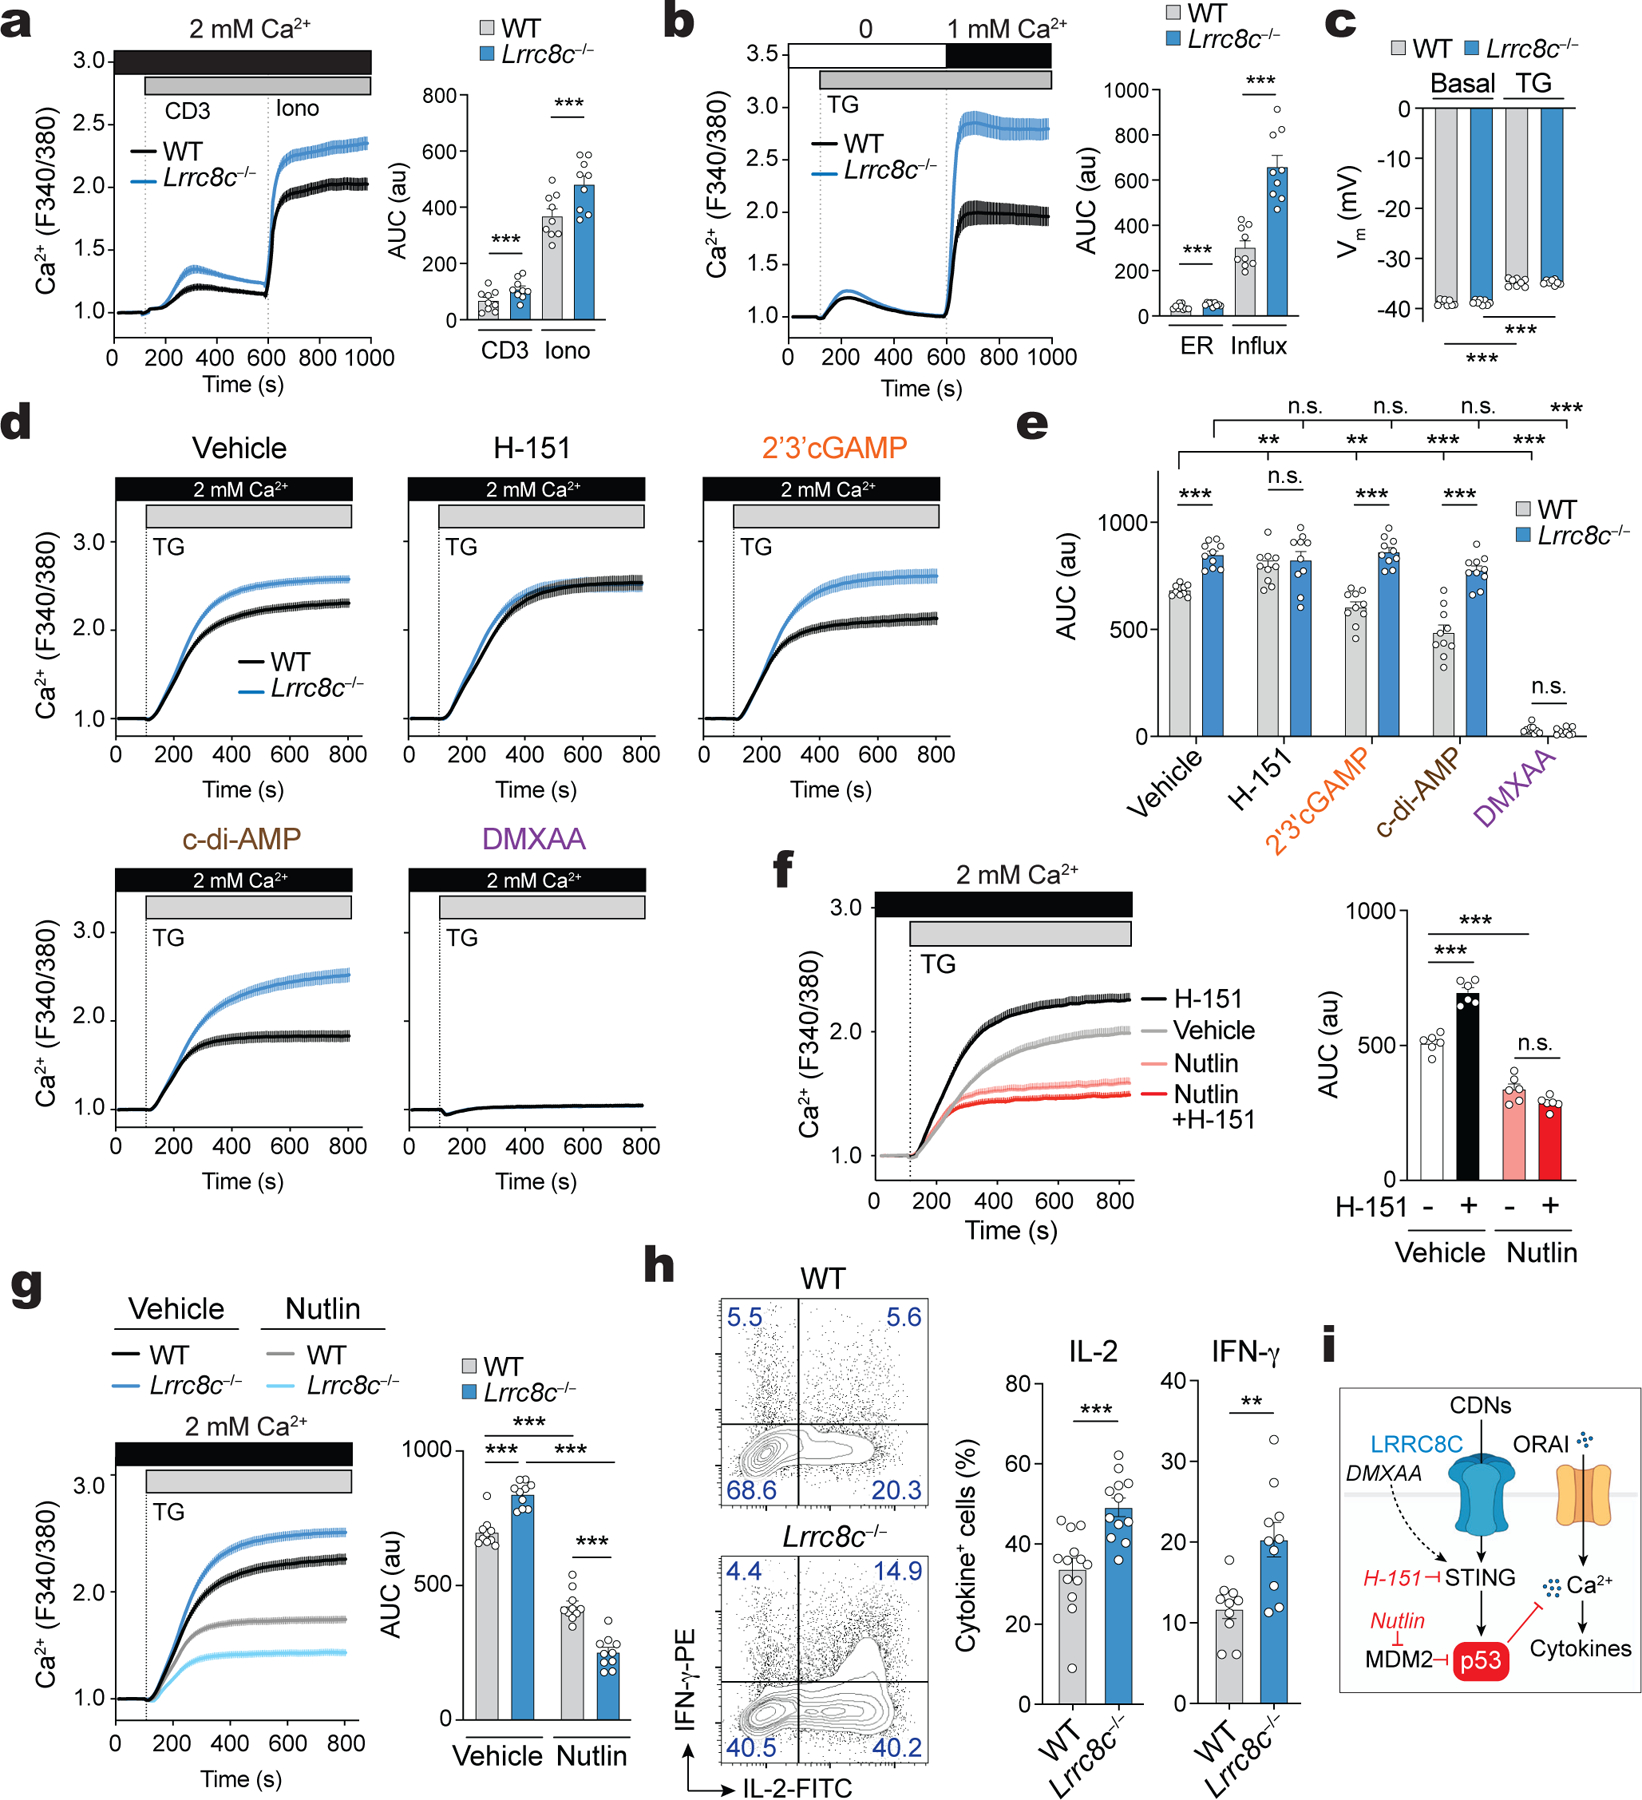
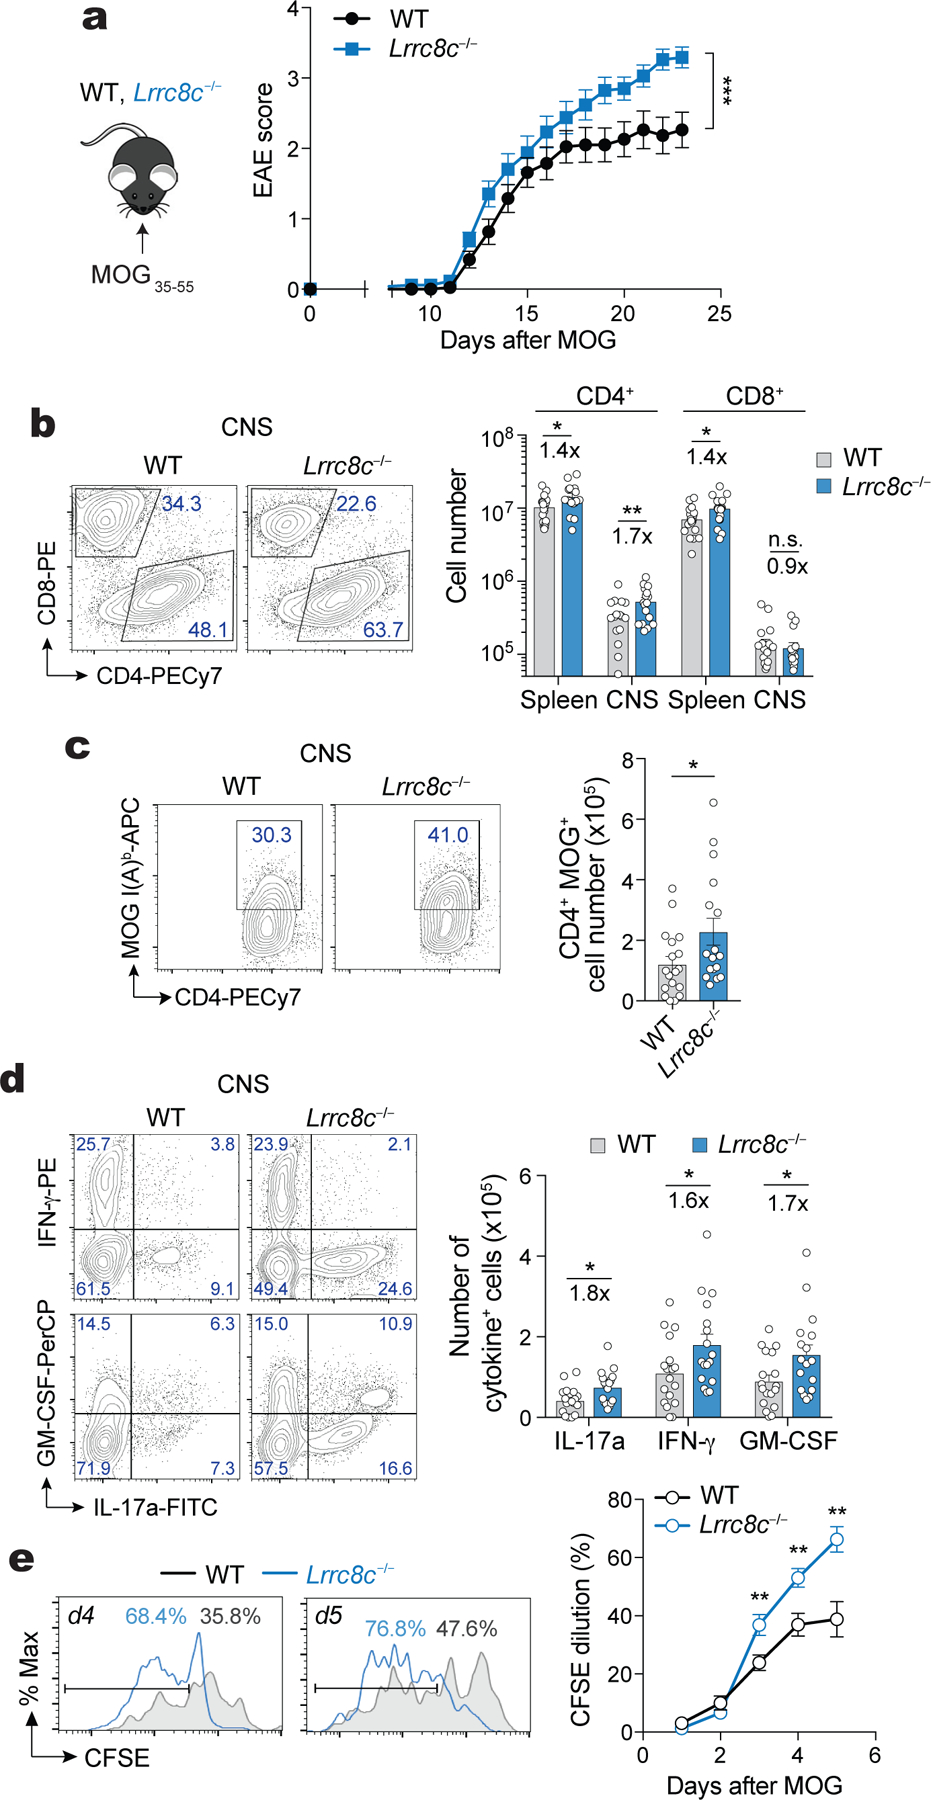
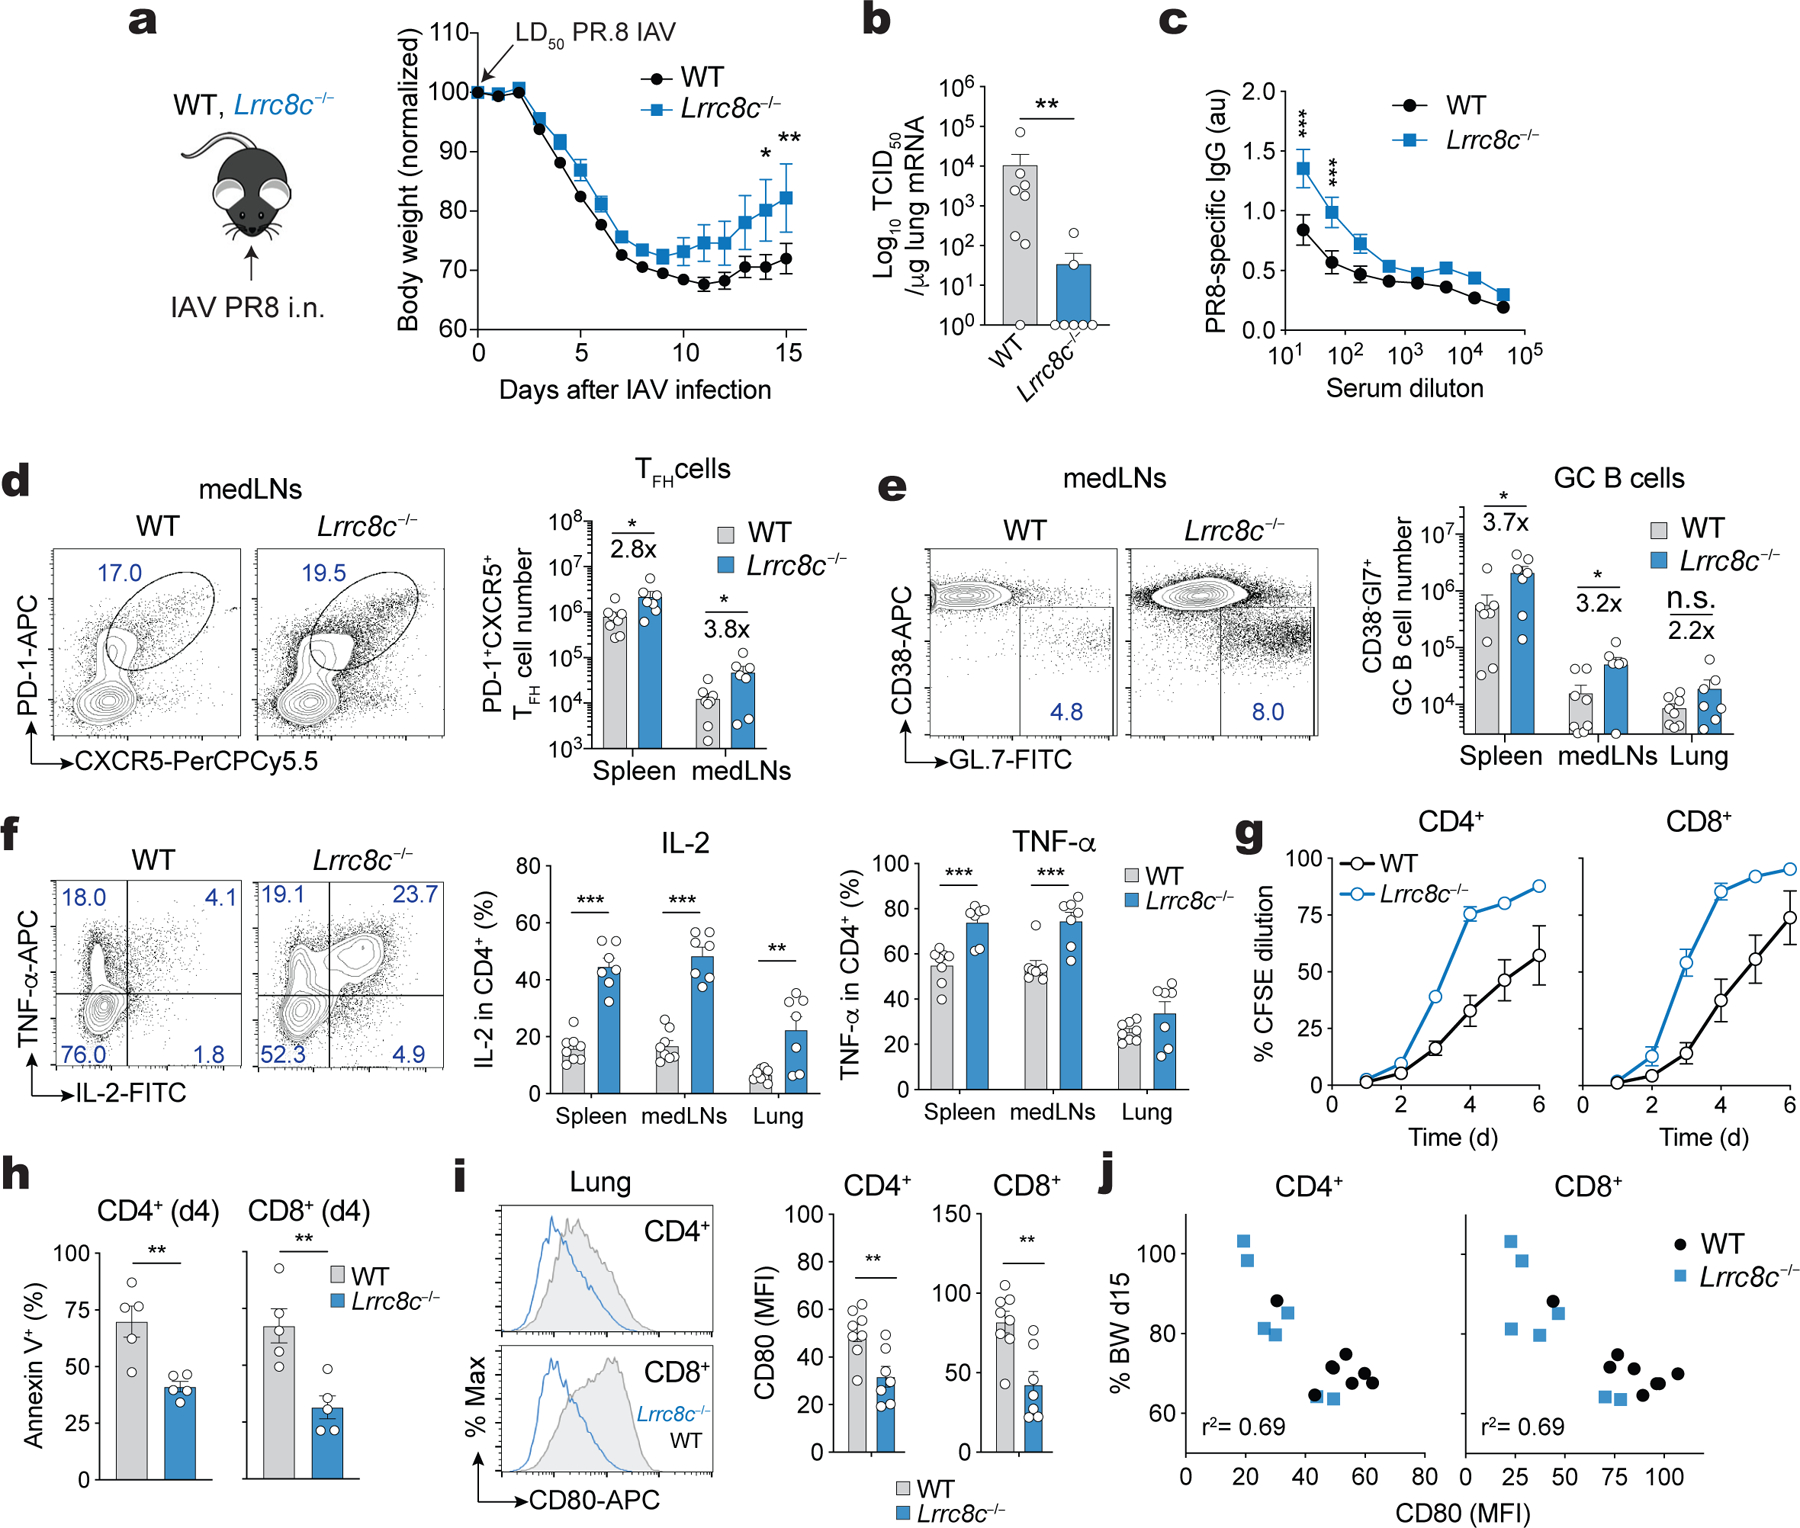
The volume-regulated anion channel (VRAC) is formed by LRRC8 proteins and is responsible for the regulatory volume decrease (RVD) after hypotonic cell swelling. Besides chloride, VRAC transports other molecules, for example, immunomodulatory cyclic dinucleotides (CDNs) including 2'3'cGAMP. Here, we identify LRRC8C as a critical component of VRAC in T cells, where its deletion abolishes VRAC currents and RVD. T cells of Lrrc8c-/- mice have increased cell cycle progression, proliferation, survival, Ca2+ influx and cytokine production-a phenotype associated with downmodulation of p53 signaling. Mechanistically, LRRC8C mediates the transport of 2'3'cGAMP in T cells, resulting in STING and p53 activation. Inhibition of STING recapitulates the phenotype of LRRC8C-deficient T cells, whereas overexpression of p53 inhibits their enhanced T cell function. Lrrc8c-/- mice have exacerbated T cell-dependent immune responses, including immunity to influenza A virus infection and experimental autoimmune encephalomyelitis. Our results identify cGAMP uptake through LRRC8C and STING-p53 signaling as a new inhibitory signaling pathway in T cells and adaptive immunity.


Conflict of interest statement

Competing interests

S.F. is a cofounder of CalciMedica; the other coauthors declare no conflict of interest.

Figures

Extended Data Figure 1.
Extended Data Figure 1.. Transcriptomic analysis of the ion channelome in immune cells identifies LRRC8C and other specific ICTs in T cells.
(a) Correlation analysis of ICT genes in CD4+ T cells from mouse ImmGen RNA-Seq and human Fantom5 CAGE-Seq databases. 148 ICTs are highly expressed in both human and mouse T cells (red quadrant). (b) Correlation analysis of 148 highly expressed ICT genes in CD4+ T cells and other immune cells from mouse ImmGen RNA-Seq. ICT genes on the bottom right (grey triangle) are 2-fold higher expressed in CD4+ T cells compared to other immune cells. CD4-specific ICT genes highlighted in blue are shared in both mouse ImmGen and Haemopedia datasets, and red are shared in ImmGen, Haemopedia, and human Fantom5 datasets. (c) Correlation analysis of ICT genes in mouse CD4+ T cells from ImmGen RNA-Seq and Haemopedia RNA-Seq databases. Most specific ICTs are highlighted in red and known ICTs to play a role in T cells shared in both mouse ImmGen and Haemopedia datasets are highlighted in blue. (d,e) Expression profile of differentially expressed ICTs in CD4+ T cells from (d) Haemopedia RNA-Seq and (e) Fantom5 CAGE-Seq databases. Color coding: high (red) and low (blue) relative mRNA expression per row.
Extended Data Figure 2.
Extended Data Figure 2.. VRAC channels in mouse T cells are composed by LRRC8C and LRRC8A.
(a) Relative expression of Lrrc8a and Lrrc8c mRNA from CD4+ T cells transduced with shRNAs targeting Lrrc8a, Lrrc8c, or both Lrrc8a/c, and measured by RT-qPCR 3 days after transduction. shRNA targeting non-mammalian gene Renilla Luciferase (Ren.713) was used as shControl. Gapdh mRNA was used as housekeeping control and relative expression was normalized to shControl. Data are the mean ± s.e.m. from 6 independent experiments and mice (representing 15, 6, 6 and 7 transductions of T cells with shControl, shLrrc8a, shLrrc8c, and shLrrc8a/c, respectively). (b-e) Volume-regulated anion currents (IVRAC) from CD4+ T cells transduced with shRNAs. (b) IVRAC from T cells shown in (a) and measured by patch clamping in whole-cell configuration (representative traces from at least 6 cells per shRNA from 2 independent experiments). Recording protocol (top): T cells were held at −70 mV and were depolarized to +80mV every 5s in hypotonic solution (~215 mOsm). Current densities as a function of voltage (c) and extracted at +80 mV (d) at the end of each test pulse from experiment shown in (b). (e) Average current densities at −70 mV and +80 mV over time induced by hypotonic (Hypo) solution (applied at the arrow) in shRNA transduced CD4+ T cells (mean ± s.e.m., 6–10 cells per shRNA from 2 independent experiments). Unapparent error bars are smaller than symbols. (f,g) RVD traces (f) and quantification of maximum peak, area under the curve (AUC) and time to RVD50 (g) in CD4+ T cells transduced with shRNAs and subjected to hypoosmotic swelling. Data are the mean ± s.e.m. from 23, 18, 16 and 7 traces for shControl, shLrrc8a, shLrrc8c, and shLrrc8a/c, respectively, and pooled from 3 independent experiments. Statistical analysis by two-tailed, unpaired Student’s t test in (a and g), and one-way ANOVA with Dunnett’s multiple comparisons test in (d). Not significant (n.s.) P > 0.05, **P<0.01 and ***P<0.001.
Extended Data Figure 3.
Extended Data Figure 3.. Lrrc8c−/− mice have normal T cell development.
(a-d) Cell numbers and proportion of thymocytes from WT and Lrrc8c−/− mice. (a) Absolute cell numbers, (b) representative flow cytometry plots showing the proportion (c) and numbers (d) of thymocyte subsets DN1, DN2, DN3, DN4, DP, SP4+ and SP8+ cells. (e-j) Cell numbers and proportion of splenocytes from WT and Lrrc8c−/− mice. (e) Absolute cell numbers, (f) representative flow cytometry plots showing the gating strategy to identify the different subsets of T cells in the spleen from WT and Lrrc8c−/− mice. Proportion and absolute cell numbers of (g) CD3+ T cells, (h) CD4+ and CD8+ T cells, and (i,j) naïve CD44loCD62Lhi, T central memory (TCM) CD44hiCD62Lhi, and T effector memory (TEM) CD44hiCD62Llo T cell subsets in both CD4+ and CD8+ T cells. (k-m) Cell number and proportion of T cells in the lymph nodes (LNs) from WT and Lrrc8c−/− mice. (k) Absolute cell numbers, and proportion and absolute cell numbers of (l) CD3+ T cells, and (m) CD4+ and CD8+ T cells. Data represent mean ± s.e.m. of 9 mice per genotype (a-j) and 7 mice per genotype (k-m), pooled from at least 4 independent experiments.
Extended Data Figure 4.
Extended Data Figure 4.. p53 control the proliferation and survival in T cells.
(a-c) Protein expression of p53 (a), Ki67 (b), and apoptosis determined by annexin V staining (c) in WT and Lrrc8c−/− CD4+ T cells after 3 days of retroviral transduction. Representative flow cytometry plots (left) and quantification (right). Data represent the mean ± s.e.m. of 8 mice per genotype, pooled from 2 independent experiments. (d,e) Protein expression of p53 (d) and Ki67 (e) in CD4+Cas9+ T cells transduced with sgRNAs targeting p53 (Trp53) after 3 days of retroviral infection. Representative flow cytometry plots (left) and quantification (right). Data represent the mean ± s.e.m. of 3 (in d) and 5 (in e) mice, pooled from 2 independents. (f,g) Protein expression of p53 (f) and Ki67 (g) in T cells shown in (d,e) after restimulation for additional 3 days with anti-CD3+28 dynabeads and treated or not with idasanutlin (nutlin). Representative flow cytometry plots (left) and quantification (right). Data represent the mean ± s.e.m. of 3 and 5 mouse donors for sgControl and sgTrp53, respectively, pooled from 2 independents. Statistical analysis by two-tailed, unpaired Student’s t test. *P<0.05 and ***P<0.001.
Extended Data Figure 5.
Extended Data Figure 5.. VRAC inhibitor DCPIB suppresses p53 signaling in activated T cells.
(a) Averaged traces (left) and quantification (right) of RVD (AUC) in CD4+ T cells stimulated with anti-CD3+28 for at least 3 days and subjected to hypotonic solution after treatment for 30 min with 20 μM DCPIB (data are the mean ± s.e.m. of 12 and 20 traces for vehicle and DCPIB treated cells, respectively, pooled from at least 5 independent experiments). (b) IVRAC traces from CD4+ T cells stimulated for 2d with anti-CD3+28 and pre-treated or not with 20 μM DCPIB, measured by patch clamping in whole-cell configuration. Representative traces from 10 cells (vehicle) and 5 cells (DCPIB) from at least 3 independent experiments. Recording protocol (top): T cells were held at −70 mV and were depolarized to +80mV every 5s in hypotonic solution (~215 mOsm). (c) GSEA of RNA-Seq data from WT CD4+ T cells treated or not with 20 μM DCPIB identifies DEGs associated with p53 pathway after anti-CD3+28 stimulation. (d) Venn-diagram showing number of DEGs related to the p53 pathway between WT vs Lrrc8c−/− and WT vs WT + DCPIB CD4+ T cells after anti-CD3+28 stimulation for 1 and 2 days. (e) Heat map of DEGs associated with p53 pathway identified by GSEA in (c). Color coding: high (red) and low (blue) relative mRNA expression per row. DEGs highlighted in red are shared between WT vs WT + DCPIB and WT vs Lrrc8c−/− CD4+ T cells. Statistical analysis in (a) by two-tailed, unpaired Student’s t test. ***P<0.001.
Extended Data Figure 6.
Extended Data Figure 6.. p53 controls CD80 expression in T cells.
(a) CD80 mRNA expression in human T cells from healthy volunteers stimulated with phytohemagglutinin for 3 days and treated with nutlin-3 for 24h. CD80 mRNA expression based on microarray data from GSE110369 (Ref). (b) p53 binding to the CD80 gene locus in human T cells treated as in (a) and analyzed by ChIP-Seq (data source: GSE110368). Representative binding peaks in the CD80 promoter (left) and quantification (right). (c) CD80 expression in CD4+Cas9+ T cells transduced with sgRNAs targeting p53 (Trp53) and restimulated for 3 days with anti-CD3+28 and treated or not with nutlin. Representative flow cytometry plots (left) and quantification (right) of mean fluorescence intensities (MFI) of CD80. Data are from 3 and 5 mice for sgControl and sgTrp53, respectively, pooled from 2 independent experiments. (d) Cd80 mRNA expression in CD4+ T cells of WT or Lrrc8c−/− mice stimulated with anti-CD3/28 for 1 and 2 days. T cells from WT mice were treated or not with DCPIB for the duration of T cell stimulation. mRNA expression based on RNA-Seq data (compare with Fig. 3). Data are from 3 mice per genotype and treatment. (e) CD80 expression in WT and Lrrc8c−/− CD4+ T cells before and after stimulation with anti-CD3+28 for 3 days. Representative flow cytometry plots (left) and quantification (right) from 11 mice per genotype, pooled from 4 independent experiments. (f) CD80 expression in WT CD4+ T cells treated with 20 μM DCPIB for 3 days following anti-CD3+28 stimulation. Representative overlay histograms (left) and quantification (right) of CD80 expression from 6 mice per condition. (g,h) CD80 cell expression in WT and Lrrc8c−/− CD4+ T cells upon stimulation with anti-CD3+28 for 3 days and treated or not with nutlin (in g), or after 3 days of retroviral transduction with empty vector or p53 (in h). Representative flow cytometry plots (left) and quantification (right) of 8 mice per genotype, pooled from 4 and 2 independent experiments in (g) and (h), respectively. All data are mean ± s.e.m. and were analyzed by two-tailed, unpaired Student’s t test (a-c,e,g,h) and by two-tailed, paired t test (f). Not significant (n.s.) P > 0.05, *P<0.05, **P<0.01 and ***P<0.001.
Extended Data Figure 7.
Extended Data Figure 7.. Activation of STING in T cells depends on the channel function of LRRC8C.
(a,b) Compound screening to identify substrates for LRRC8C in T cells. Flow cytometry analysis showing (a) the CFSE dilution and (b) CD80 surface expression of CD4+ T cells stimulated for 2 days with anti-CD3+28 dynabeads and treated with 19 different substrates known to be transported by VRAC channels. The concentration of tested compounds is: 3 and 10 μg/ml for 2’3’cGAMP, 3’3’cGAMP, c-di-AMP, and c-di-GMP; 5 and 10 μg/ml Blasticidin S, 0.1 and 1 μM sphingosine 1-phosphate (S1P), 1 and 10 μM bradykinin acetate, 50 and 100 μM cisplatin, 100 and 200 μM folic acid, 100 and 500 μM GABA, myo-inositol and thiamine hydrochloride; 250μM and 1 mM ATP, D-glutamic acid, taurine, D-lysine, D-aspartic acid, D-serine; 500μM and 1 mM D-sorbitol. The concentration of positive controls that lack requirement for VRAC transport are: 3 μg/ml DMXAA, 1 μM staurosporine (STS), and 5 μM idasanutlin (Nutlin). Data are from 4 mice per genotype, pooled from 2 independent experiments. Area highlighted in light grey represents unstimulated conditions. (c,d) Dose-dependent effects of CDNs on (c) proliferation measured by CFSE dilution and (d) CD80 expression in WT and Lrrc8c−/− CD4+ T cells stimulated for 2 days with anti-CD3+28. Data are from 6 mice per genotype and treatment, pooled from 3 independent experiments. (e) Immunoblots of total and p-STING (S366) protein in WT and Lrrc8c−/− CD4+ T cells activated for 2 days with anti-CD3+28 and treated with 3 μg/ml DMXAA at the indicated time points. Actin was used as loading control. Representative blot (top) and quantification (bottom) from at least 2 independent experiments. (f) Intracellular concentration of 2’3’ cGAMP in T cells stimulated with anti-CD3+28 for 12–72 hours and measured by ELISA. Data are from 6 (unstimulated) and 12 (stimulated) T cell samples, pooled from 12 mice per genotype and 2 independent experiments. (g) GSEA of RNA-Seq data from WT, Lrrc8c−/−, and WT + DCPIB-treated CD4+ T cells identifies DEGs associated with TNF-α signaling via NFκB pathway after anti-CD3+28 stimulation. (h) Venn-diagram showing number of DEGs related to the TNF-α signaling via NFκB pathway between WT vs. Lrrc8c−/− and WT vs. WT + DCPIB CD4+ T cells after anti-CD3+28 stimulation for 1 and 2 days. All data are the mean ± s.e.m. and were analyzed by two-tailed, unpaired Student’s t test. Not significant (n.s.) P > 0.05, *P<0.01, **P<0.01 and ***P<0.001.
Extended Data Figure 8.
Extended Data Figure 8.. Inhibition of STING increases proliferation and decreases apoptosis, p53 and CD80 expression in T cells.
(a-c) Immunoblots of total and phospho-STING (S366) protein expression in WT CD4+ T cells activated for 2 days with anti-CD3+28 and treated or not with the STING inhibitor H-151. Cell were stimulated with 10 μg/ml 2’3’cGAMP (a), 5 μg/ml c-di-AMP (b) or 3 μg/ml DMXAA (c) for 3–6 hours. Actin was used as loading control. Representative blots (left) and quantification (right) of at least 3 independent experiments and 4, 3, and 5 mice for 2’3’cGAMP, c-di-AMP, and DMXAA treatment, respectively. (d-g) Flow cytometry analysis of Ki67 expression (d), apoptosis measured by annexin V and active caspase (e), p53 (f), and CD80 expression (g) in WT CD4+ T cells stimulated for 3 days with anti-CD3+28 and treated or not with STING agonists and pre-treated or not with the STING inhibitor H-151. Representative flow cytometry plots (left) and quantification (right) of at least 6 mice per treatment, pooled from 4–6 independent experiments and shown as mean ± s.e.m. (h) Correlation analysis of CD80 and p53 expression in T cells stimulated and treated as shown in (f,g). Statistical analysis in (a-g) by two-tailed, unpaired Student’s t test. **P<0.01 and ***P<0.001. ##P < 0.01 and #P<0.001 between STING agonists vs. vehicle untreated.
Extended Data Figure 9.
Extended Data Figure 9.. Deletion of p53 protects T cells from STING-mediated proliferation arrest.
(a) Immunoblots of STING in CD4+Cas9+ T cells transduced with sgRNAs targeting STING and p53 at 4 days after retroviral infection. Actin was used as loading control. Representative blots (left) and quantification (right) represented as the mean ± s.e.m. of n = 3 mice and 2 independent experiments. (b) CD80 expression in CD4+Cas9+ T cells transduced with sgRNAs targeting STING and p53, restimulated for 2 days with anti-CD3+28 dynabeads and treated or not (vehicle) with 3 μg/ml DMXAA. Representative flow cytometry plots (left) and quantification (right). Data represent the mean ± s.e.m. of at least 3 mice, pooled from 2 independent experiments. (c) CFSE dilution in CD4+Cas9+ T cells transduced with sgRNAs targeting STING and p53, restimulated for 3 days with anti-CD3+28 dynabeads and treated or not (vehicle) with STING agonists and idasanutlin (nutlin). Representative flow cytometry plots (left) and quantification (right) of the frequency of proliferating cells. Data represent the mean ± s.e.m. of 3–5 mice, pooled from 2 independent experiments. Statistical analysis by two-tailed, unpaired Student’s t test (a,b) and 2-way ANOVA with Dunnett’s multiple comparisons test (c). Not significant (n.s.) P > 0.05, *P<0.05, **P<0.01 and ***P<0.001. #P<0.001 between treatment vs vehicle untreated.
Extended Data Figure 10.
Extended Data Figure 10.. LRRC8C-STING-p53 signaling modulates Ca2+ influx in T cells.
(a,b) Cytosolic Ca2+ signals in WT T cells stimulated for 3 days with anti-CD3+28 and treated or not with the STING inhibitor H-151 and STING agonists. T cells were stimulated with thapsigargin (TG) in Ca2+-containing Ringer buffer. Averaged Ca2+ traces (a) and area under the curve (AUC) following TG treatment (b). Data are the mean ± s.e.m. of 6 mice (vehicle, DMXAA, 2’3’cGAMP, 3’3cGAMP) or 4 mice (c-di-AMP, c-di-GMP) pooled from 2–3 independent experiments. (c) Cytosolic Ca2+ signals in WT and Lrrc8c−/− T cells 3 days after retroviral transduction with p53 using a similar protocol as in (a). Averaged Ca2+ traces (left) and quantification of the AUC (right) following TG treatment. Data are the mean ± s.e.m. of 4 mice per genotype and treatment, pooled from 2 independent experiments. (d) Cytosolic Ca2+ signals in CD4+Cas9+ T cells transduced with sgRNAs targeting STING and p53 three days after retroviral transduction using a similar protocol as in (a). Averaged Ca2+ traces (left) and quantification of the AUC (right) after TG treatment. Data are the mean ± s.e.m. of 3 mice pooled from 2 independent experiments. Statistical analysis by two-tailed, unpaired Student’s t test. Not significant (n.s.) P > 0.05, **P<0.01 and ***P<0.001. #P<0.001 between treatment vs vehicle untreated.
Figure 1.
Figure 1.. LRRC8C is selectively expressed in T cells.
(a) 3D-PCA analysis of ion channels and transporters (ICT) and their regulators using murine immune cell RNA-Seq data (ImmGen). (b) Venn-diagram showing ICTs highly expressed in human and mouse CD4+ T cells. (c) Expression profile of the differentially expressed ICTs in murine CD4+ T cells (ImmGen). Heat map shows relative expression (red, high; blue, low). Bar graphs on the right show absolute gene expression. (d) Expression of Lrrc8a-e genes from different cell types and tissues (BioGPS). Heat map shows absolute mRNA expression (red, high; blue, low). Lrrc8b expression data was not available in BioGPS. (e) Proportion of Lrrc8a-e gene expression in mouse CD4+ T cells from Haemopedia RNA-Seq database (left) and validated by RT-qPCR (middle), and human CD4+ T cells from Fantom5 database (right). (f) Lrrc8b-e/Lrrc8a mRNA expression ratio from mouse CD4+ T cells upon stimulation with anti-CD3+CD28 and measured by RT-qPCR (n=5 independent experiments). (g) Cell volume measurements in unstimulated and stimulated CD4+ T cells upon challenge with hypotonic buffer (215 mOsm). Cell volume traces (top) are the mean ± s.e.m. from 13 and 15 independent experiments per unstimulated and stimulated conditions, respectively. The regulatory volume decrease (RVD) is quantified (bottom) as the time to reach half maximal cell volume (RVD50). Data are pooled from 5 independent experiments. Statistical analysis by two-tailed, unpaired Student’s t test. *** P<0.001. (h) Number of genes co-expressed with Lrrc8 genes (BioGPS). (i) Distribution of all murine genes based on their co-expression coefficient (Pearson’s r) relative to Lrrc8c (BioGPS). Genes linked to IL-2/STAT5 signaling highlighted in red are significantly enriched among the co-expressed genes. (j,k) Kyoto Encyclopedia of Genes and Genomes (KEGG) pathway analysis (j) and significant hallmark gene sets (Molecular Signatures Database, in k) of genes co-expressed with Lrrc8c from panel (h). Arrow indicates that Lrrc8c belongs to the IL-2/STAT5 signaling pathway. (l) In silico analysis of Lrrc8c gene locus for chromatin accessibility in activated T cells from wild-type and Stat5a-Stat5b double knock-in (DKI) mice measured by DNA binding of STAT5A and STAT5B before and after treatment with IL-2 for 1h. (m) Lrrc8c/Lrrc8a mRNA expression ratio in wild-type and Stat5a-Stat5b DKI CD8+ T cells before and after re-stimulation with IL-2 or IL-15 (RNA-Seq data from ref.).
Figure 2.
Figure 2.. LRRC8C is an essential component of the VRAC channel in T cells.
(a) Expression of Lrrc8c (exon 4) mRNA in unstimulated CD4+ T cells from wild-type and Lrrc8c−/− mice and measured by RT-qPCR (n=11 mice/genotype). Gapdh mRNA was used as housekeeping control. (b) Representative Western blot (left) and quantification of LRRC8C protein (right) in wild-type and Lrrc8c−/− CD4+ T cells (n=6 mice/genotype). Actin was used as loading control. (c) Representative volume-regulated anion current (IVRAC) traces from wild-type and Lrrc8c−/− CD4+ T cells stimulated with anti-CD3+CD28 and measured using whole-cell patch clamp recordings (n=10 wild-type and 33 Lrrc8c−/− T cells, 3 independent experiments). T cells were bathed in hypotonic solution (~215 mOsm) and held at −70 mV, followed by depolarization to +80mV every 5s. (d) Current density as a function of voltage at the end of each test pulse from experiments similar to that shown in (c). (e) Average current densities at −70 mV and +80 mV over time induced by hypotonic (Hypo) solution in wild-type and Lrrc8c−/− CD4+ T cells. Data in (d-e) are from 10 wild-type and 33 Lrrc8c−/− T cells from 3 independent experiments. (f) Cell volume measurements in wild-type and Lrrc8c−/− CD4+ T cells stimulated with anti-CD3+CD28 and challenged with hypotonic buffer (215 mOsm). Cell volume traces (left) are from 3 independent experiments and n=5 mice/genotype. The regulatory volume decrease (RVD) is quantified (right) as the time to reach half maximal cell volume (RVD50). (g) mRNA expression of Lrrc8c from activated CD4+ T cells and re-stimulated or not with 20 IU/ml IL-2 in the presence or absence of STAT5 inhibitor for 24h, and measured by RT-qPCR. Gapdh mRNA was used as housekeeping control (n=3 mice/treatment, done in triplicates and pooled from 3 independent experiments). (h) Lrrc8c/Lrrc8a mRNA expression ratio in CD4+ T cells stimulated with anti-CD3+CD28 in the presence or absence of STAT5 inhibitor (n=5 mice and 3 independent experiments). (i) RVD measurements (left) and quantification of RVD50 (right) in CD4+ T cells stimulated with anti-CD3+CD28 with and without STAT5 inhibitor as described in (f). Each dot represents one trace pooled from 5 mice and 3 independent experiments. All data are mean ± s.e.m. and were analyzed by two-tailed, unpaired Student’s t test. **P < 0.01 and ***P < 0.001.
Figure 3.
Figure 3.. LRRC8C regulates p53 expression in T cells.
(a) Differentially expressed genes (DEG) between wild-type and Lrrc8c−/− CD4+ T cells before and after anti-CD3+CD28 stimulation and analyzed by RNA-seq. (b) Scatterplot of fold-change in gene expression (log2 FC) vs. adjusted p-value (−Log10) between wild-type and Lrrc8c−/− CD4+ T cells after anti-CD3+CD28 stimulation. Blue and red dots indicate downregulated and upregulated genes in Lrrc8c−/− T cells, respectively. Green dots indicate DEGs belonging to the p53 pathway. (c) IPA and KEGG pathways of DEGs in stimulated Lrrc8c−/− CD4+ T cells and ranked by P-value. (d) Top-5 upstream regulators that are inhibited (blue) or activated (red) in Lrrc8c−/− compared to wild-type CD4+ T cells after anti-CD3+CD28 stimulation and ranked by activation z-score. (e) GSEA showing enrichment in p53 pathway genes comparing transcriptomes of Lrrc8c−/− and wild-type CD4+ T cells after anti-CD3+CD28 stimulation. (f) Heat map of DEGs associated with the p53 pathway identified by GSEA in (e). Relative mRNA expression/row (red, high; blue, low). (g) mRNA expression of proapoptotic and cell cycle arrest genes in wild-type and Lrrc8c−/− CD4+ T cells before and after stimulation with anti-CD3+CD28 and measured by RT-qPCR. Rlp32 mRNA was used as housekeeping control (n=4 mice per genotype). (h) Immunoblot of total and phosphorylated p53 (p-p53 S15) in wild-type and Lrrc8c−/− CD4+ T cells before and after stimulation with anti-CD3+CD28. Actin was used as loading control. (i) Quantification of p53 expression in wild-type and Lrrc8c−/− CD4+ T cells stimulated for 3 days and normalized to actin loading control. Data are representative (h) and averaged (i) from n=5 mice/genotype and pooled from 2 independent experiments. (j) Cell cycle analysis of wild-type and Lrrc8c−/− CD4+ T cells before and after stimulation with anti-CD3+CD28. Representative flow cytometry plots (left) and quantification (right) of different cell cycle phases (n=6 and 8 mice/genotype for unstimulated and stimulated conditions, respectively). (k) CFSE dilution in wild-type and Lrrc8c−/− CD4+ T cells stimulated with anti-CD3+CD28. (l) Fold-change of CD4+ T cell numbers from (k) 3 days after anti-CD3+CD28 stimulation (compared to day 1, n=8 mice/genotype). (m) Ki67 expression in wild-type and Lrrc8c−/− CD4+ T cells before and after stimulation with anti-CD3+CD28. Representative flow cytometry plots (left) and quantification (right) of Ki67+ cells (n=9 mice/genotype, pooled from 3 independent experiments). All data are mean ± s.e.m. and were analyzed by two-tailed, unpaired Student’s t test. *P < 0.05, **P < 0.01 and ***P < 0.001.
Figure 4.
Figure 4.. LRRC8C regulates T cell function through p53.
(a) Immunoblots of total p53 expression in wild-type and Lrrc8c−/− CD4+ T cells after stimulation with anti-CD3+CD28 for 3 days in the presence and absence of the MDM2 antagonist idasanutlin (abbreviated as nutlin). Actin was used as loading control. Representative blots (left) and quantification (right) from 4 independent experiments and 8 mice per genotype and treatment. (b) Cell cycle analysis of wild-type and Lrrc8c−/− CD4+ T cells after stimulation for 3 days in the presence or absence of nutlin. Representative flow cytometry plots (lefts) and quantification (right) of the different cell cycle phases. Data are from 12 mice per genotype and treatment, and pooled from 5 independent experiments. (c) Ki67 expression in wild-type and Lrrc8c−/− CD4+ T cells stimulated for 3 days and treated or not with nutlin. Representative flow cytometry plots (left) and quantification (right) of Ki67+ cells from 12 mice per genotype pooled from 5 independent experiments. (d) Apoptotic T cells from wild-type and Lrrc8c−/− mice measured by annexin V and active caspase (VAD-FMK) staining 3 days after stimulation and treated or not with nutlin. Representative contour plots (left) and quantification (right) of apoptotic cells from 14 mice per genotype pooled from 5 independent experiments. All data are mean ± s.e.m. and were analyzed by two-tailed, unpaired Student’s t test. **P < 0.01 and ***P < 0.001.
Figure 5.
Figure 5.. LRRC8C mediates cyclic dinucleotide transport, STING activation and p53 signaling.
(a) Compound screening to identify substrates of LRRC8C in T cells (Created with BioRender.com). Correlation of CD80 expression and CFSE dilution in wild-type and Lrrc8c−/− CD4+ T cells stimulated for 2 days with anti-CD3/CD28 and treated with different substrates of VRAC channels. Arrows connect wild-type and Lrrc8c−/− T cell samples treated with the same compound at high (thick line) and low (thin line) compound concentrations (n= 4 mice/ genotype, pooled from 2 independent experiments). (b,c) Wild-type and Lrrc8c−/− CD4+ T cells stimulated with anti-CD3/CD28 were treated with increasing concentrations of CDNs and analyzed for cell proliferation and CD80 expression. Graphs show the differences in proliferation (Δ%CFSElow cells, in b) and the differences in CD80 expression (DMFI, in c) between at least three CDN concentrations (Δ[CDN]). Compare with Extended Data Fig. 7c,d (n=6 mice/genotype and treatment, pooled from 3 independent experiments). (d) Intracellular concentration of cGAMP in T cells exposed or not to 5 μg/ml 2’3’cGAMP in hypotonic buffer (~215 mOsm) for 15 min and measured by ELISA (n=10 mice/genotype, pooled from 2 independent experiments). (e) Immunoblots of total and phosphorylated STING (p-STING S366) in wild-type and Lrrc8c−/− CD4+ T cells after treatment with 10 μg/ml 2’3’cGAMP for 6h. Actin was used as loading control. Representative blots (left) and quantification (right) from n=3 mice/genotype and 2 independent experiments. (f) 2’3’cGAMP amount in culture media collected after in vitro stimulation of CD4+ T cells with anti-CD3+CD28 for 1–3 days measured by ELISA (n=6 mice/genotype, pooled from 5 independent experiments). (g) GSEA of RNA-Seq data identifies DEGs associated with IFN-α response in stimulated wild-type but not Lrrc8c−/− CD4+ T cells. (h,i) Flow cytometry analysis of p53 (h) and CD80 expression (i) in wild-type and Lrrc8c−/− CD4+ T cells stimulated with anti-CD3+CD28 and treated or not with STING agonists. Representative flow cytometry plots (left) and quantification (right). Data are from n=6 mice/genotype, pooled from 3 independent experiments. (j-l) Flow cytometry analysis of p53 (j), CD80 (k), and Ki67 (l) expression in wild-type CD4+ T cells stimulated for 3 days with anti-CD3+CD28 and treated or not with H-151 and idasanutlin (nutlin). Representative flow cytometry plots (left) and quantification (right) from n=6 mice/treatment, pooled from 3 independent experiments. All data are mean ± s.e.m. and were analyzed by two-tailed, unpaired Student’s t test. *P < 0.05, **P < 0.01 and ***P < 0.001.
Figure 6.
Figure 6.. LRRC8C modulates Ca2+ influx in T cells via STING and p53 activation.
(a,b) Cytosolic Ca2+ signals in naïve (a) and activated (b) CD4+ T cells isolated from wild-type and Lrrc8c−/− mice. Fura-2-loaded T cells were stimulated by anti-CD3 cross-linking in 2 mM Ca2+ containing Ringer solution followed by ionomycin (Iono) stimulation (in a) or thapsigargin (TG) in Ca2+-free buffer followed by re-addition of extracellular Ca2+ (in b). Averaged Ca2+ traces (left) and quantification of the area under the curve (AUC, right) in the regions indicated by the dotted lines (n=9 mice/genotype, pooled from 3 independent experiments). (c) Plasma membrane potential (Vm) in wild-type and Lrrc8c−/− CD4+ T cells activated with CD3+CD28 and measured by patch-clamping. Gigaohm seals were stablished in isotonic solution in voltage-clamp configuration and cells were treated with TG for at least 5 min before recording Vm (n=8 cells/genotype, pooled from 2 independent experiments). (d,e) Cytosolic Ca2+ signals in wild-type and Lrrc8c−/− T cells stimulated with anti-CD3+CD28 and treated or not with STING agonists. T cells were stimulated with TG in Ca2+-containing Ringer buffer. Averaged Ca2+ traces (d) and quantification of the AUC (e) in the regions indicated by the dotted lines (n=10 mice/genotype, pooled from 5 independent experiments). (f) Cytosolic Ca2+ signals in T cells treated or not with STING inhibitor H-151 and idasanutlin (abbreviated as nutlin) using a similar protocol as in (d). Averaged Ca2+ traces (left) and quantification of the AUC (right) in the regions indicated by the dotted lines (n=6 mice/treatment, pooled from 3 independent experiments). (g) Cytosolic Ca2+ signals in wild-type and Lrrc8c−/− T cells treated or not with nutlin using a similar protocol as in (d and f). Averaged Ca2+ traces (left) and quantification of the AUC (right) in the regions indicated by the dotted lines (n=10 mice/treatment, pooled from 5 independent experiments). (h) IL-2 and IFN-γ production by wild-type and Lrrc8c−/− CD4+ T cells activated with CD3+CD28 and re-stimulated for 6h with PMA+Iono. Representative contour plots (left) and quantification (right) of IL-2+ and IFN-γ+ CD4+ T cells (n=10 mice per genotype, pooled from 6 independent experiments). (i) Schematic representation of LRRC8C regulating Ca2+ signals in T cells. CDNs influx via LRRC8C leads to STING activation and p53 stabilization, which in turn suppresses Ca2+ signals in T cells (Created with BioRender.com). All data are mean ± s.e.m. and were analyzed by two-tailed, unpaired Student’s t test. **P < 0.01 and ***P < 0.001.
Figure 7.
Figure 7.. LRRC8C suppresses T cell-dependent CNS inflammation.
(a) Experimental design to actively induce experimental autoimmune encephalomyelitis (EAE) in mice (left) and EAE scores (right) in wild-type and Lrrc8c−/− mice at the indicated times after myelin oligodendrocyte glycoprotein (MOG) immunization. (b) Flow cytometry plots of T cells isolated from the spinal cord of mice with EAE on day 23. Representative contour plots (left) and absolute numbers of CD4+ and CD8+ T cells in the spleen and spinal cord (right) of wild-type and Lrrc8c−/− mice. (c) Representative contour plots (left) and absolute numbers (right) of MOG-specific CD4+ T cells from the spinal cord of mice. (d) Expression of IL-17a, IFN-γ and GM-CSF in CD4+ T cells isolated from the spinal cord. Representative contour plots (left) and total numbers (right) of cytokine-producing T cells after PMA+Iono re-stimulation for 6h. (e) CFSE dilution in wild-type and Lrrc8c−/− CD4+ T cells isolated from the spinal cord of mice with EAE and re-stimulated at the indicated time points with 50 μg/ml MOG35–55. Representative flow cytometry plots (left) and quantification (right) of proliferating cells. Data in (a-d) are pooled from 3 independent experiments using 19 wild-type and 17 Lrrc8c−/− mice. Data in (e) are pooled from 2 independent experiments using 15 wild-type and 12 Lrrc8c−/− mice. All data are mean ± s.e.m. and were analyzed by 2-way ANOVA with Sidak’s multiple comparison test (a) and two-tailed, unpaired Student’s t test (b-e). *P < 0.05, **P < 0.01, ***P < 0.001.
Figure 8.
Figure 8.. LRRC8C deficiency enhances T cell mediated antiviral immunity to influenza.
(a) Experimental design of influenza A virus (IAV) infection of wild-type and Lrrc8c−/− mice using the PR8 strain (H1N1, left), and body weight change (right) relative to the initial weight before infection. i.n., intranasal; LD, lethal dose. (b) Viral titers detected in the lung of IAV infected mice by measuring PR8 M2/M1 mRNA expression using RT-qPCR. TCID50, 50% tissue culture infective dose. TCID50 values where transform to TCID50+1 to plot titers on log10 scale. (c) anti-PR8 IgG antibodies in the sera of wild-type and Lrrc8c−/− mice detected by ELISA. (d) Representative flow cytometry plots and bar graphs showing the frequencies of T follicular helper (TFH) cells in the mediastinal lymph nodes (medLNs, left) and absolute number of TFH cells in spleen and medLNs (right). (e) Representative contour plots and bar graphs showing the frequencies of germinal center (GC) B cells in the medLNs (left) and absolute numbers of GC B cells in the spleen, medLNs and lungs (right). (f) Expression of IL-2 and TNF-α in CD4+ T cells isolated from IAV infected mice. Representative contour plots from lung-infiltrating T cells (left) and frequencies (right) of cytokine-producing T cells isolated from the spleen, medLNs and lungs after PMA+Iono re-stimulation for 6h. (g) T cell proliferation measured by CFSE dilution in wild-type and Lrrc8c−/− CD4+ T cells isolated from the lung of mice infected with IAV and re-stimulated with anti-CD3+CD28. (h) Apoptosis of CD4+ and CD8+ T cells from wild-type and Lrrc8c−/− mice shown in (g) measured by annexin V staining 4 days after stimulation with anti-CD3+CD28. (i) CD80 surface expression by CD4+ and CD8+ T cells in the lungs of wild-type and Lrrc8c−/− mice infected with IAV. Representative histogram plots (left) and quantification (right) of CD80 expression (MFI). (j) Correlation of CD80 expression by T cells in the lungs of IAV infected mice vs. body weight (% original BW of mice 15 days after IAV infection). Data in (a-j) are pooled from 2 independent experiments using 8 wild-type and 7 Lrrc8c−/− mice. Data in (g,h) are pooled from 2 independent experiments using 5 mice/genotype. All data are mean ± s.e.m. and were analyzed by 2-way ANOVA with Sidak’s multiple comparison test (a), two-tailed Mann Whitney test (b), and two-tailed, unpaired Student’s t test (b-f, h,i), *P < 0.05, **P < 0.01, ***P < 0.001.

Comment in

References

    1. Qiu Z et al. SWELL1, a plasma membrane protein, is an essential component of volume-regulated anion channel. Cell 157, 447–458, doi:10.1016/j.cell.2014.03.024 (2014). - DOI - PMC - PubMed
    1. Voss FK et al. Identification of LRRC8 heteromers as an essential component of the volume-regulated anion channel VRAC. Science 344, 634–638, doi:10.1126/science.1252826 (2014). - DOI - PubMed
    1. Deneka D, Sawicka M, Lam AKM, Paulino C & Dutzler R Structure of a volume-regulated anion channel of the LRRC8 family. Nature 558, 254–259, doi:10.1038/s41586-018-0134-y (2018). - DOI - PubMed
    1. Syeda R et al. LRRC8 Proteins Form Volume-Regulated Anion Channels that Sense Ionic Strength. Cell 164, 499–511, doi:10.1016/j.cell.2015.12.031 (2016). - DOI - PMC - PubMed
    1. Kumar L et al. Leucine-rich repeat containing 8A (LRRC8A) is essential for T lymphocyte development and function. J Exp Med 211, 929–942, doi:10.1084/jem.20131379 (2014). - DOI - PMC - PubMed

Publication types