
Statement on the active substance acetamiprid

EFSA Panel on Plant Protection Products and their Residues (PPR) et al. EFSA J. .

Abstract

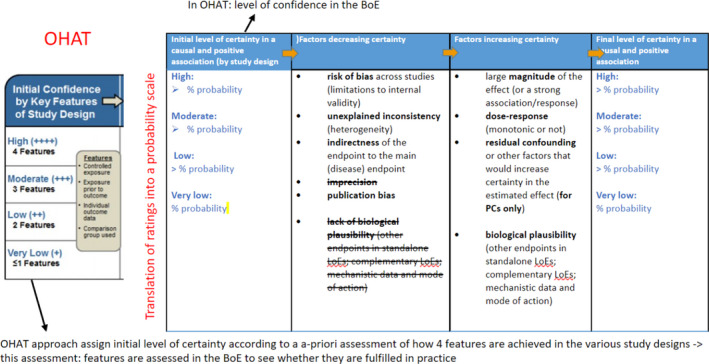
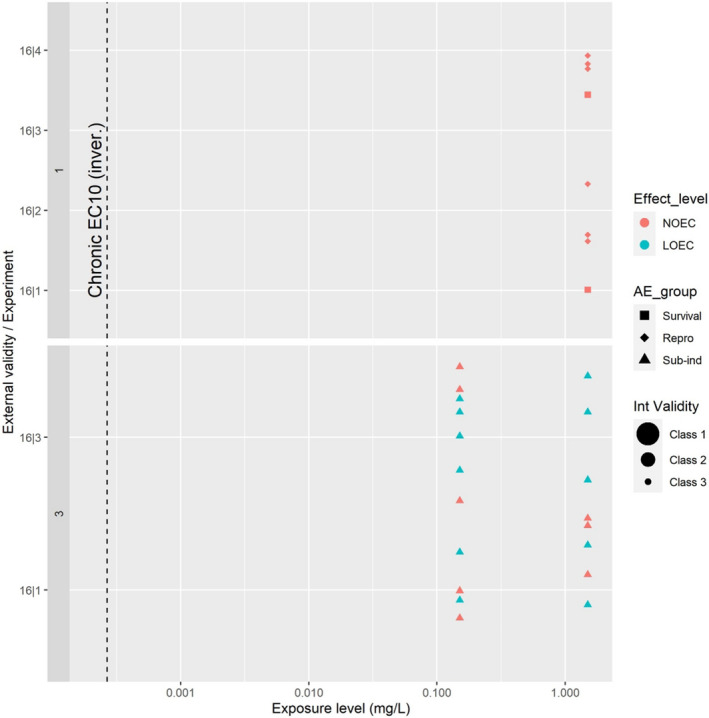
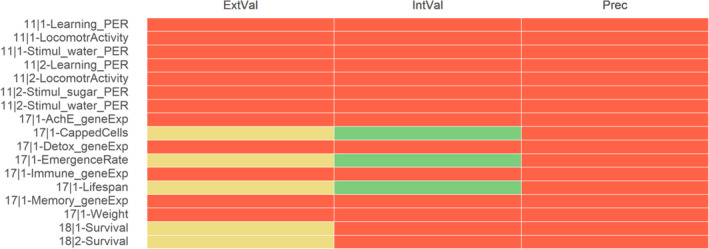
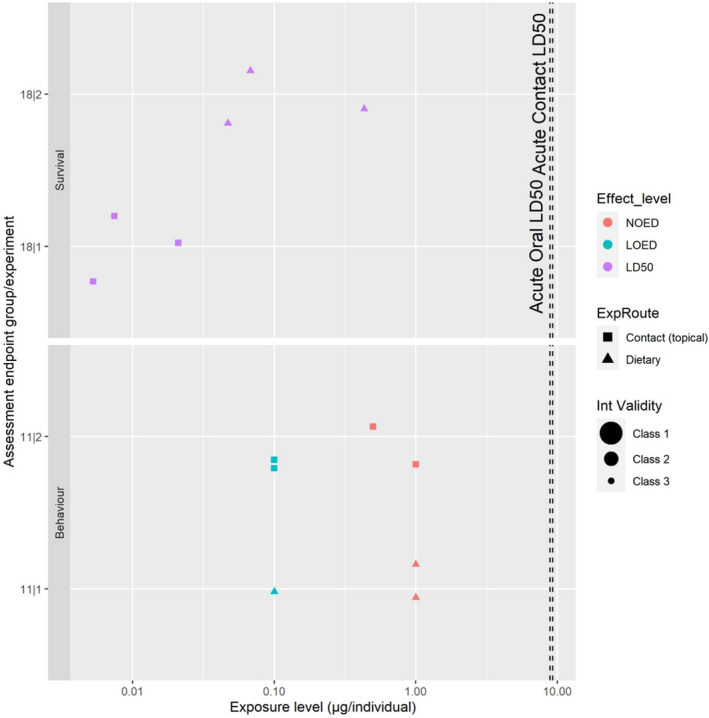
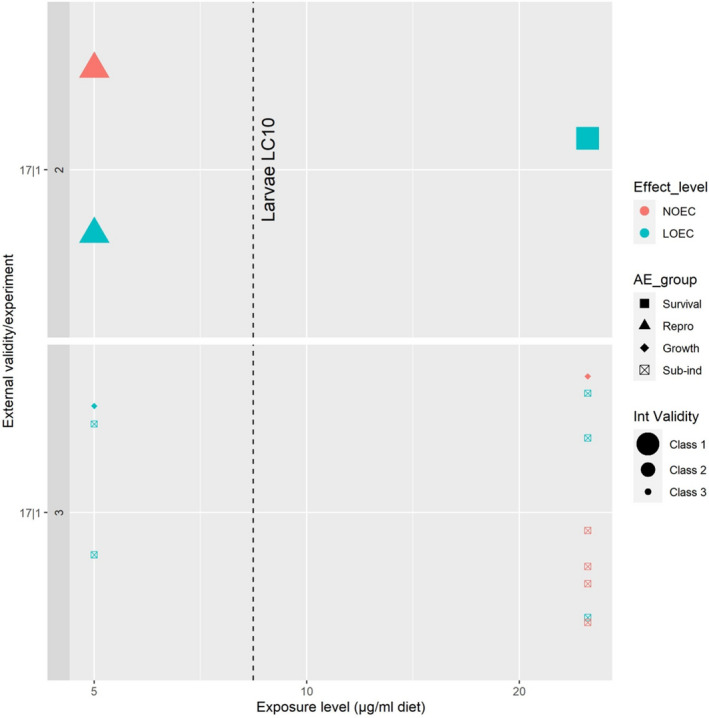
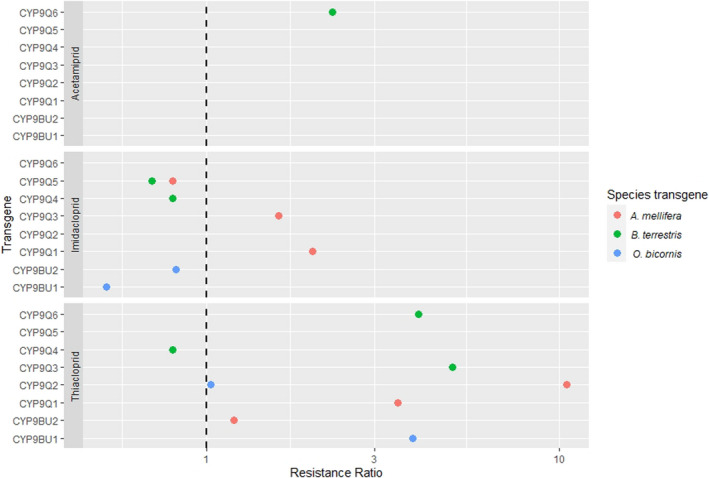
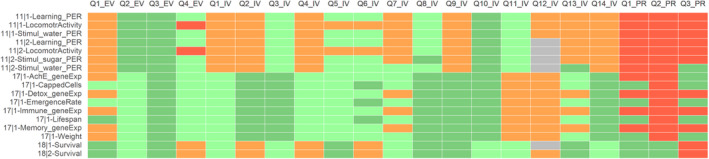
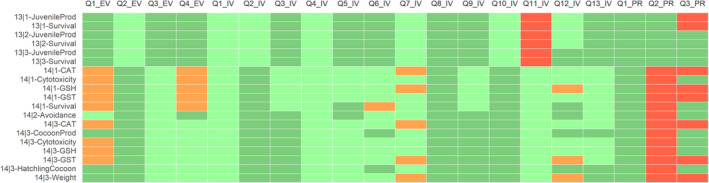
Acetamiprid is a pesticide active substance with insecticidal action currently under the third renewal (AIR3) of the Commission implementing regulation (EU) No 844/2012. Following concerns that this substance may pose high risks to humans and the environment, the French authorities asked the Commission to restrict its uses under Article 69 of Regulation (EC) No 1107/2009. To support this request, competent Authorities from France cited a series of literature papers investigating its hazards and/or exposure to humans and the environment. Consequently, the EFSA PPR Panel was mandated to advise on the likelihood that body of evidence would constitute proof of serious risks to humans or the environment. Therefore, the EFSA PPR Panel evaluated the likelihood of these studies indicating new or higher hazards and exposure to humans and the environment compared to previous EU assessments.A stepwise methodology was designed, including: (i) the initial screening; (ii) the data extraction and critical appraisal based on the principles of OHAT/NTP; (iii) the weight of evidence, including consideration of the previous EU assessments; (iv) the uncertainty analysis, followed, whenever relevant, by an expert knowledge elicitation process. For human health, no conclusive evidence of higher hazards compared to previous assessment was found for genotoxicity, developmental toxicity, neurotoxicity including developmental neurotoxicity and immunotoxicity. However, due to the lack of adequate assessment of the current data set, the PPR Panel recommends conducting an assessment of endocrine disrupting properties for acetamiprid in line with EFSA/ECHA guidance document for the identification of endocrine disruptors. For environment, no conclusive, robust evidence of higher hazards compared to the previous assessment was found for birds, aquatic organisms, bees and soil organisms. However, the potential of high inter-species sensitivity of birds and bees towards acetamiprid requires further consideration.

Keywords: acetamiprid; aquatic organisms; bees; birds; endocrine disruption; environmental risk assessment; expert knowledge elicitation; insecticides; neonicotinoids; soil organisms; uncertainty analysis.


Figures

Figure 1
Figure 1
Adaptations to the OHAT approach introduced in this assessment
Figure 2
Figure 2
Summary of the RoB conducted for the in vitro lines of evidence. The results were reported per assessment endpoint categories (i.e. genotoxicity, developmental toxicity and neurotoxicity) and per specific assessment endpoint. Green: class 1 risk of bias; Orange: Class 2 risk of bias; Red: class 3 risk of bias
Figure 3
Figure 3
Summary of the RoB conducted for the in vivo lines of evidence. The results were reported per assessment endpoint categories (i.e. neurotoxicity, endocrine disruption, immunotoxicity and developmental neurotoxicity) and per specific assessment endpoint. Red: class 3 risk of bias
Figure 4
Figure 4
Summary of the RoB conducted for the human lines of evidence. The results were reported per assessment endpoint categories (i.e. neurotoxicity) and per specific assessment endpoint. Red: class 3 risk of bias
Figure 5
Figure 5
Final certainty rating in the causal association between exposure to a substance and the positive effect
Figure 6
Figure 6
Summary of the appraisal done on the assessment endpoints for laboratory experiments with birds. The outcome takes into account the risk of bias and the precision for several criteria combined with a pre‐defined algorithm (see Annex A). Green indicates low risk of bias or high precision (class 1), yellow moderate risk of bias (class 2 for external and internal validity), while red indicates high risk of bias (class 3) or low precision (class 2)
Figure 7
Figure 7
Summary of the appraisal done on the assessment endpoints for laboratory experiments with aquatic organisms. The outcome takes into account the risk of bias and the precision for several criteria combined with a pre‐defined algorithm (see Annex A). Green indicates low risk of bias or high precision (class 1), yellow moderate risk of bias (class 2 for external and internal validity), while red indicates high risk of bias (class 3) or low precision (class 2)
Figure 8
Figure 8
Summary plot of the acute aquatic data available for acetamiprid. Each line on the y‐axis represents an experiment within a reference (e.g. XX|Y indicate experiment Y within reference XX), organised by external validity class (class 1 representing low risk of bias). Colours identify the type of measured endpoint (effect level), shapes the assessment endpoint group, and size of the markers identify the internal validity class (class 1 representing low risk of bias). Vertical dashed lines highlight the fish acute endpoints available in the EU peer review (EFSA, 2016). The chronic endpoint for survival and reproduction for the snail was imprecise and higher than previous endpoints for aquatic invertebrates (see Figure 9). Subindividual alterations were also observed at concentrations higher than chronic endpoints validated in the previous peer review
Figure 9
Figure 9
Summary plot of the chronic aquatic data available for acetamiprid. Each line on the y‐axis represents an experiment within a reference (e.g. XX|Y indicate experiment Y within reference XX), organised by external validity class (class 1 representing low risk of bias). Colours identify the type of measured endpoint (effect level), shapes the assessment endpoint group, and size of the markers identify the internal validity class (class 1 representing low risk of bias). Vertical dashed lines highlight the endpoints available in the EU peer review (EFSA, 2016). Weight of evidence and uncertainty analysis
Figure 10
Figure 10
Summary of the appraisal done on the assessment endpoints for laboratory experiments with bees. The outcome takes into account the risk of bias and the precision for several criteria combined with a pre‐defined algorithm (see Annex A). Green indicates low risk of bias or high precision (class 1), yellow moderate risk of bias (class 2 for external and internal validity), while red indicates high risk of bias (class 3) or low precision (class 2)
Figure 11
Figure 11
Summary of the appraisal done on the assessment endpoints for field effect experiments with bees. The outcome takes into account the risk of bias and the precision for several criteria combined with a pre‐defined algorithm (see Annex A). Green indicates low risk of bias or high precision (class 1), yellow moderate risk of bias (class 2 for external and internal validity), while red indicates high risk of bias (class 3) or low precision (class 2)
Figure 12
Figure 12
Summary plot of the available data on honey bee adults acutely exposed to acetamiprid under laboratory conditions. Each line on the y‐axis represents an experiment within a reference (e.g. XX|Y indicate experiment Y within reference XX), organised by assessment endpoint group (survival, behavioural). Colours identify the type of measured endpoint (effect level), shapes the route of exposure (contact, dietary), and size of the markers identify the internal validity class (class 1 representing low risk of bias). Vertical dashed lines highlight the endpoints available in the EU peer review (EFSA, 2016)
Figure 13
Figure 13
Summary plot of the honey bee larval and adult data available for prolonged exposure to acetamiprid under laboratory conditions. Each line on the y‐axis represents an experiment within a reference (e.g. XX|Y indicate experiment Y within reference XX), organised by external validity class (class 1 representing low risk of bias). Colours identify the type of measured endpoint (effect level), shapes the assessment endpoint group, and size of the markers identify the internal validity class (class 1 representing low risk of bias). The vertical dashed line highlights the endpoints available in the EU peer review (EFSA, 2016)
Figure 14
Figure 14
The acute toxicity of flupyradifurone, imidacloprid and thiacloprid (top to bottom) to Apis mellifera, Bombus terrestris, Megachile rotundata, Osmia bicornis and Osmia cornuta. Bee species were listed on the y‐axis, while the acute contact LD50 values were plotted as dots against the x‐axis. Unbounded (i.e. higher than) and exact values were colour coded as specified in the plot legend
Figure 15
Figure 15
The sensitivity of bees to flupyradifurone, imidacloprid and thiacloprid (top to bottom). Bee species were listed on the y‐axis, while the sensitivity ratio (i.e. calculated as the honey bee LD50 divided by the LD50 of other bee species) was reported on the x‐axis (base‐10 log scale). The dashed vertical line represents the sensitivity ratio = 10, used as default safety factor by EFSA (2013). Values on the right of the dashed line indicate higher sensitivity than what covered by previous assessments. The comparison is based on the bee 72‐h contact LD50 = 15.7 µg a.s./bee (EFSA, 2015) from the formulation endpoint, however, the endpoint from the active substance study was higher
Figure 16
Figure 16
The interactive toxicity of imidacloprid (top) and thiacloprid (bottom) with the P450 inhibitors Piperonyl butoxide (PBO – right) and 1‐aminobenzotriazole (ABT – left). The bee species were listed on the y‐axis, while the sensitivity ratio (i.e. the toxicity ratio of the pesticide alone/pesticide + synergist) was reported on the x‐axis (base‐10 log scale). Data points (dots) were colour‐coded by route of exposure, as specified in the plot legend. The dashed vertical lines represent the sensitivity ratio = 1, indicating no interactive toxicity. Data on the right side of the dashed line indicate higher sensitivity induced by the P450 inhibitor
Figure 17
Figure 17
Radioligand binding examined by displacement of tritiated imidacloprid by unlabelled imidacloprid, thiacloprid and flupyradifurone. Dots represent the half maximal inhibitory concentration IC50 (nM). Lower IC50 values indicate higher binding affinity
Figure 18
Figure 18
The Resistance Ratio (RR) calculated as the ratio of the LC50s of flies expressing the transgene to the LC50s of flies not expressing the transgene (x = log scale). Values at the right of the dashed line indicate higher pesticide tolerance in transgenic flies
Figure 19
Figure 19
Summary of the appraisal done on the assessment endpoints for laboratory experiments with soil organisms. The outcome takes into account the risk of bias and the precision for several criteria combined with a pre‐defined algorithm (see Annex A). Green indicates low risk of bias or high precision (class 1), yellow moderate risk of bias (class 2 for external and internal validity), while red indicates high risk of bias (class 3) or low precision (class 2)
Figure 20
Figure 20
Summary plot of the chronic data on soil organisms available for acetamiprid. Each line on the y‐axis represents an experiment within a reference (e.g. XX|Y indicate experiment Y within reference XX), organised by assessment endpoint group. Colours identify the tested species, shapes the type of measured endpoint (effect level), and size of the markers identify the internal validity class (class 1 representing low risk of bias). Vertical dashed lines highlight the endpoints available in the EU peer review (EFSA, 2016)
None
Figure A.1 The heatmap summarising the outcome of the appraisal of experiments with aquatic organisms
None
Figure A.2 The heatmap summarising the outcome of the appraisal of bee laboratory experiments
None
Figure A.3 The heatmap summarising the outcome of the appraisal of experiments with soil organisms
None
Figure A.4 The heatmap summarising the outcome of the appraisal of field effect experiments with bees

References

    1. Bayer , 2017a. Flupyradifurone SL 200: acute contact toxicity test with the Solitary Bee Osmia bicornis in the Laboratory (non‐GLP study). Unpublished report.
    1. Bayer , 2017b. Flupyradifurone SL 200: acute contact toxicity test with the Solitary Bee Osmia cornuta in the laboratory (non‐GLP study). Unpublished report.
    1. Bayer , 2017c. Acute contact toxicity test with Flupyradifurone SL 200 with the solitary Leafcutter Bee (Megachile rotundata L.) in the laboratory (non‐GLP study). Unpublished report.
    1. Beadle K, Singh KS, Troczka BJ, Randall E, Zaworra M, Zimmer CT, Hayward A, Reid R, Kor L, Kohler M, Buer B, Nelson DR, Williamson MS, Davies TGE, Field LM, Nauen R and Bass C, 2019. Genomic insights into neonicotinoid sensitivity in the solitary bee Osmia bicornis . PLoS Genetics, 15, e1007903. 10.1371/journal.pgen.1007903 - DOI - PMC - PubMed
    1. Çamlica Y, Bediz SC, Comelekoglu U and Yilmaz SN, 2019. Toxic effect of acetamiprid on Rana ridibunda sciatic nerve (electrophysiological and histopathological potential). Drug and Chemical Toxicology, 42, 264–269. 10.1080/01480545.2018.1442475 - DOI - PubMed