. 2022 Jan 4;3(1):100477.
doi: 10.1016/j.xcrm.2021.100477. eCollection 2022 Jan 18.

Four groups of type 2 diabetes contribute to the etiological and clinical heterogeneity in newly diagnosed individuals: An IMI DIRECT study

Affiliations

Four groups of type 2 diabetes contribute to the etiological and clinical heterogeneity in newly diagnosed individuals: An IMI DIRECT study

Agata Wesolowska-Andersen et al. Cell Rep Med. .

Abstract

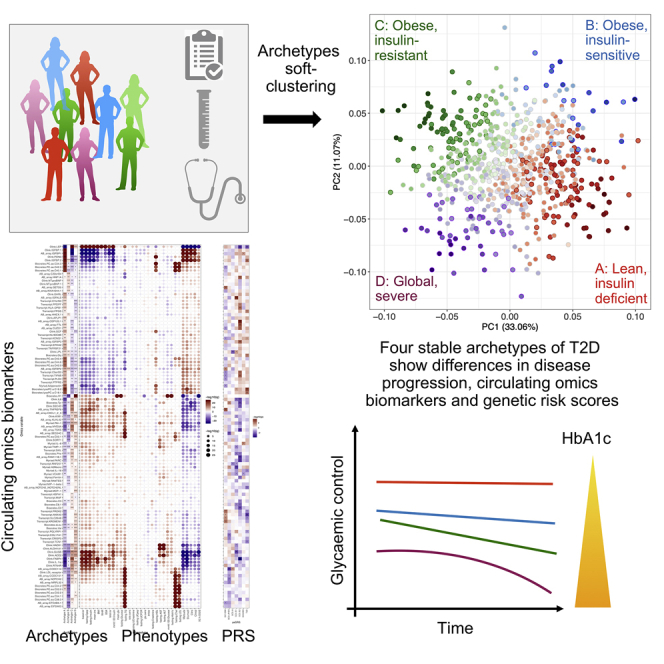
The presentation and underlying pathophysiology of type 2 diabetes (T2D) is complex and heterogeneous. Recent studies attempted to stratify T2D into distinct subgroups using data-driven approaches, but their clinical utility may be limited if categorical representations of complex phenotypes are suboptimal. We apply a soft-clustering (archetype) method to characterize newly diagnosed T2D based on 32 clinical variables. We assign quantitative clustering scores for individuals and investigate the associations with glycemic deterioration, genetic risk scores, circulating omics biomarkers, and phenotypic stability over 36 months. Four archetype profiles represent dysfunction patterns across combinations of T2D etiological processes and correlate with multiple circulating biomarkers. One archetype associated with obesity, insulin resistance, dyslipidemia, and impaired β cell glucose sensitivity corresponds with the fastest disease progression and highest demand for anti-diabetic treatment. We demonstrate that clinical heterogeneity in T2D can be mapped to heterogeneity in individual etiological processes, providing a potential route to personalized treatments.

Keywords: archetypes; disease progression; glycaemic deterioration; multi-omics; patient clustering; patient stratification; precision medicine; soft-clustering; type 2 diabetes.


Conflict of interest statement

The views expressed in this article are those of the authors and not necessarily those of the NHS, the NIHR, or the Department of Health. M.I.C. has served on advisory panels for Pfizer, Novo Nordisk, and Zoe Global; has received honoraria from Merck, Pfizer, Novo Nordisk, and Eli Lilly; and has received research funding from Abbvie, Astra Zeneca, Boehringer Ingelheim, Eli Lilly, Janssen, Merck, Novo Nordisk, Pfizer, Roche, Sanofi Aventis, Servier, and Takeda. As of June 2019, M.I.C. is an employee of Genentech and a holder of Roche stock. S.B. is holder of stock in Intomics, Hoba Therapeutics, Novo Nordisk, and Lundbeck and holds managing board memberships in Proscion and Intomics.

Figures

None
Graphical abstract
Figure 1
Figure 1
Archetype stability as evaluated using the following approaches (A) Minimized residual sum of squares (RSS) for k number of archetypes ranging from 1 to 10 in a scree plot was assessed first. The screen plot was based on RSS from the best model out of 100 restarts of the archetype algorithm for each k and showed a plateau in the drop in intra-cluster variance at k4 or k5. (B) Stability of the k archetypes was then assessed by a randomized subsampling of 90% of the original dataset repeated 100 times and compared to the original subgroups using the adjusted Rand index. Simultaneously, we evaluated the stability of the archetypes at archetype membership cutoffs ranging from 0 to 1 in intervals of 0.05. The most stable solution was k2, irrespective of membership threshold, followed by k4, which reached a median adjusted Rand index > 0.75 at threshold 0. (C) Stability of the solution with two and four archetypes across the full range of tested archetype membership thresholds. Altogether, these analyses showed that four archetypes had the lowest RSS while showing high stability after randomization. The subgroup stability increased with an increasing membership threshold and plateaued at 0.6, wherefore this threshold was used as the cutoff for the extreme archetype inclusion. Whiskers in (B) and (C) correspond to the largest and smallest value no further than 1.5 IQR (inter quartile range) from the hinge.
Figure 2
Figure 2
Clinical characteristics of the four archetypes, and groups with archetype scores identified at the extremes of the baseline phenotype spectrum (A) Representation of the baseline phenotype spectrum of newly diagnosed T2D projected in 2 dimensions following principal-component analysis. Each point represents an individual, and the four archetypes are colored and marked as subgroups A–D. The strength of the colors represents the level of archetype membership, with individuals shown in a lighter color representing a mixed phenotype with no clearly dominating archetype. (B) Summary of the 32 clinical variables used for the characterization of the baseline T2D phenotypic space. All variables were rank-normally transformed, and for each group with extreme archetype scores and each variable, the heatmap shows the significance level of the difference between the group and the remaining individuals from the study, as from a Mann-Whitney U test. The color of the heatmap reflects the directionality and magnitude of the test estimate, with red indicating higher values and blue indicating lower values characteristic of the given group. (C) Pie chart showing the percentage of individuals belonging to each of the four groups with extreme archetype scores and in the mixed etiology group. (D) Table of the number of individuals represented in each of the four groups with extreme archetype scores and in the mixed etiology group. Values statistically different from zero are marked as ∗p < 0.05, ∗∗p < 0.01, and ∗∗∗p < 0.001.
Figure 3
Figure 3
Archetype associations with genetic risk scores and additional clinical variables (A) Associations of partitioned genetic risk scores or T2D genetic risk scores with archetype scores. Statistically significant results (p < 0.05) from linear regression are shown in red. (B) Associations of clinical variables available for a subset of the cohort or only collected at the baseline visit. These are not used in the clustering of the baseline T2D phenotypic space. All variables were rank-normally transformed, and for each archetype score and each variable, the heatmap shows the significance level of the association test using linear regression. The color of the heatmap reflects the directionality and magnitude of the test estimate, with red indicating positive and blue indicating negative associations. Values statistically different from zero are marked as ∗p < 0.05, ∗∗p < 0.01, and ∗∗∗p < 0.001.
Figure 4
Figure 4
Association between archetypes and disease progression as defined by the slope of the HbA1c increase and by glucose-lowering medication during the 36-month study period (A) T2D disease progression assessed as HbA1c slopes as dependent variables and archetype scores as independent variables. The analysis was divided into all individuals, untreated individuals, and individuals treated with glucose-lowering medication at baseline for each archetype. (B) Ability of individual phenotypes to predict T2D disease progression. Combinations of phenotypes constituting archetypes A and D had the highest power to predict disease progression. (C) Forest plot showing the odds ratios between archetype scores and individuals receiving metformin treatment or increasing their metformin treatment (change) during the study period. (D) Forest plot showing the odds ratios between archetype scores and individuals receiving glucose-lowering treatment or increasing their treatment (change) during the study period. Error bars represent 95% confidence intervals. Statistically significant results (p < 0.05) from linear or logistic regression are shown in opaque colors.
Figure 5
Figure 5
Summary of differences in multiomics profiles among the archetypes (A) Omics signatures discriminating archetype A (lean and insulin deficient) and archetype C (obese and insulin resistant) were associated with increased protein levels of insulin-like growth factor binding proteins 1 and 2 (IGFBP1 and IGFBP2). These proteins were positively associated with insulin-sensitivity-related variables. (B) Archetype A was further associated with increased metabolite levels of acyl-alkyl-phosphatidylcholines (PC.ae) that, in addition to insulin sensitivity, were positively associated with total cholesterol, HDL-C, and LDL-C levels; lyso-phosphatidylcholines (lysoPCs); and adiponectin (positively associated with HDL-C levels). (C) Omics signatures discriminating between archetype A (lean and insulin deficient) and archetype D (global severe) included transcript levels of several genes associated with insulin resistance and glycemic control. (D) Metabolite hexose (H1) was strongly negatively associated with archetype B (obese and insulin sensitive) and positively associated with archetype D, which were associated with the best and worst glucose control, respectively. (E) Biomarker levels negatively associated with archetype B were strongly positively associated with TG, total cholesterol, and LDL-C levels and include the proteins NOTCH2 and the LDL-C receptor, as well as metabolites and short-chained diacyl-phosphatidylcholines. (F) Protein levels positively associated with archetype B included biomarkers with weaker associations to the clinical phenotypes, such as the β cell marker HNF1A, which was negatively associated with TG levels. (G) Protein levels positively associated with archetype C included tyrosine and were positively associated with insulin resistance and TG levels and negatively associated with HDL-C. (H) Adipose tissue-derived hormone leptin (LEP) was strongly associated with the insulin-resistant obese phenotype represented by archetypes C and D. (I) Levels of inflammatory proteins discriminated between archetype D and archetype A/B and were positively associated with ALT and AST. (J) Branched-chain amino acids (BCAAs) valine and leucine/isoleucine discriminated between archetype D and archetype A and were associated with insulin-resistance-related variables. We tested the association between the quantitative archetype scores and each omics variable in linear regression models. The most discriminative omics variables were then investigated for associations with the clinical phenotypes. Statistically significant differences are marked as ∗q < 0.05, ∗∗q < 0.01, and ∗∗∗q < 0.001.
Figure 6
Figure 6
Characterization of the 12 mixed etiology archetypes (A) Heatmap of clinical associations across the 12 mixed etiology groups defined by their primary and secondary archetypes. The color of the heatmap reflects the directionality and magnitude of the test estimate, with red indicating higher and blue indicating lower values characteristic of the given group. Statistical significance is marked as ∗p < 0.05, ∗∗p < 0.01, and ∗∗∗p < 0.001. Gray stippled horizontal boxes highlight processes in which an archetype has precedence over other archetypes. Red vertical stippled boxes highlight mixed etiology archetypes associated with higher progression rates (see B). (B) Association between mixed etiology archetypes and disease progression as defined by the slope of HbA1c over 36 months. The analysis was divided into all individuals, untreated individuals, and individuals treated with glucose-lowering medication at baseline for each group. Error bars represent 95% confidence intervals. (C) Sankey chart of movements among mixed etiology archetypes from baseline visit (M0), 18 months (M18), and 36 months (M36). Only trajectories followed by ≥5 participants are displayed for readability. (D) Table showing the number of individuals in the mixed etiology archetype groups and their frequency of glucose-lowering treatment at baseline.

References

    1. Mahajan A., Taliun D., Thurner M., Robertson N.R., Torres J.M., Rayner N.W., Payne A.J., Steinthorsdottir V., Scott R.A., Grarup N., et al. Fine-mapping type 2 diabetes loci to single-variant resolution using high-density imputation and islet-specific epigenome maps. Nat. Genet. 2018;50:1505–1513. - PMC - PubMed
    1. Scott R.A., Scott L.J., Mägi R., Marullo L., Gaulton K.J., Kaakinen M., Pervjakova N., Pers T.H., Johnson A.D., Eicher J.D., et al. DIAbetes Genetics Replication And Meta-analysis (DIAGRAM) Consortium An Expanded Genome-Wide Association Study of Type 2 Diabetes in Europeans. Diabetes. 2017;66:2888–2902. - PMC - PubMed
    1. Udler M.S., Kim J., von Grotthuss M., Bonàs-Guarch S., Cole J.B., Chiou J., Anderson C.D., on behalf of METASTROKE and the ISGC, Boehnke M., Laakso M., Atzmon G., et al. Type 2 diabetes genetic loci informed by multi-trait associations point to disease mechanisms and subtypes: A soft clustering analysis. PLoS Med. 2018;15:e1002654. - PMC - PubMed
    1. Wood A.R., Jonsson A., Jackson A.U., Wang N., van Leewen N., Palmer N.D., Kobes S., Deelen J., Boquete-Vilarino L., Paananen J., et al. Diabetes Research on Patient Stratification (DIRECT) A Genome-Wide Association Study of IVGTT-Based Measures of First-Phase Insulin Secretion Refines the Underlying Physiology of Type 2 Diabetes Variants. Diabetes. 2017;66:2296–2309. - PMC - PubMed
    1. Ahlqvist E., Storm P., Käräjämäki A., Martinell M., Dorkhan M., Carlsson A., Vikman P., Prasad R.B., Aly D.M., Almgren P., et al. Novel subgroups of adult-onset diabetes and their association with outcomes: a data-driven cluster analysis of six variables. Lancet Diabetes Endocrinol. 2018;6:361–369. - PubMed

Publication types