. 2021 Dec 30;3(1):100487.
doi: 10.1016/j.xcrm.2021.100487. eCollection 2022 Jan 18.

Immunological factors, but not clinical features, predict visceral leishmaniasis relapse in patients co-infected with HIV

Affiliations

Immunological factors, but not clinical features, predict visceral leishmaniasis relapse in patients co-infected with HIV

Yegnasew Takele et al. Cell Rep Med. .

Abstract

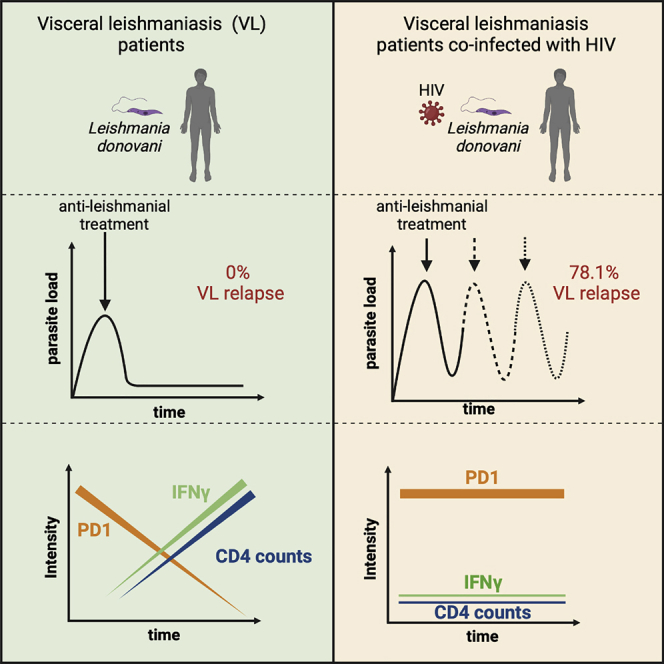
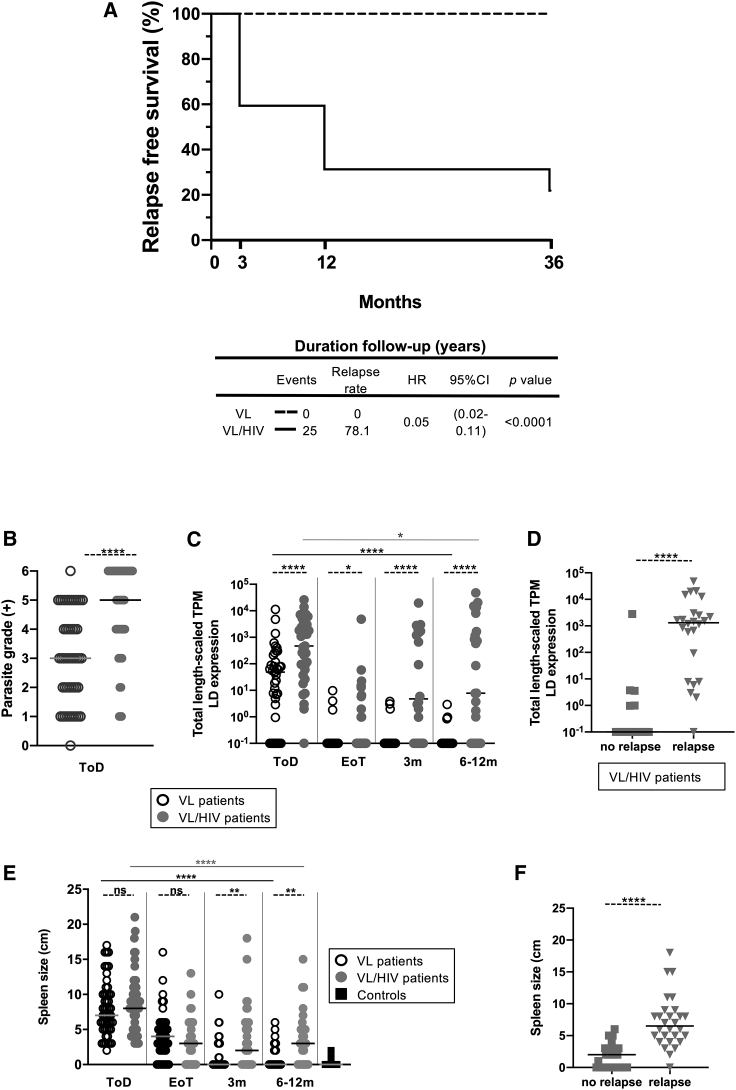
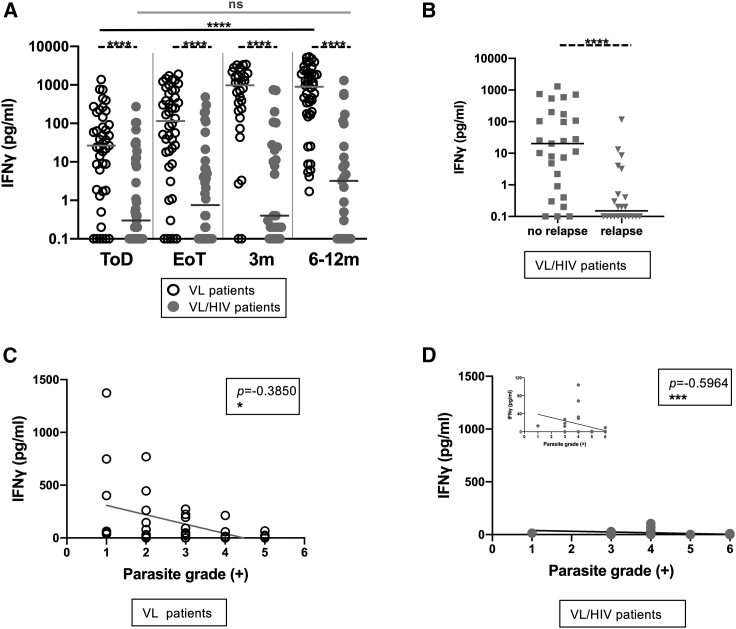
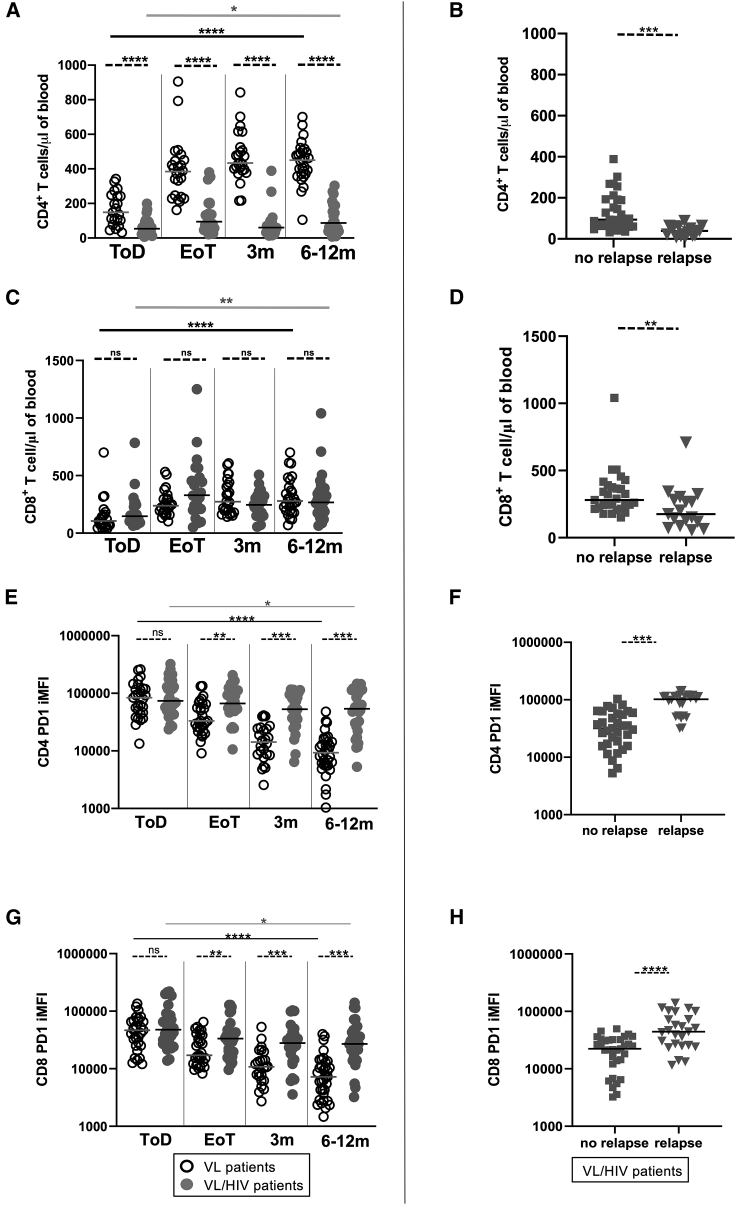
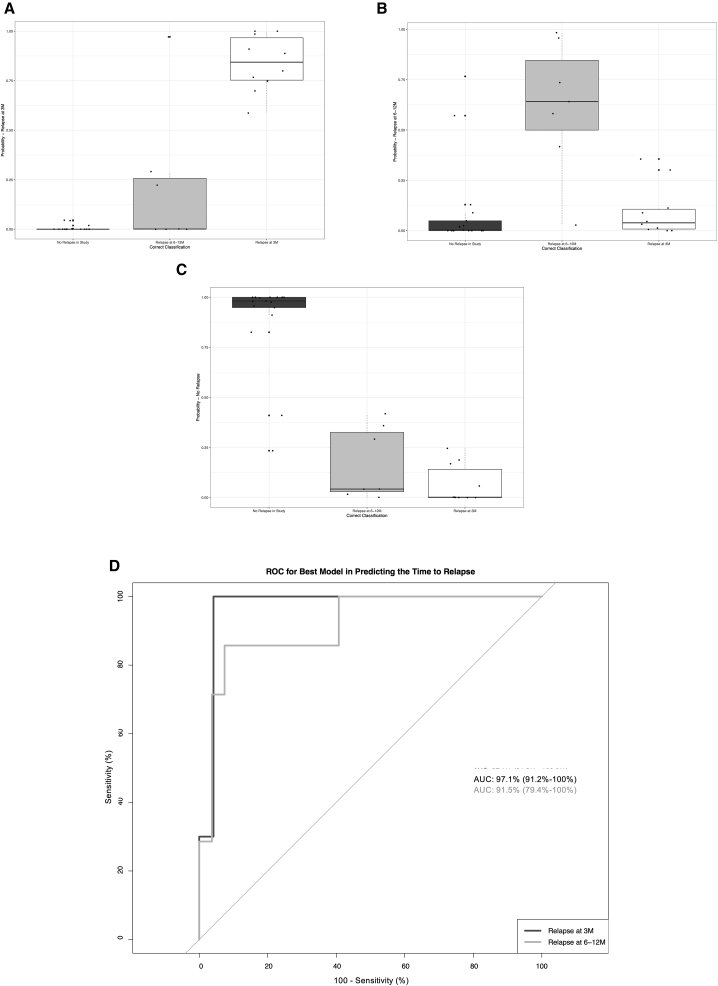
Visceral leishmaniasis (VL) has emerged as a clinically important opportunistic infection in HIV patients, as VL/HIV co-infected patients suffer from frequent VL relapse. Here, we follow cohorts of VL patients with or without HIV in Ethiopia. By the end of the study, 78.1% of VL/HIV-but none of the VL patients-experience VL relapse. Despite a clinically defined cure, VL/HIV patients maintain higher parasite loads, lower BMI, hepatosplenomegaly, and pancytopenia. We identify three immunological markers associated with VL relapse in VL/HIV patients: (1) failure to restore antigen-specific production of IFN-γ, (2) persistently lower CD4+ T cell counts, and (3) higher expression of PD1 on CD4+ and CD8+ T cells. We show that these three markers, which can be measured in primary hospital settings in Ethiopia, combine well in predicting VL relapse. The use of our prediction model has the potential to improve disease management and patient care.

Keywords: CD4+; HIV; Interferon-gamma; PD1; T cell counts; Visceral leishmaniasis.


Conflict of interest statement

The authors declare no competing interests.

Figures

None
Graphical abstract
Figure 1
Figure 1
Relapse-free survival, parasite load, and spleen size (A) Kaplan-Meier curves of participant VL relapses comparing VL to VL/HIV patients. The hazard ratios (with 95% confidence intervals and p values) obtained from the Cox model indicated the change in survival following treatment for VL for these groups. HR, hazard ratio; CI, confidence interval. (B) Quantification of Leishmania amastigotes in smears of splenic aspirates collected from VL (n = 50) and VL/HIV (n = 49) patients at ToD. (C) Quantification of the total expression of L. donovani mRNA in blood from VL (ToD: n = 40, EoT: n = 31, 3 months: n = 31, 6–12 months: n = 37) and VL/HIV (ToD: n = 35, EoT: n = 30, 3 months: n = 24, 6–12 months: n = 25) patients during the 3- and 6- to 12-month follow-up periods. (D) Quantification of the total L. donovani mRNA expression in blood from VL/HIV patients who did not relapse (n = 13) and who relapsed (n = 24) after successful antileishmanial treatment. (E) Spleen size on VL (ToD: n = 50, EoT: n = 45, 3 months: n = 36, 6–12 months: n = 26), VL/HIV (ToD: n = 49, EoT: n = 39, 3 months: n = 32, 6–12 months: n = 26) patients and controls (n = 25). (F) Spleen size of VL/HIV patients who did not relapse (n = 28) and those who relapsed (n = 37) after successful antileishmanial treatment, during the 3- and 6- to 12-month follow-up periods. In (D) and (E), if a patient did not relapse during the 2 time points of follow-up and if a patient relapsed at both 3 and 6–12 months, this is represented as 2 measurements. Each symbol represents the value for 1 individual, the straight lines represent the median. Statistical differences between VL and VL/HIV patients at each time point or between no relapse and relapse were determined using a Mann-Whitney test; statistical differences between the 4 different time points for each cohort of patients were determined by the Kruskal-Wallis test. LD mRNA = L. donovani mRNA. ToD = time of diagnosis; EoT, end of treatment; ns, not significant; 3 m, 3 months post-EoT; 6–12 m, 6–12 months post-EoT;. See also Figure S1.
Figure 2
Figure 2
Whole blood assay: antigen-specific production of IFN-γ (A) Whole blood cells from VL (ToD: n = 43, EoT: n = 44, 3 months: n = 30, 6–12 months: n = 44) and VL/HIV patients (ToD: n = 39, EoT: n = 40, 3 months: n = 25, 6–12 months: n = 25) were cultured in the presence of soluble leishmania antigen (SLA), and IFN-γ was measured by ELISA in the supernatant after 24 h. (B) Comparison of the levels of antigen-specific IFN-γ produced by whole blood cells from VL/HIV patients who did not relapse (n = 27) and those who relapsed (n = 22) after successful antileishmanial treatment during the 3- and 6- to 12-month follow-up period. If a patient did not relapse during the 2 time points of follow-up and if a patient relapsed at both 3 and 6–12 months, this is represented as 2 measurements. (C and D) Correlation between parasite grades and IFN-γ at ToD in VL patients (n = 38) (C) and (D) VL/HIV patients (n = 34). Each symbol represents the value for 1 individual; the straight lines represent the median. Statistical differences between VL and VL/HIV patients at each time point or between no relapse and relapse were determined using a Mann-Whitney test; statistical differences between the 4 different time points for each cohort of patients were determined by the Kruskal-Wallis test and the correlation by the Spearman rank test.
Figure 3
Figure 3
CD4+ and CD8+ T cell counts and PD1 expression (A and C) CD4+ T cell counts (A) and (C) CD8+ T cell counts were measured by flow cytometry in the blood of VL (ToD: n = 21, EoT: n = 24, 3 months: n = 24, 6–12 months: n = 28) and VL/HIV patients (ToD: n = 27, EoT: n = 24, 3 months: n = 21, 6–12 months: n = 25). (B and D) Comparison of CD4+ T cell counts (B) and (D) CD8+ T cell counts in VL/HIV patients who did not relapse (n = 29) and those who relapsed (n = 17) during the 3- and 6- to 12-month follow-up periods. (E and G) CD4 PD1 iMFI (E) and (G) CD8 PD1 iMFI was measured by multiplying the percentage of CD4+ T cells or CD8+ T cells and the median fluorescence intensity of PD1 as measured by flow cytometry in the PBMCs of VL (ToD: n = 29, EoT: n = 29, 3 months: n = 24, 6–12 months: n = 34) and VL/HIV patients (ToD: n = 28, EoT: n = 32, 3 months: n = 26, 6–12 months: n = 32). (F and H) Comparison of CD4 PD1 iMFI (F) and (H) comparison of CD8 PD1 iMFI in the blood of VL/HIV patients who did not relapse (n = 33) and those who relapsed (n = 25) during the 3- and 6- to 12-month follow-up periods. (B, D, F, and H) If a patient did not relapse during the 2 time points of follow-up and if a patient relapsed at both 3 and 6–12 months, this is represented as 2 measurements. Each symbol represents the value for 1 individual; the straight lines represent the median. Statistical differences between VL and VL/HIV patients at each time point or between no relapse and relapse were determined using a Mann-Whitney test, and statistical differences between the 4 different time points for each cohort of patients were determined by the Kruskal-Wallis test.
Figure 4
Figure 4
Performance of multinomial logistic regression model in predicting relapse time for VL/HIV individuals (A) Performance of model in predicting relapse at 3 months from EoT. (B) Performance of model in predicting relapse at 6–12 months from EoT. (C) Performance of model in predicting VL/HIV individuals who do not relapse with VL within 12 months of study from EoT. (D) Receiver operating characteristic (ROC) for predicting VL relapse at 3 months and relapse at 6–12 months groups for VL/HIV individuals from logistic regression model. See also Figure S5.

References

    1. Ruiz-Postigo J.A., Grouta L., Jaina S. Global leishmaniasis surveillance, 2017–2018, and first report on 5 additional indicators. Wkly. Epidemiol. Rec. 2020;25:265–280.
    1. World Health Organization . 2010. Control of the leishmaniases. Report of a meeting of the WHO Expert Committee on the Control of Leishmaniases, Geneva, 22–26 March 2010.http://apps.who.int/iris/bitstream/handle/10665/44412/WHO_TRS_949_eng.pd...
    1. Gadisa E., Tsegaw T., Abera A., Elnaiem D.E., den Boer M., Aseffa A., Jorge A. Eco-epidemiology of visceral leishmaniasis in Ethiopia. Parasit. Vectors. 2015;8:381. - PMC - PubMed
    1. Davidson R.N. Visceral leishmaniasis in clinical practice. J. Infect. 1999;39:112–116. - PubMed
    1. van Griensven J., Diro E. Visceral leishmaniasis. Infect. Dis. Clin. North Am. 2012;26:309–322. - PubMed

Publication types

MeSH terms