. 2022 Feb 2:2022:baac001.
doi: 10.1093/database/baac001.

Authors' attitude toward adopting a new workflow to improve the computability of phenotype publications

Authors' attitude toward adopting a new workflow to improve the computability of phenotype publications

Hong Cui et al. Database (Oxford). .

Abstract

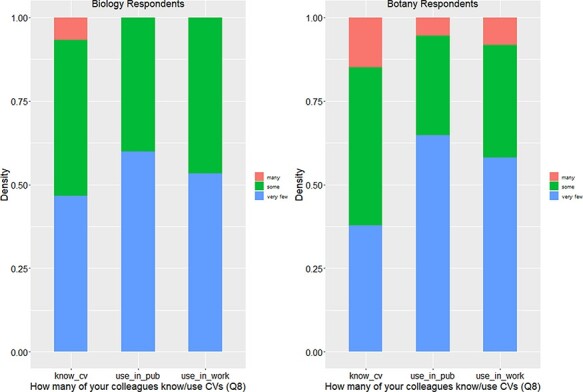
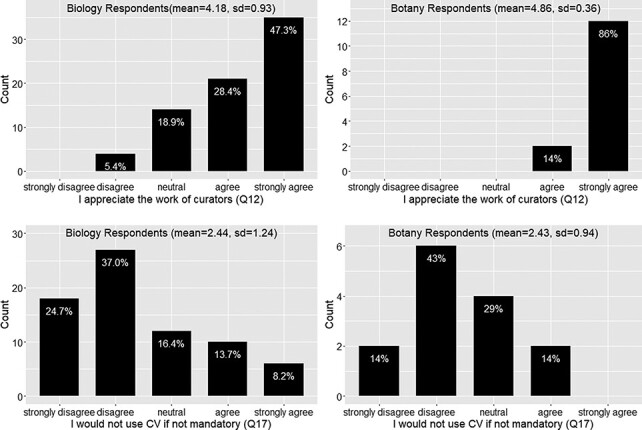
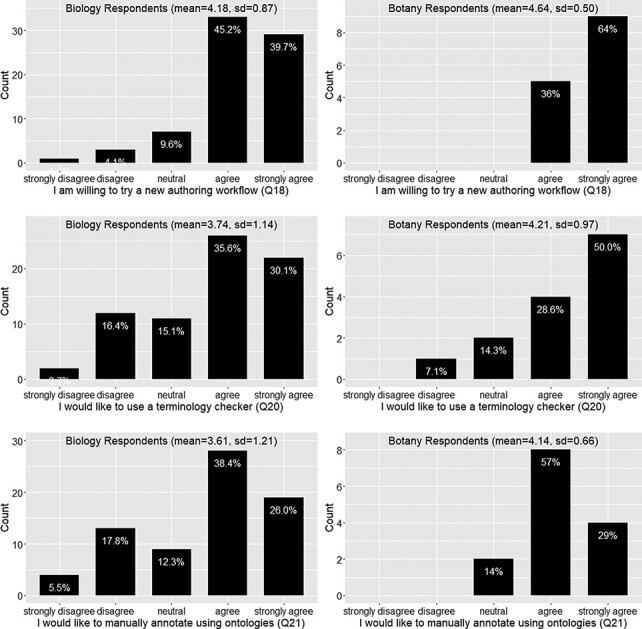
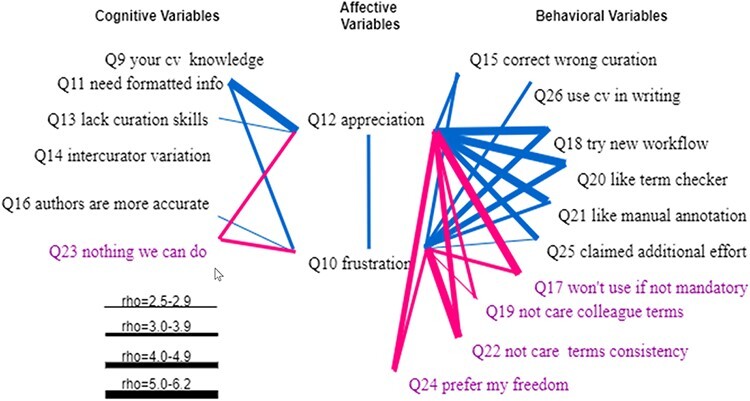
Critical to answering large-scale questions in biology is the integration of knowledge from different disciplines into a coherent, computable whole. Controlled vocabularies such as ontologies represent a clear path toward this goal. Using survey questionnaires, we examined the attitudes of biologists toward adopting controlled vocabularies in phenotype publications. Our questions cover current experience and overall attitude with controlled vocabularies, the awareness of the issues around ambiguity and inconsistency in phenotype descriptions and post-publication professional data curation, the preferred solutions and the effort and desired rewards for adopting a new authoring workflow. Results suggest that although the existence of controlled vocabularies is widespread, their use is not common. A majority of respondents (74%) are frustrated with ambiguity in phenotypic descriptions, and there is a strong agreement (mean agreement score 4.21 out of 5) that author curation would better reflect the original meaning of phenotype data. Moreover, the vast majority (85%) of researchers would try a new authoring workflow if resultant data were more consistent and less ambiguous. Even more respondents (93%) suggested that they would try and possibly adopt a new authoring workflow if it required 5% additional effort as compared to normal, but higher rates resulted in a steep decline in likely adoption rates. Among the four different types of rewards, two types of citations were the most desired incentives for authors to produce computable data. Overall, our results suggest the adoption of a new authoring workflow would be accelerated by a user-friendly and efficient software-authoring tool, an increased awareness of the challenges text ambiguity creates for external curators and an elevated appreciation of the benefits of controlled vocabularies.


Figures

Figure 1.
Figure 1.
Geographical distribution of the 91 effective respondents. Geolocation resolution was conducted using https://ipapi.co/ on the respondent IP addresses collected by Qualtrics.
Figure 2.
Figure 2.
Years of professional experience (Q4) and education level (Q5).
Figure 3.
Figure 3.
Respondents’ work distribution (Q7).
Figure 4.
Figure 4.
Number of colleagues who know or use controlled vocabularies (Q8).
Figure 5.
Figure 5.
Knowledge of controlled vocabularies (Q9) and overall attitude toward controlled vocabularies (Q28).
Figure 6.
Figure 6.
Frustration with ambiguities in phenotype descriptions (Q10) and position on the need for information to be in a computer-accepted format for computation” (Q11).
Figure 7.
Figure 7.
Lack of data curation skills (Q13) and inter-curator variation awareness (Q14).
Figure 8.
Figure 8.
Action to correct curation errors (Q15) and position on whether authors or data curators are more capable of retaining the original meaning of a character (Q16).
Figure 9.
Figure 9.
Appreciation of the work of curators (Q12) and willingness to use controlled vocabularies if not mandatory (Q17).
Figure 10.
Figure 10.
Care about term variation (Q19) and care about term consistency (Q22).
Figure 11.
Figure 11.
Ambiguity issue cannot be solved (Q23), preference for the freedom to write manuscript own way (Q24) and current effort in using controlled vocabularies in publications (Q26).
Figure 12.
Figure 12.
Willingness to use a new authoring workflow (Q18), a terminology checker (Q20), or ontologies to manually annotate scientific writing (Q21).
Figure 13.
Figure 13.
Additional effort respondents are willing to put into making manuscripts more accessible to computation (Q25).
Figure 14.
Figure 14.
Preferences for rewards (Q27).
Figure 15.
Figure 15.
Spearman correlations between affective variables (Q10 and Q12) and (1) cognitive variables (Q9, Q11, Q13, Q14, Q16 and Q23) and (2) behavioral variables (Q15, Q26, Q18, Q20, Q21, Q25, Q17, Q19, Q22 and Q24). Variables that indicate a resistance to change are displayed in purple. All links represent statistically significant correlations. Blue links represent positive correlations, while red links for negative correlations. The thickness of the links indicates the strength of a correlation.
Figure 16.
Figure 16.
Statistically significant Spearman correlations between the cognitive variables and the behavioral variables. Variables that indicate a resistance to change are displayed in purple. All links represent statistically significant correlations. Blue links represent positive correlations, while red links for negative correlations. The thickness of the links indicates the strength of a correlation.
Figure 17.
Figure 17.
Statistically significant Spearman correlations among cognitive variables. Variables that indicate a resistance to change are displayed in purple. All links represent statistically significant correlations. Blue links represent positive correlations, while red links represent negative correlations. The thickness of the links indicates the strength of a correlation.
Figure 18.
Figure 18.
The PRO-SOL-RES model constructed with the 91 observations. Circles are for latent variables, and boxes are for measured variables. Self-directing, double-arrowed links show the residuals. Double-arrowed links between two variables indicate correlation, where single-arrowed links show causal relationships. Positive correlations are shown in green, and negative in red. The model shows that increased awareness of the problems can reduce resistance and increase adoption.

References

    1. Smith B., Ashburner M., Rosse C. et al. (2007) The OBO Foundry: coordinated evolution of ontologies to support biomedical data integration. Nat. Biotechnol., 25, 1251–1255. - PMC - PubMed
    1. Dahdul W.T., Dececchi A., Ibrahim N. et al. (2015) Moving the mountain: analysis of the effort required to transform comparative anatomy into computable anatomy. Database (Oxford), 2015.doi: 10.1093/database/bav040. - DOI - PMC - PubMed
    1. Mabee P.M., Ashburner M., Cronk Q. et al. (2007) Phenotype ontologies: the bridge between genomics and evolution. Trends Ecol. Evol., 22, 345–350. - PubMed
    1. Leveille-Bourret E., Chen B., Garon-Labrecque M. et al. (2020) RAD sequencing resolves the phylogeny, taxonomy and biogeography of Trichophoreae despite a recent rapid radiation (Cyperaceae). Mol. Phylogenet. Evol., 145.doi: 10.1016/j.ympev.2019.106727. - DOI - PubMed
    1. Scotland R., Olmstead R. and Bennett J. (2003) Phylogeny reconstruction: the role of morphology. Syst. Biol., 52, 539–548. - PubMed

Publication types