

A2B-COVID: A Tool for Rapidly Evaluating Potential SARS-CoV-2 Transmission Events
- PMID: 35106603
- PMCID: PMC8892943
- DOI: 10.1093/molbev/msac025
A2B-COVID: A Tool for Rapidly Evaluating Potential SARS-CoV-2 Transmission Events
Abstract
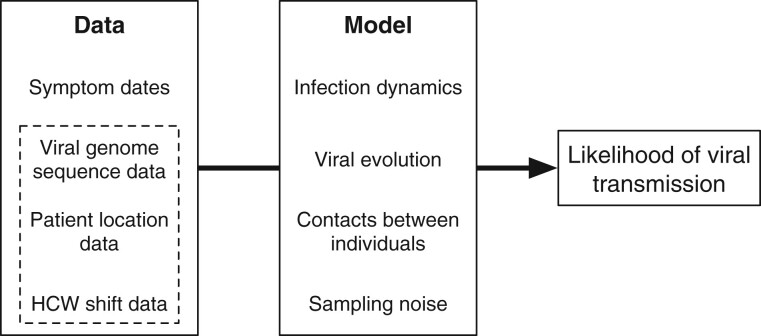
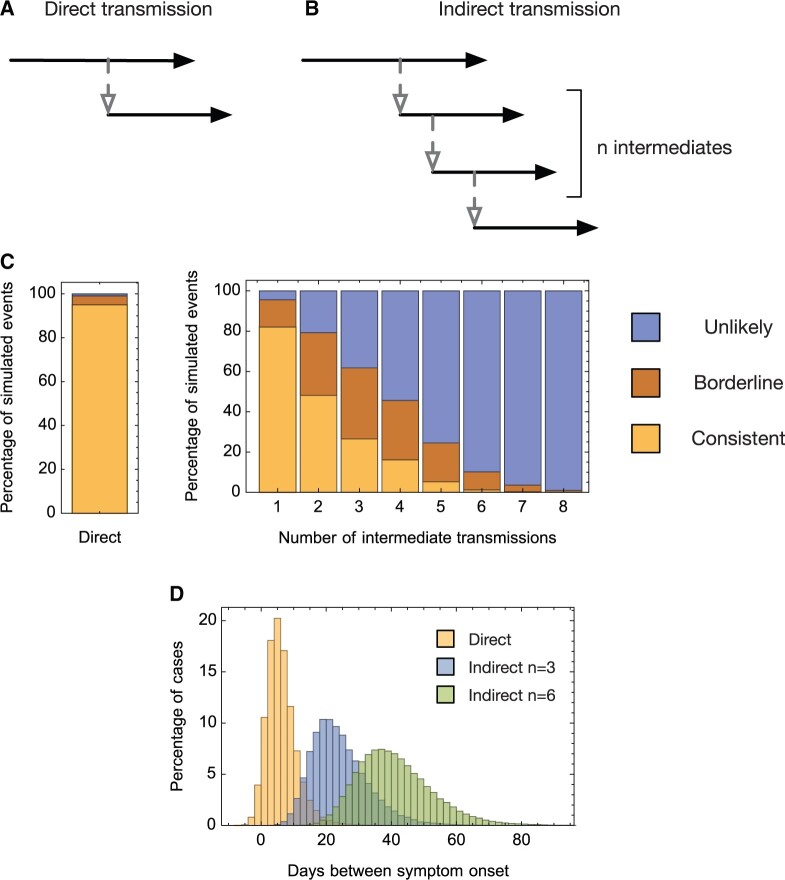
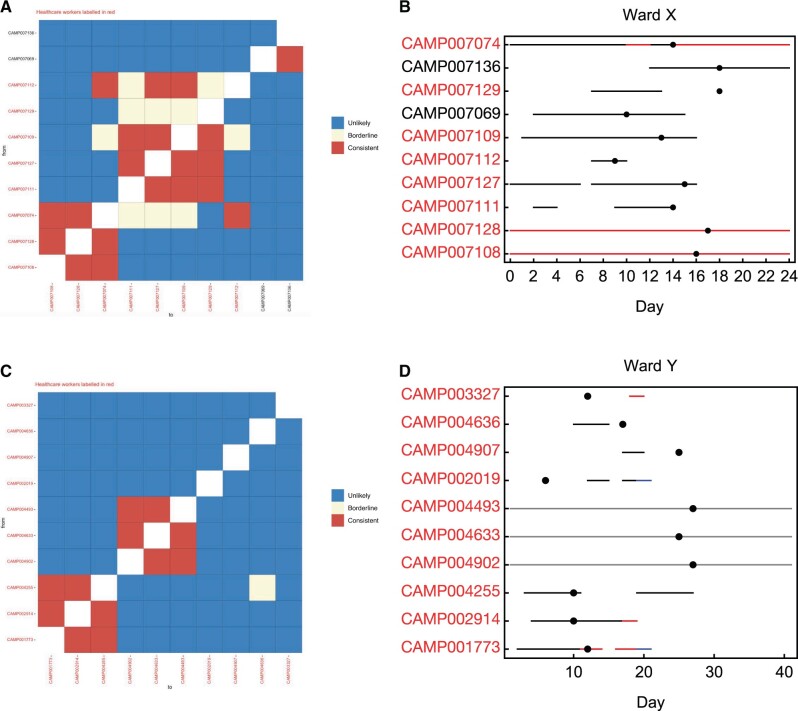
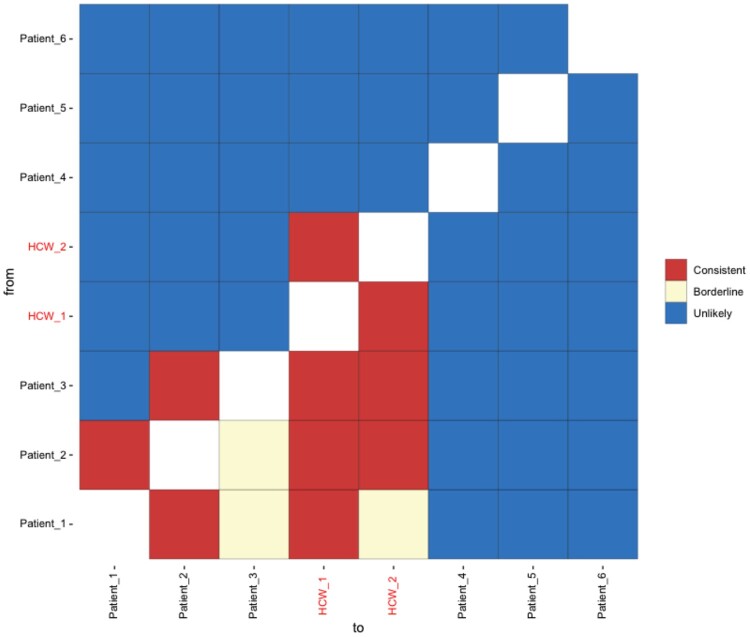
Identifying linked cases of infection is a critical component of the public health response to viral infectious diseases. In a clinical context, there is a need to make rapid assessments of whether cases of infection have arrived independently onto a ward, or are potentially linked via direct transmission. Viral genome sequence data are of great value in making these assessments, but are often not the only form of data available. Here, we describe A2B-COVID, a method for the rapid identification of potentially linked cases of COVID-19 infection designed for clinical settings. Our method combines knowledge about infection dynamics, data describing the movements of individuals, and evolutionary analysis of genome sequences to assess whether data collected from cases of infection are consistent or inconsistent with linkage via direct transmission. A retrospective analysis of data from two wards at Cambridge University Hospitals NHS Foundation Trust during the first wave of the pandemic showed qualitatively different patterns of linkage between cases on designated COVID-19 and non-COVID-19 wards. The subsequent real-time application of our method to data from the second epidemic wave highlights its value for monitoring cases of infection in a clinical context.
Keywords: SARS-CoV-2; evolution; hospital; transmission.
© The Author(s) 2022. Published by Oxford University Press on behalf of the Society for Molecular Biology and Evolution.
Figures
References
-
- Ashcroft P, , HuismanJS, , LehtinenS, , BoumanJA, , AlthausCL, , RegoesRR, , Bonhoeffer S.. 2020. COVID-19 infectivity profile correction. Swiss Med Wkly. 150:w20336. - PubMed
-
- Baller A, Padoveze MC, Mirindi P, Hazim CE, Lotemo J, Pfaffmann J, Ndiaye A, Carter S, Chabrat M-AD, Mangala S, et al.2021. Ebola virus disease nosocomial infections in the Democratic Republic of the Congo: a descriptive study of cases during the 2018-2020 outbreak. Int J Infect Dis. 115:126–133. - PMC - PubMed
-
- Beerenwinkel N, Zagordi O.. 2011. Ultra-deep sequencing for the analysis of viral populations. Curr Opin Virol. 1(5):413–418. - PubMed
Publication types
MeSH terms
Grants and funding
- 207498/Z/17/Z/WT_/Wellcome Trust/United Kingdom
- MR/V038613/1/MRC_/Medical Research Council/United Kingdom
- Medical Research Council (MRC)
- MR/V038613/1/UKRI through the JUNIPER modeling consortium
- 1310/Deutsche Forschungsgemeinschaft (DFG)
- MC_PC_19026/MRC_/Medical Research Council/United Kingdom
- 215515/Z/19/Z/Senior Research Fellowship
- 204870/Z/16/Z/WT_/Wellcome Trust/United Kingdom
- NIHR Health Protection Units in Behavioural Science and Evaluation
- MC_UU_00002/11/UKRI Medical Research Council funding (Unit Programme
- National Institute of Health Research (NIHR) and Genome Research Limited
- 204870/Z/16/Z/Collaborative Grant
- NIHR Cambridge Biomedical Research Centre
- 108070/Z/15/Z/Wellcome Sanger Institute; We also acknowledge the support from the Wellcome [Senior Clinical Fellowship
- UK Research & Innovation (UKRI)
- MR/N029399/1/MRC_/Medical Research Council/United Kingdom
- MC_UU_12014/12/MRC_/Medical Research Council/United Kingdom
- NIHR Clinical Research Network Greenshoots
- MC_UU_00002/11/MRC_/Medical Research Council/United Kingdom
- Academy of Medical Sciences & the Health Foundation (Clinician Scientist Fellowship
- 207498/Z/17/Z/Senior Fellowship
LinkOut - more resources
Full Text Sources
Medical
Miscellaneous
