. 2022 Feb 23;10(1):e0165521.
doi: 10.1128/spectrum.01655-21. Epub 2022 Feb 2.

Evolution of Viral Pathogens Follows a Linear Order

Affiliations

Evolution of Viral Pathogens Follows a Linear Order

Zi Hian Tan et al. Microbiol Spectr. .

Abstract

Although lessons have been learned from previous severe acute respiratory syndrome (SARS) and Middle East respiratory syndrome (MERS) outbreaks, the rapid evolution of the viruses means that future outbreaks of a much larger scale are possible, as shown by the current coronavirus disease 2019 (COVID-19) outbreak. Therefore, it is necessary to better understand the evolution of coronaviruses as well as viruses in general. This study reports a comparative analysis of the amino acid usage within several key viral families and genera that are prone to triggering outbreaks, including coronavirus (severe acute respiratory syndrome coronavirus 2 [SARS-CoV-2], SARS-CoV, MERS-CoV, human coronavirus-HKU1 [HCoV-HKU1], HCoV-OC43, HCoV-NL63, and HCoV-229E), influenza A (H1N1 and H3N2), flavivirus (dengue virus serotypes 1 to 4 and Zika) and ebolavirus (Zaire, Sudan, and Bundibugyo ebolavirus). Our analysis reveals that the distribution of amino acid usage in the viral genome is constrained to follow a linear order, and the distribution remains closely related to the viral species within the family or genus. This constraint can be adapted to predict viral mutations and future variants of concern. By studying previous SARS and MERS outbreaks, we have adapted this naturally occurring pattern to determine that although pangolin plays a role in the outbreak of COVID-19, it may not be the sole agent as an intermediate animal. In addition to this study, our findings contribute to the understanding of viral mutations for subsequent development of vaccines and toward developing a model to determine the source of the outbreak. IMPORTANCE This study reports a comparative analysis of amino acid usage within several key viral genera that are prone to triggering outbreaks. Interestingly, there is evidence that the amino acid usage within the viral genomes is not random but in a linear order.

Keywords: SARS-CoV-2; infectious disease; linear order; microbiology; outbreak; viral pathogen.


Conflict of interest statement

The authors declare no conflict of interest.

Figures

FIG 1
FIG 1
All viral CDS a and b parameters from fitting exponential and quanta functions are represented as a scatterplot. Each viral CDS with a fitted parameter is represented by a data point. The black diagonal line represents the linear regression of all data points. Overall, the viral CDS exponential and quanta function parameters show a linear relationship.
FIG 2
FIG 2
Distribution of quanta parameters of four selected viral families in the context of all viruses (gray). Representative viral species are influenza A (H1N1 and H3N2), flavivirus (dengue virus serotypes 1 to 4 and Zika), ebolavirus (Zaire, Sudan, and Bundibugyo ebolavirus), and coronavirus (SARS-CoV-2, SARS-CoV, MERS-CoV, HCoV-HKU1, HCoV-OC43, HCoV-NL63, and HCoV-229E).
FIG 3
FIG 3
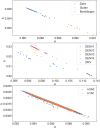
Distribution of individual subgroups of viruses. Top, ebolaviruses. Zaire strains have close distribution. Sudan and Bundibugyo strains with lesser sequences have a more dispersed distribution. Middle, flaviviruses. Most dengue viruses are clustered together (red circle), with serotypes 1 to 4 showing further clustering. Serotypes 1, 2, and 3 exhibit several outliers. These outliers follow a pattern of linear distribution and clustering. Zika virus is clustered distinctly near the major dengue group. Bottom, influenza A. H1N1 and H3N2 do not exhibit a distinct cluster.
FIG 4
FIG 4
Distribution of coronavirus subgroup. Each species of coronavirus is grouped along a straight line with three (one SARS-CoV-2 and two MERS-CoV) outliers. Most of SARS-CoV-2 are clustered close to SARS-CoV.
FIG 5
FIG 5
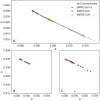
Spike protein quanta distribution of SARS-CoV-2, SARS-CoV, and MERS-CoV. (A) Spike distribution for all coronaviruses from NCBI GenBank. The three major coronavirus spike proteins show distinct groupings. The SARS-CoV-2 spike protein cluster is closer to SARS-CoV than to MERS-CoV. (B, C) The focused view of SARS-CoV-2 and SARS-CoV spike proteins (B) shows a tighter and distinct clustering than the whole-genome CDS (C).
FIG 6
FIG 6
Close-up view of SARS-CoV spike protein quanta parameter distribution. SARS-CoV spike proteins are distributed near bat coronavirus spike proteins (Rhinolophus and Hypsugo), civet (Viverridae and Paradoxurus hermaphroditus), mouse (Mus musculus), and grivet (Chlorocebus aethiops). SARS-CoV quanta parameters are grouped into late (red), early (green), and middle phases (orange) of epidemic. The late-phase sequences are separated, except for the single early phase sequence.
FIG 7
FIG 7
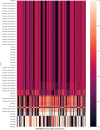
Normalized geometric distance heat map of the nearest 50 of 1,656 zoonic coronaviruses (vertical) and 44 SARS-CoV spike sequences (horizontal). The heat map value represents the distance between human SARS-CoV and the zoonic coronavirus spike protein quanta parameter. The lower value (black) indicates that the zoonic coronavirus and human SARS-CoV spike quanta parameters are closest. The scale is normalized within the nearest 50 samples. The majority of the near hosts are bat and small mammal groups, inclusive of the civet subfamily (Viverridae), Asian palm civet (Paradoxurus hermaphroditus), brown rat (Rattus norvegicus), and pangolin (Manis javanica, Pholidota). Mouse (Mus musculus) and grivet/African green monkey (Chlorocebus aethiops) are removed, as the viral samples are experimentally infected and do not represent natural hosts.
FIG 8
FIG 8
Close-up view of MERS-CoV spike protein quanta parameter distribution. MERS-CoV overlaps with camel coronavirus, indicating a close spike protein relation.
FIG 9
FIG 9
Normalized geometric distance heat map of the nearest 100 of 1,656 nonhuman coronaviruses (vertical) and 249 MERS-CoV spike sequences (horizontal). Camelus (camel) coronavirus spike protein is closest to the MERS-CoV spike protein.
FIG 10
FIG 10
Close-up view of spike sequence quanta parameter distribution centered on the SARS-CoV-2 reference genome (NC_045512.2). The closest coronavirus host belongs to bats with the next nearest non-bat hosts (bold), Malayan pangolin (Manis javanica), the general pangolin order (Pholidota), and the Amur hedgehog (Erinaceus amurensis) and bat order (Chiroptera) and intermediate horseshoe bat (Rhinolophus affinis), vesper bat (Pipistrellus kuhlii), Chinese rufous horseshoe bat (Rhinolophus sinicus), big-eared horseshoe bat (Rhinolophus macrotis), and Stoliczka’s trident bat (Aselliscus stoliczkanus).
FIG 11
FIG 11
Normalized geometric distance heat map of the nearest 20 of 1,656 nonhuman coronaviruses (vertical) and 1,743 SARS-CoV-2 spike sequences (horizontal). The nearest host is bat (Rhinolophus, Pipistrellus, Aselliscus), followed by pangolin (Manis javanica, Pholidota) and hedgehog (Erinaceus amurensis). The first six hosts are closer to SARS-CoV-2 (above blue line), and all six closest hosts are bats. Pangolin lies below the blue line.
FIG 12
FIG 12
Distribution of flavivirus subgroups. Several sequences deviate from the main linear line (solid black). However, the deviation is not random but forms parallel lines (gray lines).
FIG 13
FIG 13
Amino acid usage distribution of each viral CDS, excluding stop codons. Top, the amino acid usage distribution for each viral sequence was determined and represented as a percentage of the total amount of amino acid coded. The distribution was arranged from highest to lowest amino acid frequencies, represented by rank 1 to 20, respectively, as the amino acid preference of each virus differs. The distribution of every viral sequence at each rank is represented by a box plot. Rank 1 (most frequent amino acid) shows the largest amount of distribution, where ranks 4 to 20 are consistent. Bottom, the black dots represent the mean frequency of each rank. The selected four (quanta, logarithmic, power, and exponential) curves fit the mean distribution.
FIG 14
FIG 14
Distribution of Pearson correlation coefficient values of each curve-fitting function to viral CDS. Exponential and quanta functions exhibit similar distributions, with a narrow distribution (0.95 to 1.00) near the median value of 0.98. Logarithmic and power functions have a wider distribution spread out across 0.75 to 1.00. Exponential and quanta functions are a better and more consistent fit for all viral sequences.

References

    1. Guan W, Ni Z, Hu Y, Liang W, Ou C, He J, Liu L, Shan H, Lei C, Hui DSC, Du B, Li L, Zeng G, Yuen K-Y, Chen R, Tang C, Wang T, Chen P, Xiang J, Li S, Wang J-L, Liang Z, Peng Y, Wei L, Liu Y, Hu Y-H, Peng P, Wang J-M, Liu J, Chen Z, Li G, Zheng Z, Qiu S, Luo J, Ye C, Zhu S, Zhong N, China Medical Treatment Expert Group for Covid-19 . 2020. Clinical characteristics of coronavirus disease 2019 in China. N Engl J Med 382:1708–1720. doi:10.1056/NEJMoa2002032. - DOI - PMC - PubMed
    1. Zhu N, Zhang DY, Wang WL, Li XW, Yang B, Song JD, Zhao X, Huang BY, Shi WF, Lu RJ, Niu PH, Zhan FX, Ma XJ, Wang DY, Xu WB, Wu GZ, Gao GF, Tan WJ, China Novel Coronavirus Investigating and Research Team . 2020. A novel coronavirus from patients with pneumonia in China, 2019. N Engl J Med 382:727–733. doi:10.1056/NEJMoa2001017. - DOI - PMC - PubMed
    1. Wu F, Zhao S, Yu B, Chen Y-M, Wang W, Song Z-G, Hu Y, Tao Z-W, Tian J-H, Pei Y-Y, Yuan M-L, Zhang Y-L, Dai F-H, Liu Y, Wang Q-M, Zheng J-J, Xu L, Holmes EC, Zhang Y-Z. 2020. A new coronavirus associated with human respiratory disease in China. Nature 579:265–269. doi:10.1038/s41586-020-2008-3. - DOI - PMC - PubMed
    1. Zhou P, Yang X-L, Wang X-G, Hu B, Zhang L, Zhang W, Si H-R, Zhu Y, Li B, Huang C-L, Chen H-D, Chen J, Luo Y, Guo H, Jiang R-D, Liu M-Q, Chen Y, Shen X-R, Wang X, Zheng X-S, Zhao K, Chen Q-J, Deng F, Liu L-L, Yan B, Zhan F-X, Wang Y-Y, Xiao G-F, Shi Z-L. 2020. A pneumonia outbreak associated with a new coronavirus of probable bat origin. Nature 579:270–273. doi:10.1038/s41586-020-2012-7. - DOI - PMC - PubMed
    1. Lu RJ, Zhao X, Li J, Niu PH, Yang B, Wu HL, Wang WL, Song H, Huang BY, Zhu N, Bi YH, Ma XJ, Zhan FX, Wang L, Hu T, Zhou H, Hu ZH, Zhou WM, Zhao L, Chen J, Meng Y, Wang J, Lin Y, Yuan JY, Xie ZH, Ma JM, Liu WJ, Wang DY, Xu WB, Holmes EC, Gao GF, Wu GZ, Chen WJ, Shi WF, Tan WJ. 2020. Genomic characterisation and epidemiology of 2019 novel coronavirus: implications for virus origins and receptor binding. Lancet 395:565–574. doi:10.1016/S0140-6736(20)30251-8. - DOI - PMC - PubMed

Publication types