. 2022 Feb 4;8(5):eabl6449.
doi: 10.1126/sciadv.abl6449. Epub 2022 Feb 2.

Injectable hydrogel microspheres with self-renewable hydration layers alleviate osteoarthritis

Affiliations

Injectable hydrogel microspheres with self-renewable hydration layers alleviate osteoarthritis

Yiting Lei et al. Sci Adv. .

Abstract

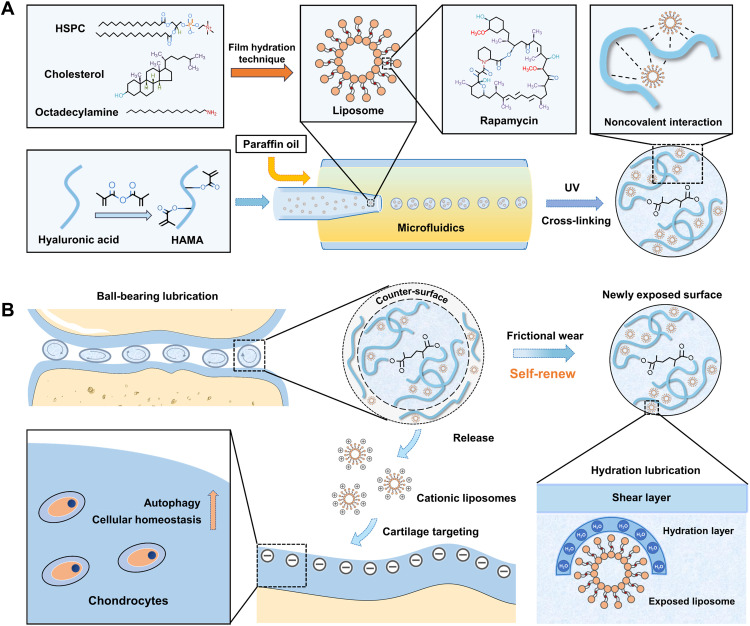
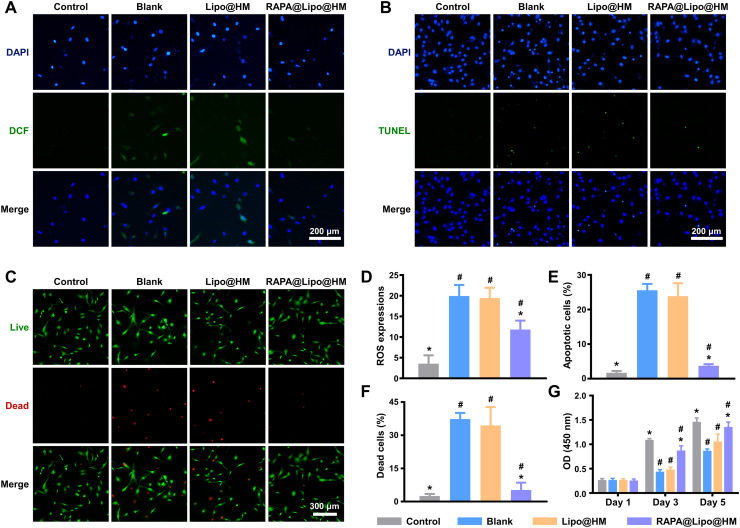
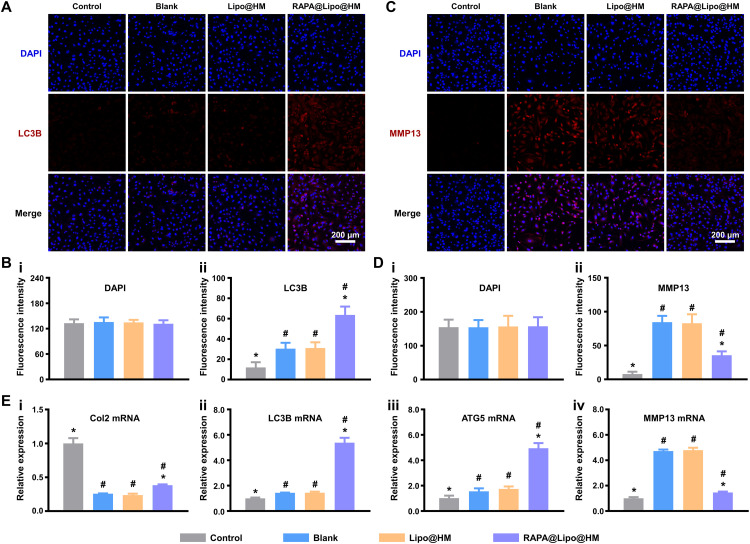
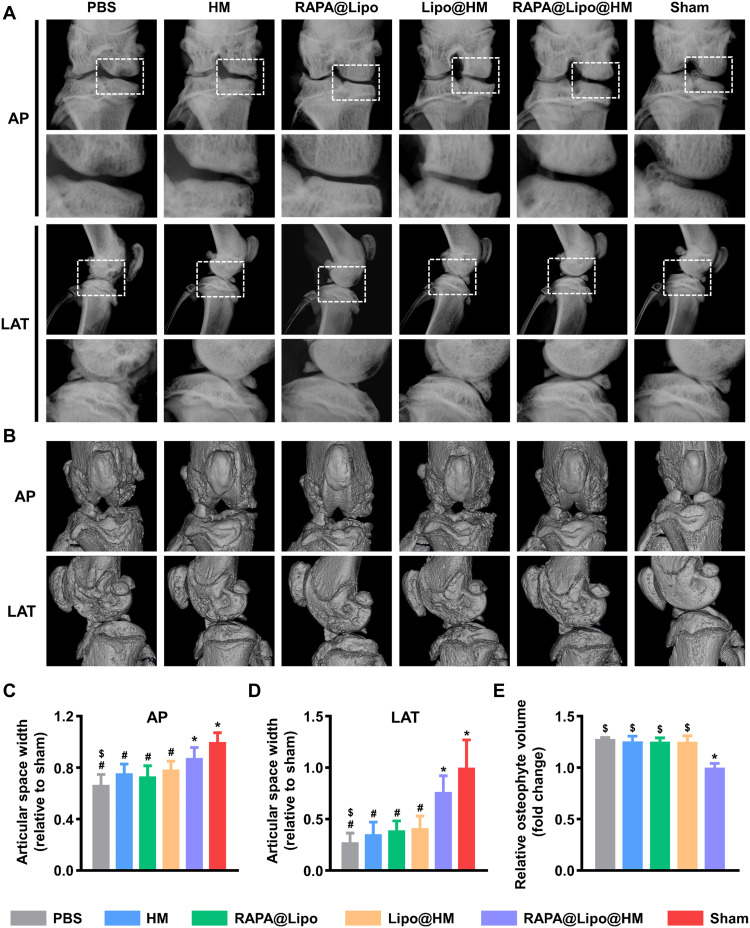
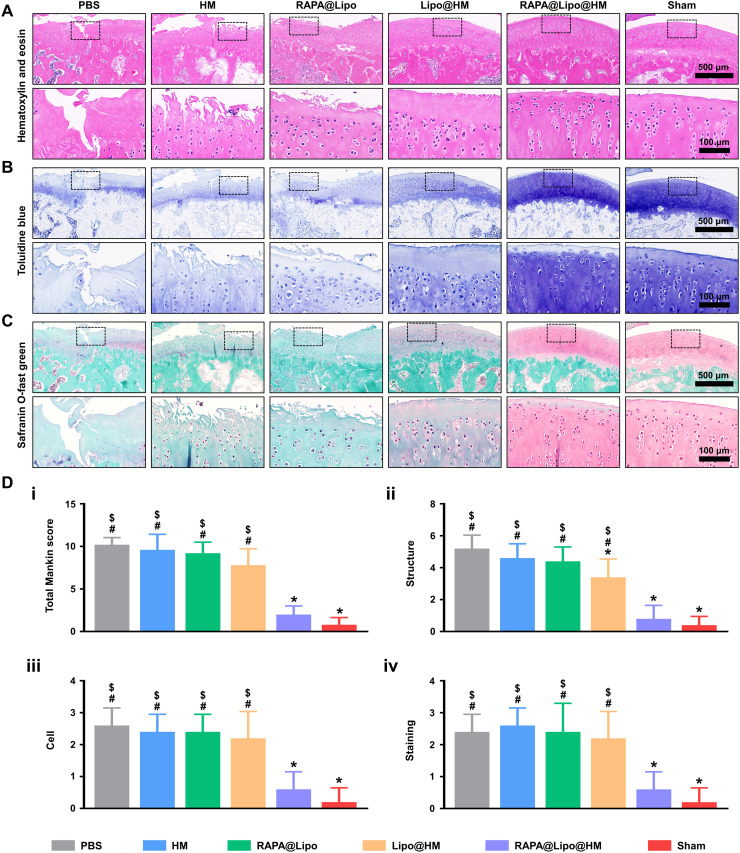
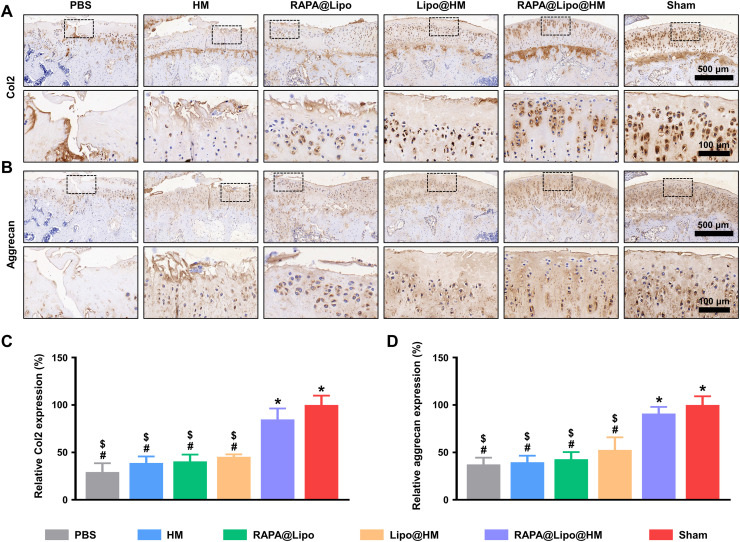
Introducing hydration layers to hydrogel microspheres (HMs) by coating the surface with liposomes can effectively reduce friction. However, the lubrication can be inactivated when the surface coatings are damaged. To endow HMs with the ability to form self-renewable hydration layers and maintain cellular homeostasis, rapamycin-liposome-incorporating hyaluronic acid-based HMs (RAPA@Lipo@HMs) were created using microfluidic technology and photopolymerization processes. The RAPA@Lipo@HMs improve joint lubrication by using a smooth rolling mechanism and continuously exposing liposomes on the outer surface to form self-renewable hydration layers via frictional wear. In addition, the released autophagy activator (rapamycin)-loaded cationic liposomes can target negatively charged cartilage through electrostatic interactions and maintain cellular homeostasis by increasing autophagy. Furthermore, the in vivo data showed that the RAPA@Lipo@HMs can alleviate joint wear and delay the progression of osteoarthritis. The RAPA@Lipo@HMs can provide efficient lubrication and potentially alleviate friction-related diseases such as osteoarthritis.


Figures

Fig. 1.
Fig. 1.. The principle and fabrication of RAPA@Lipo@HMs.
(A) The fabrication of RAPA@Lipos, photocrosslinkable HAMA matrix, and microfluidic RAPA@Lipo@HMs. (B) The design of RAPA@Lipo@HMs for treating osteoarthritis based on combining hydration lubrication and ball-bearing lubrication and maintaining cellular homeostasis.
Fig. 2.
Fig. 2.. Characterization of liposomes and Lipo@HMs.
(A) TEM image of the liposome. (B) Zeta potential distribution of liposomes. (C) Size distribution of liposomes. (D) Bright-field images of Lipo@HMs: (i) dispersed Lipo@HMs and (ii) mono-Lipo@HM. (E) Size distribution of Lipo@HMs. (F) LSCM images of Lipo@HMs: (i) dispersed Lipo@HMs, (ii) mono-Lipo@HM, and (iii) the z-stack fluorescent images of Lipo@HM.
Fig. 3.
Fig. 3.. Lubrication performances of Lipo@HMs.
(A) (i) Photograph and (ii) schematic of the UMT-3. PE, polyethylene. (B) COF-time curve for the newly prepared Lipo@HMs. (C) SEM images of newly prepared Lipo@HM from (i) the overall view and (ii and iii) the local view. The yellow arrow in the image indicates the location of liposome. (D) SEM images of the worn Lipo@HM from (i) the overall view and (ii and iii) the local view. (E) (i) COF-time curves and (ii) COF histograms for PBS, HMs, and the worn Lipo@HMs (# and * indicate P < 0.05 in comparison with the Lipo@HM and PBS groups, respectively). Photo credit: Yiting Lei, The First Affiliated Hospital of Chongqing Medical University.
Fig. 4.
Fig. 4.. Degradation, drug loading and release properties of Lipo@HMs, and biocompatibility of RAPA@Lipo@HMs.
(A) The degradation curve of Lipo@HMs. (B) Schematic of the mechanism for retarding the degradation process. (C) The encapsulation efficiency of RAPA in liposomes and Lipo@HMs. (D) Release curves of RAPA releasing from liposomes and Lipo@HMs. (E) Live (green)/Dead (red) fluorescence results on 1, 2, and 3 days. (F) Viable cell count obtained from the Live/Dead staining assay. (G) The CCK-8 results on 1, 2, and 3 days. OD, optical density.
Fig. 5.
Fig. 5.. RAPA@Lipo@HMs maintain cellular homeostasis.
(A) Intracellular ROS generation measured by DCF. (B) Cell apoptosis measured by TUNEL staining. (C) Cell death measured by Live/Dead assay. (D) Quantitative analysis of ROS expression based on DCF fluorescence intensity. (E) Quantitative analysis of apoptotic cell rate based on TUNEL fluorescence intensity. (F) Dead cell percentage obtained from the Live/Dead staining assay. (G) The CCK-8 results on 1, 3, and 5 days (# and * indicate P < 0.05 in comparison with the control and blank groups, respectively).
Fig. 6.
Fig. 6.. RAPA@Lipo@HMs enhance autophagy, promote anabolic, and inhibit catabolic.
(A) Representative immunofluorescence images of LC3B protein. (B) Quantification of (i) DAPI and (ii) LC3B fluorescences. (C) Representative immunofluorescence images of MMP13 protein. (D) Quantification of (i) DAPI and (ii) MMP13 fluorescences. (E) RT-PCR results showing the levels of (i) Col2, (ii) LC3B, (iii) ATG5, and (iv) MMP13 (# and * indicate P < 0.05 in comparison with the control and blank groups, respectively).
Fig. 7.
Fig. 7.. RAPA@Lipo@HMs reduce joint space narrowing and osteophyte formation.
(A) Representative x-ray images in anterior-posterior (AP) and lateral (LAT) view of the knee joint. (B) Representative micro-CT images in AP and LAT view of the knee joint. (C) The relative JSW measured from AP images. (D) The relative JSW measured from LAT images. (E) The relative osteophyte volume measured from micro-CT images (#, $, and * indicate P < 0.05 in comparison with the sham, RAPA@Lipo@HM, and PBS groups, respectively).
Fig. 8.
Fig. 8.. Histological staining.
(A) Representative images of HE staining, (B) toluidine blue staining, and (C) Safranin O-fast green staining from each group. (D) Histologic scoring of articular cartilage: (i) total Mankin scores and Mankin score presented as (ii) cartilage structure, (iii) cellular abnormalities, and (iv) matrix staining (#, $, and * indicate P < 0.05 in comparison with the sham, RAPA@Lipo@HM, and PBS groups, respectively).
Fig. 9.
Fig. 9.. Immunohistochemistry staining.
(A) Representative images of Col2 protein immunohistochemical staining. (B) Representative images of aggrecan protein immunohistochemical staining. (C) Quantification of relative Col2 expression. (D) Quantification of relative aggrecan expression (#, $, and * indicate P < 0.05 in comparison with the sham, RAPA@Lipo@HM, and PBS groups, respectively).

References

    1. Gaisinskaya-Kipnis A., Klein J., Normal and frictional interactions between liposome-bearing biomacromolecular bilayers. Biomacromolecules 17, 2591–2602 (2016). - PubMed
    1. Cooper B. G., Bordeianu C., Nazarian A., Snyder B. D., Grinstaff M. W., Active agents, biomaterials, and technologies to improve biolubrication and strengthen soft tissues. Biomaterials 181, 210–226 (2018). - PMC - PubMed
    1. Chen Z., Zhang F., Zhang H., Cheng L., Chen K., Shen J., Qi J., Deng L., He C., Santos H. A., Cui W., DNA-grafted hyaluronic acid system with enhanced injectability and biostability for photo-controlled osteoarthritis gene therapy. Adv. Sci. (Weinh) 8, 2004793 (2021). - PMC - PubMed
    1. Ji X., Yan Y., Sun T., Zhang Q., Wang Y., Zhang M., Zhang H., Zhao X., Glucosamine sulphate-loaded distearoyl phosphocholine liposomes for osteoarthritis treatment: Combination of sustained drug release and improved lubrication. Biomater. Sci. 7, 2716–2728 (2019). - PubMed
    1. Andablo-Reyes E., Yerani D., Fu M., Liamas E., Connell S., Torres O., Sarkar A., Microgels as viscosity modifiers influence lubrication performance of continuum. Soft Matter 15, 9614–9624 (2019). - PubMed