. 2022 Feb 2;14(630):eabj0324.
doi: 10.1126/scitranslmed.abj0324. Epub 2022 Feb 2.

NF-κB perturbation reveals unique immunomodulatory functions in Prx1+ fibroblasts that promote development of atopic dermatitis

Affiliations

NF-κB perturbation reveals unique immunomodulatory functions in Prx1+ fibroblasts that promote development of atopic dermatitis

Kang I Ko et al. Sci Transl Med. .

Abstract

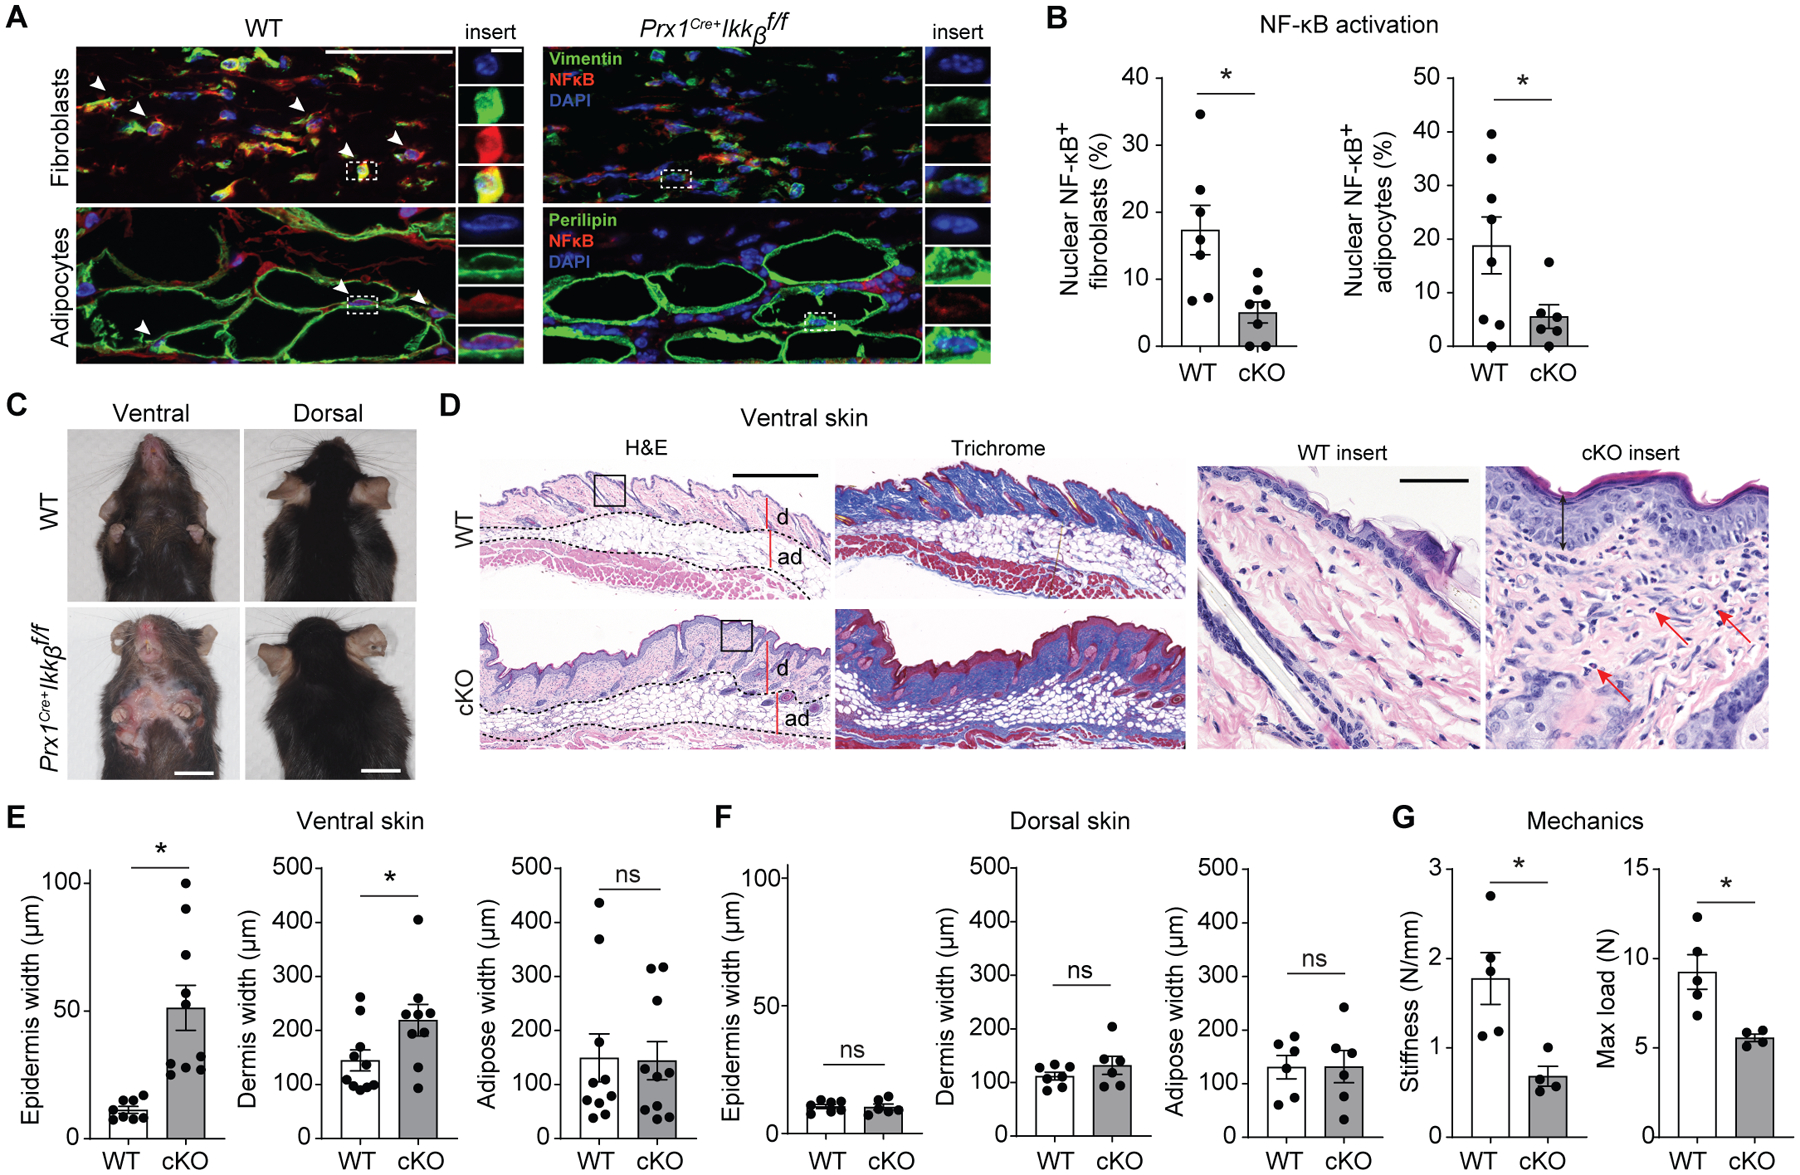
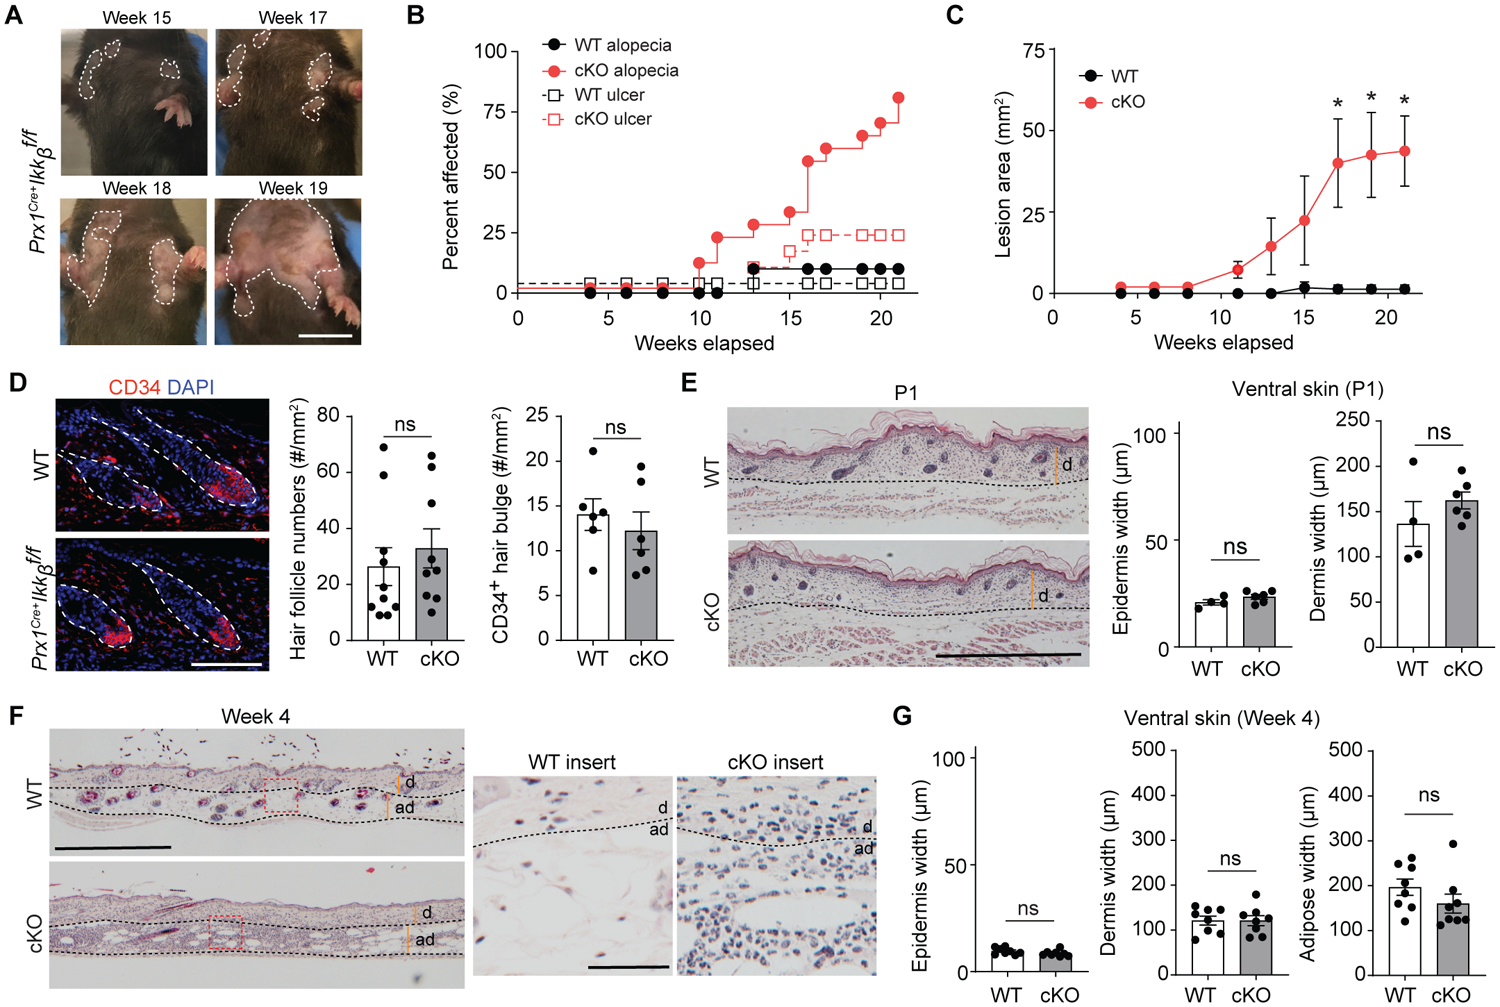
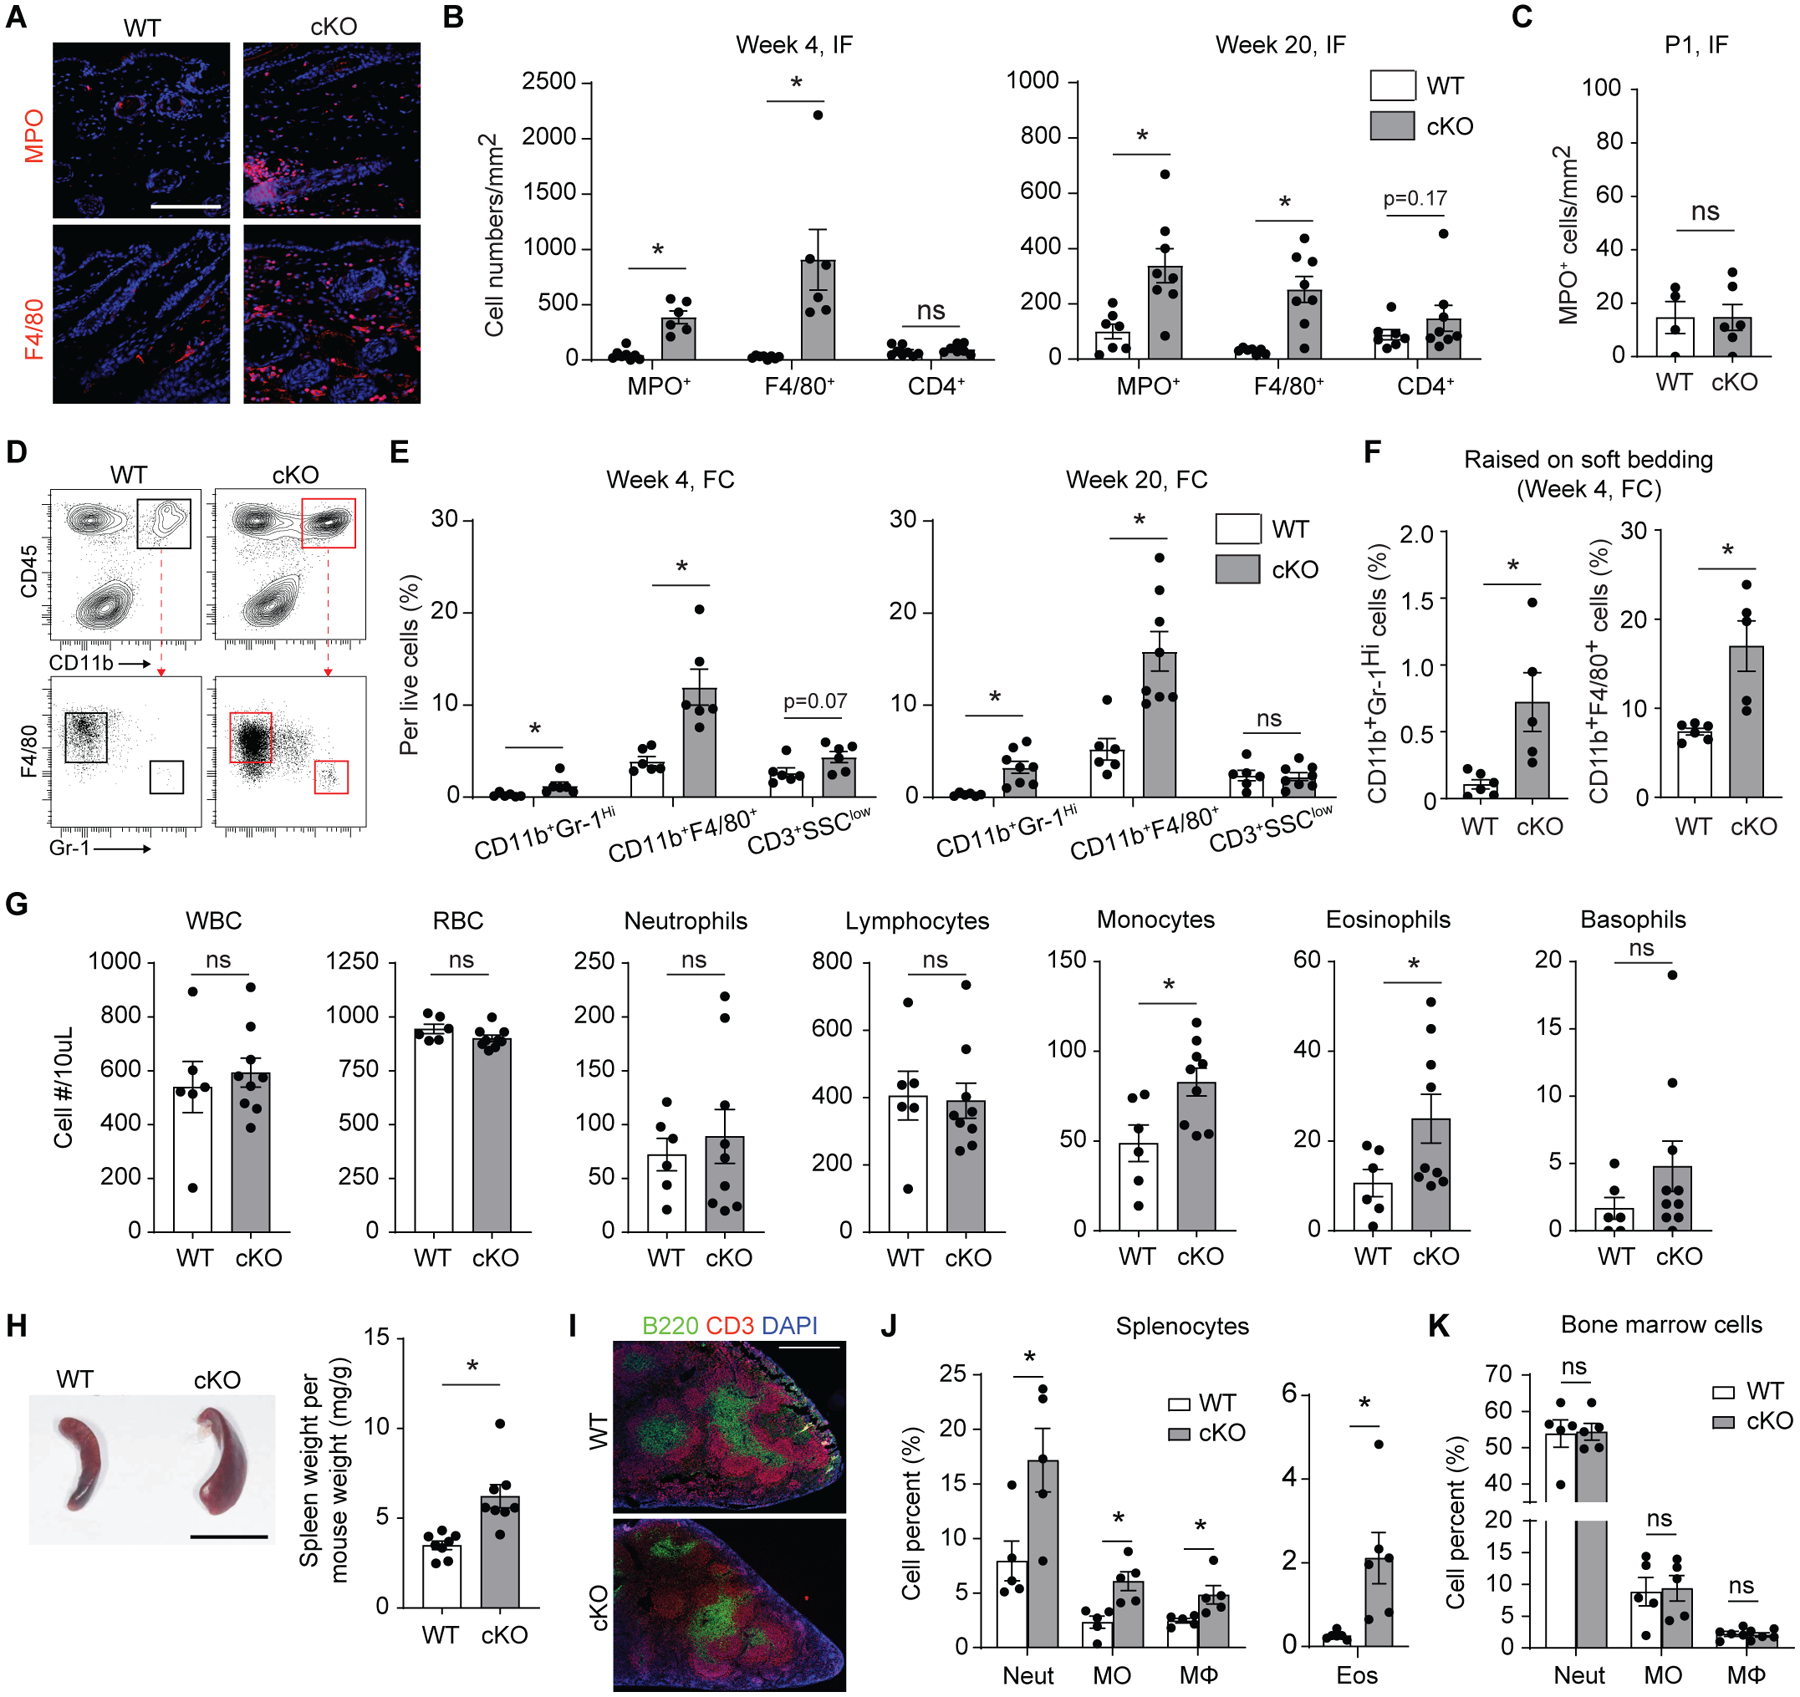
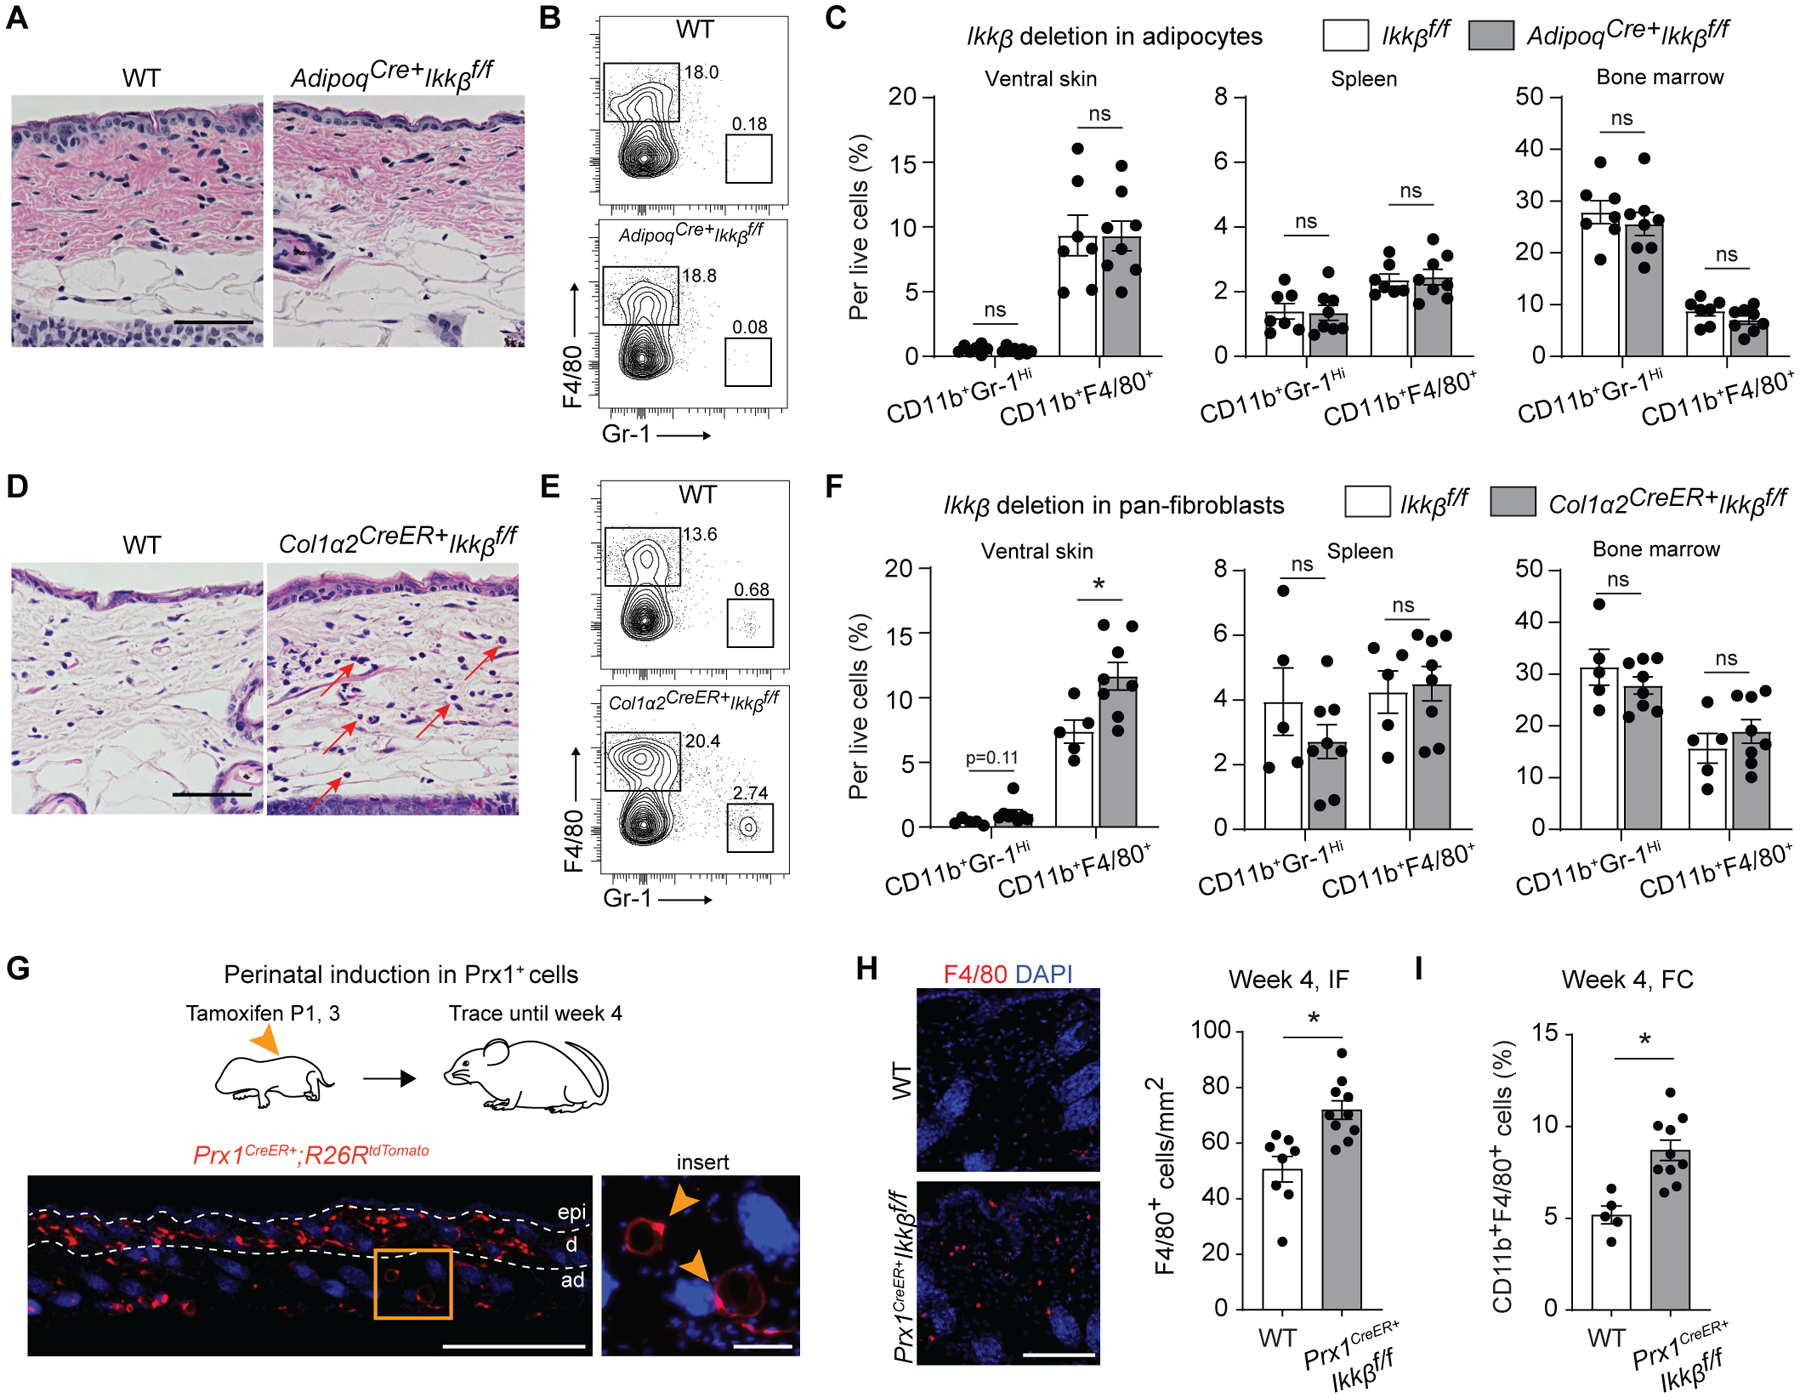
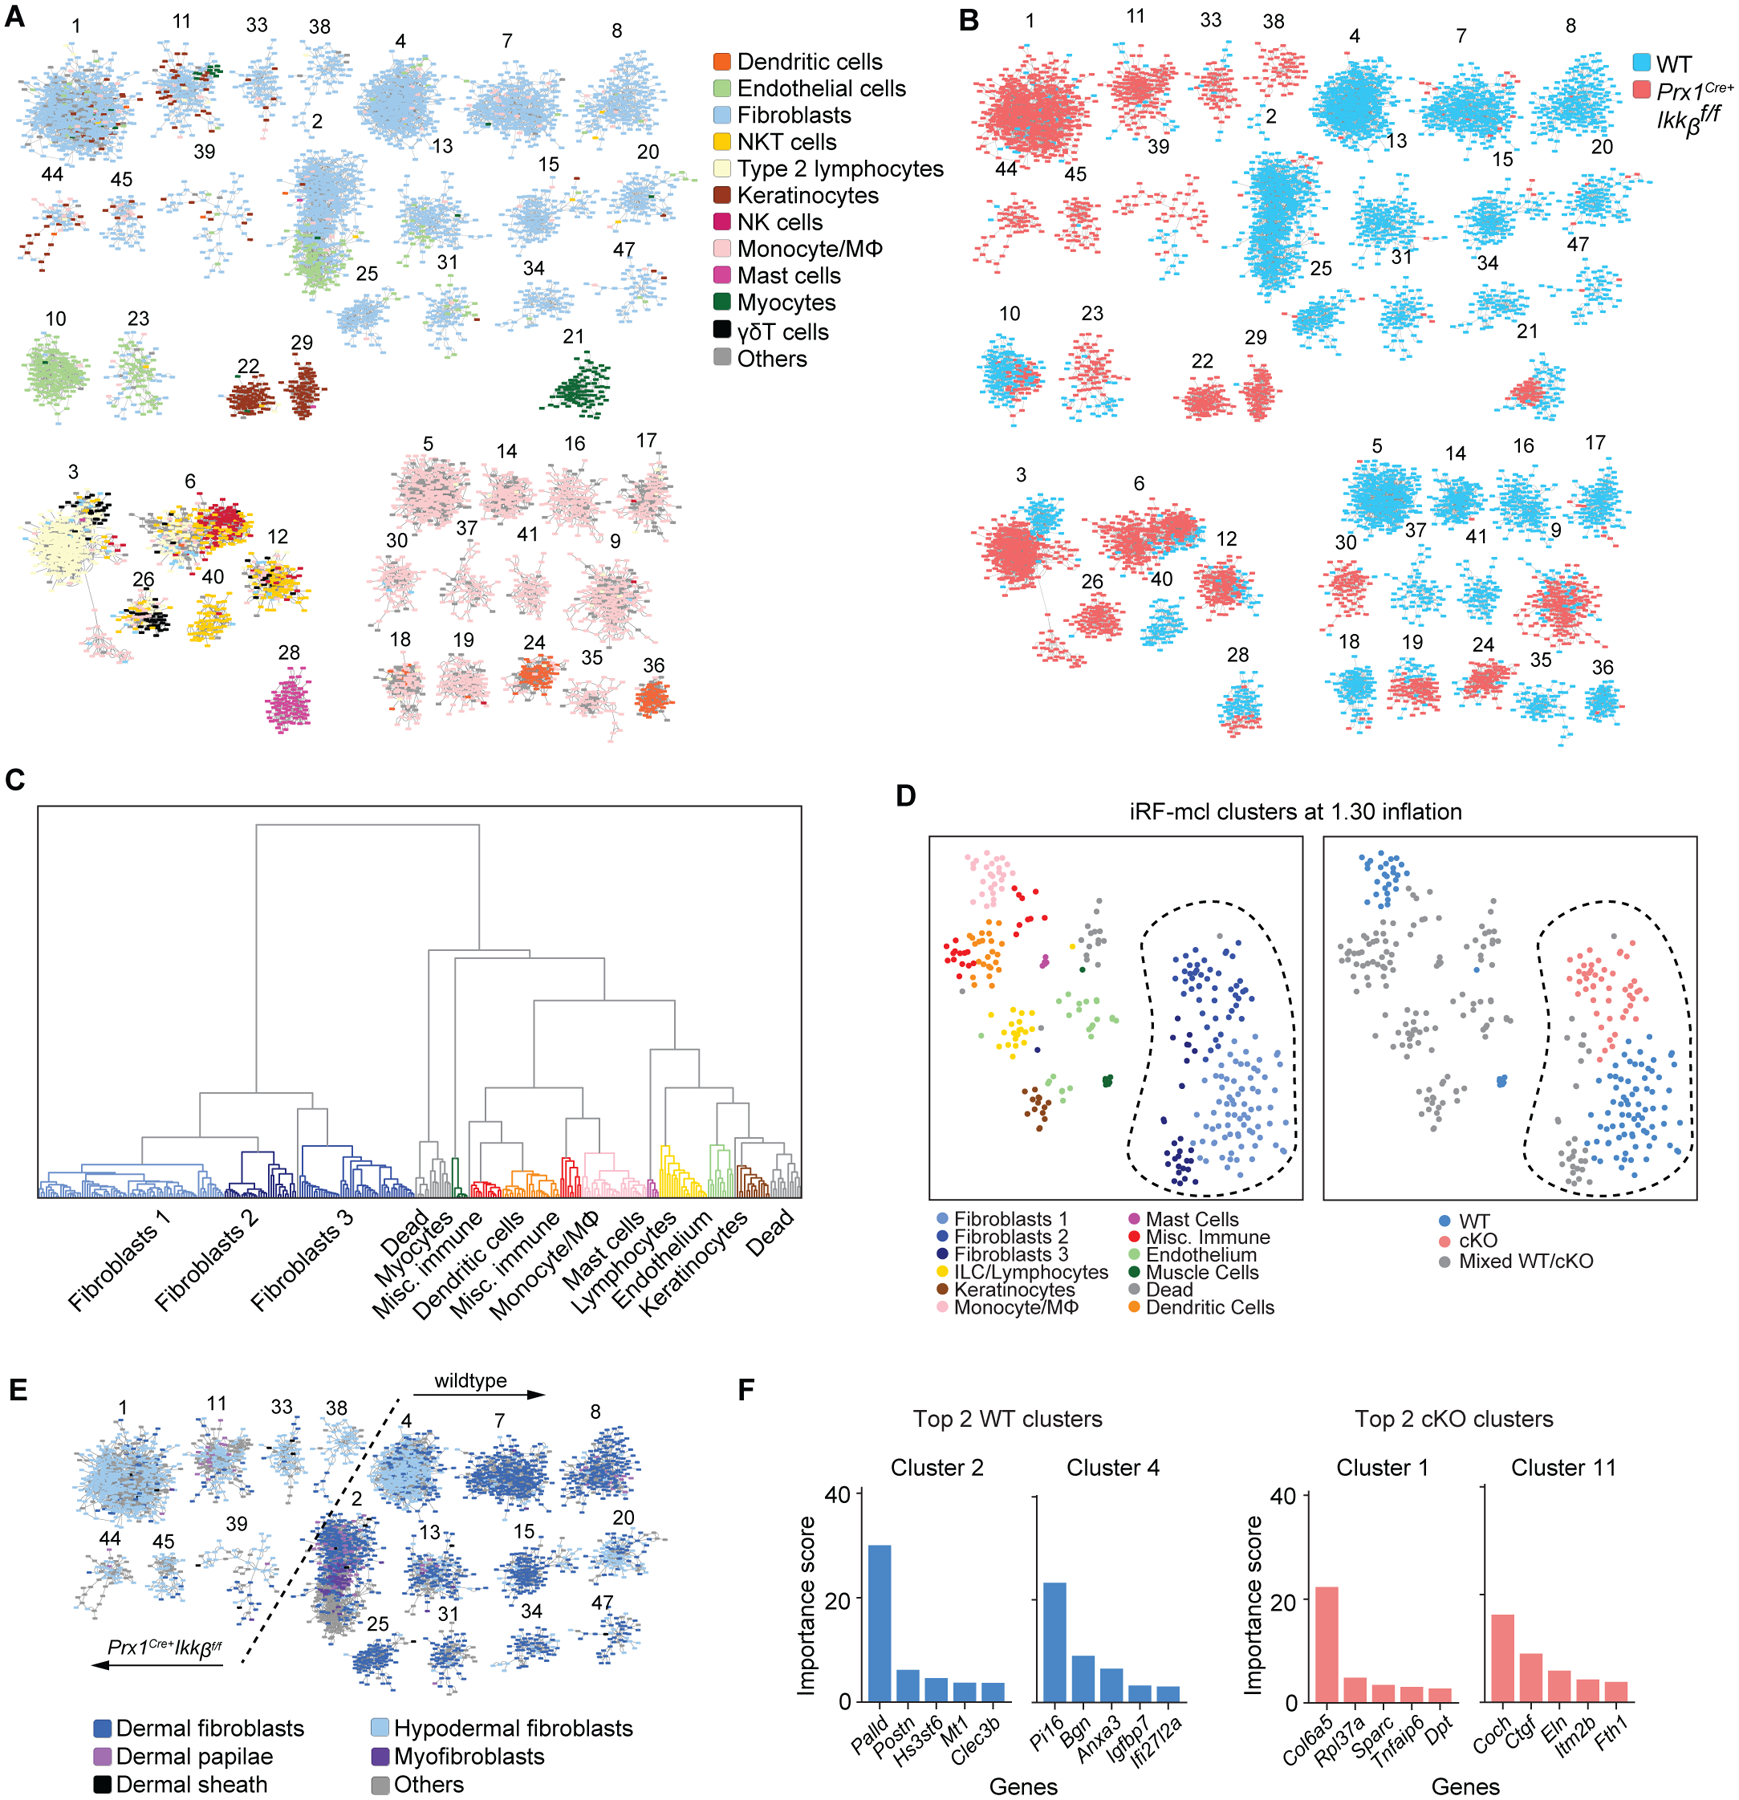
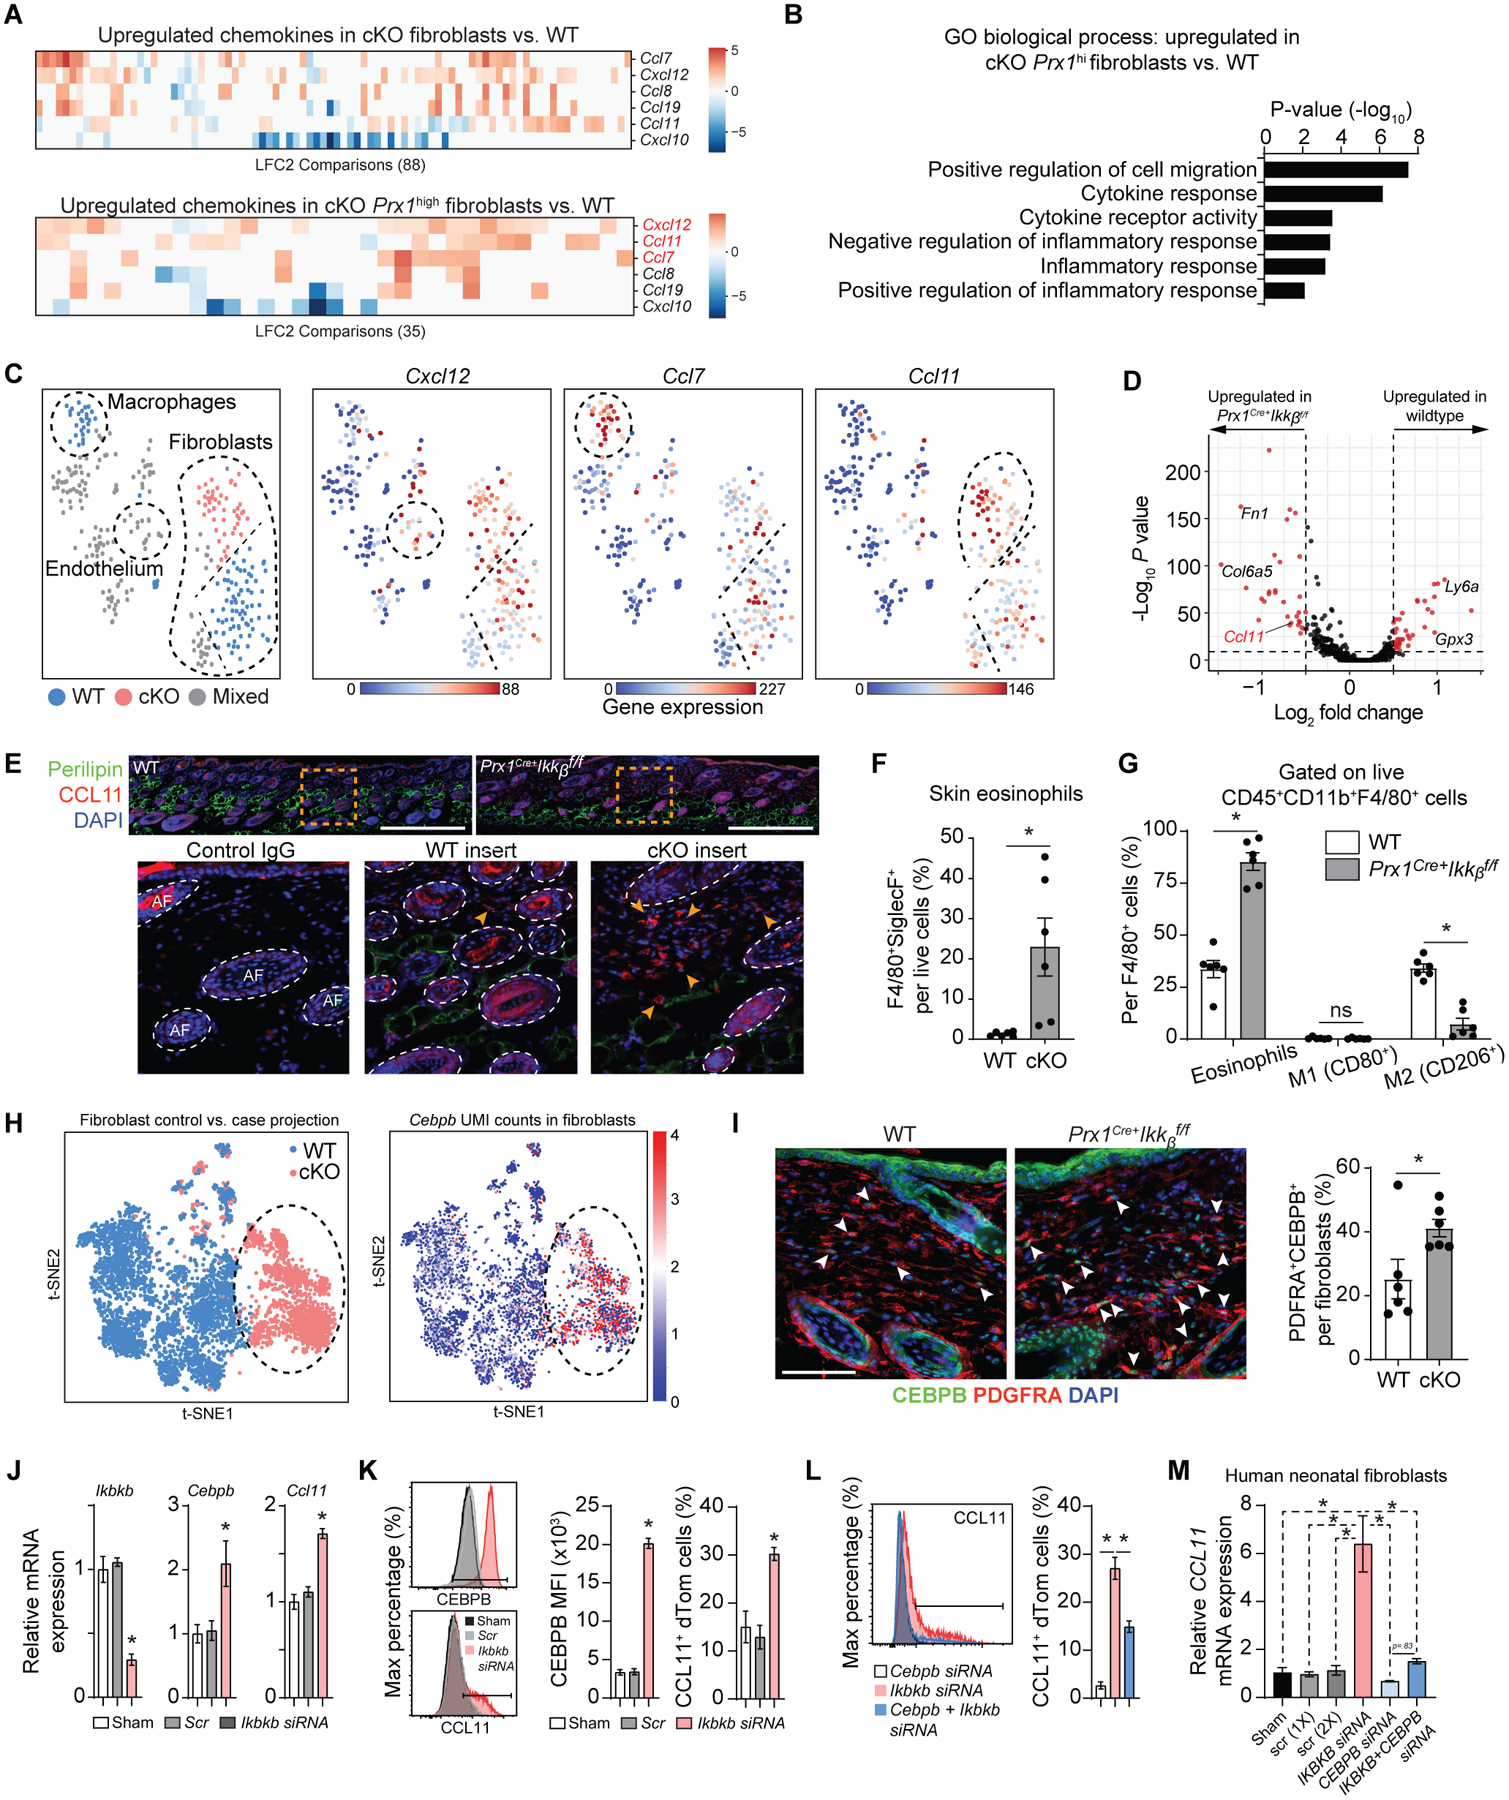
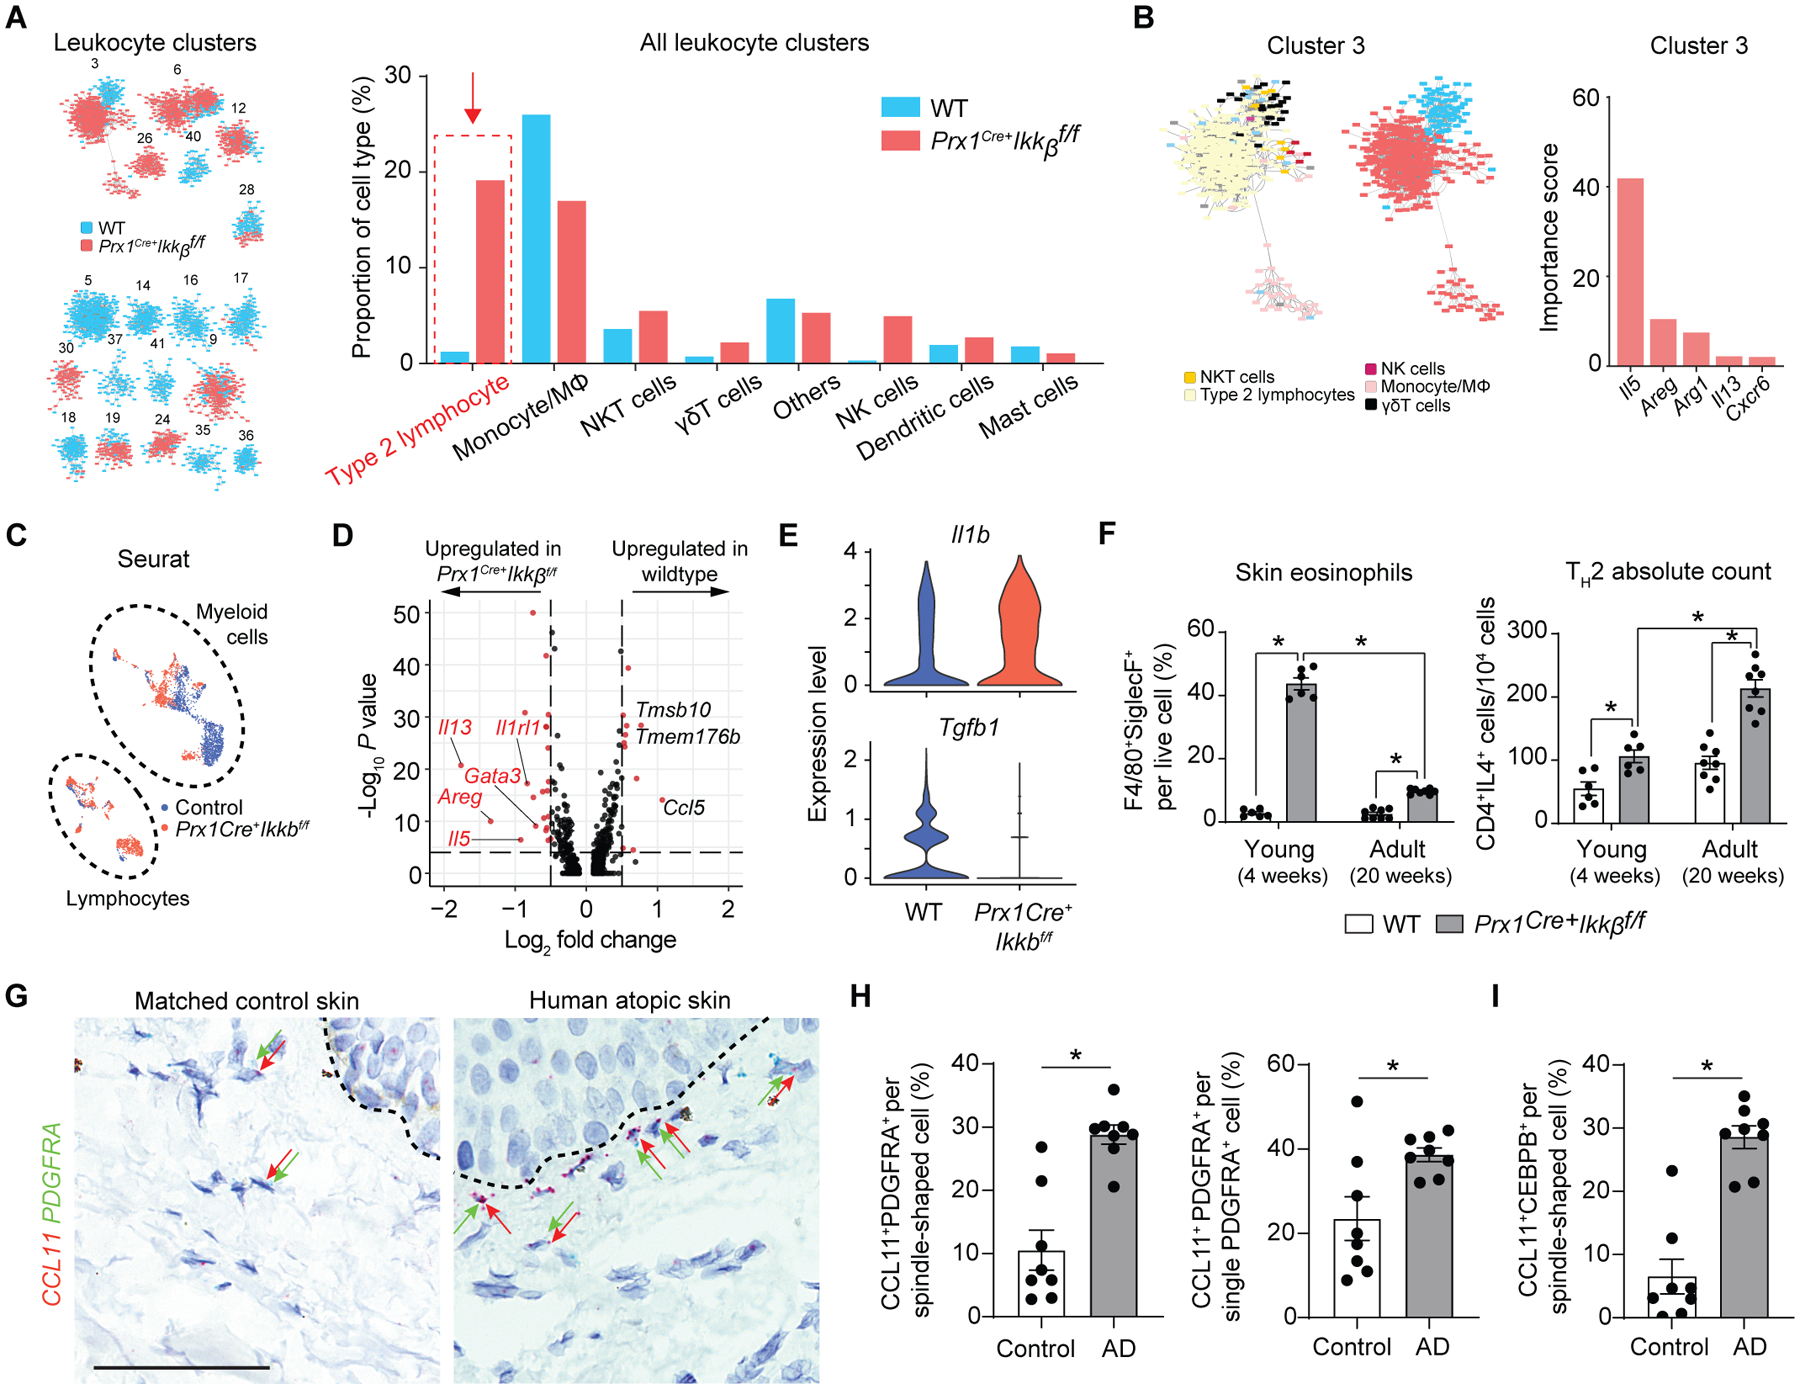
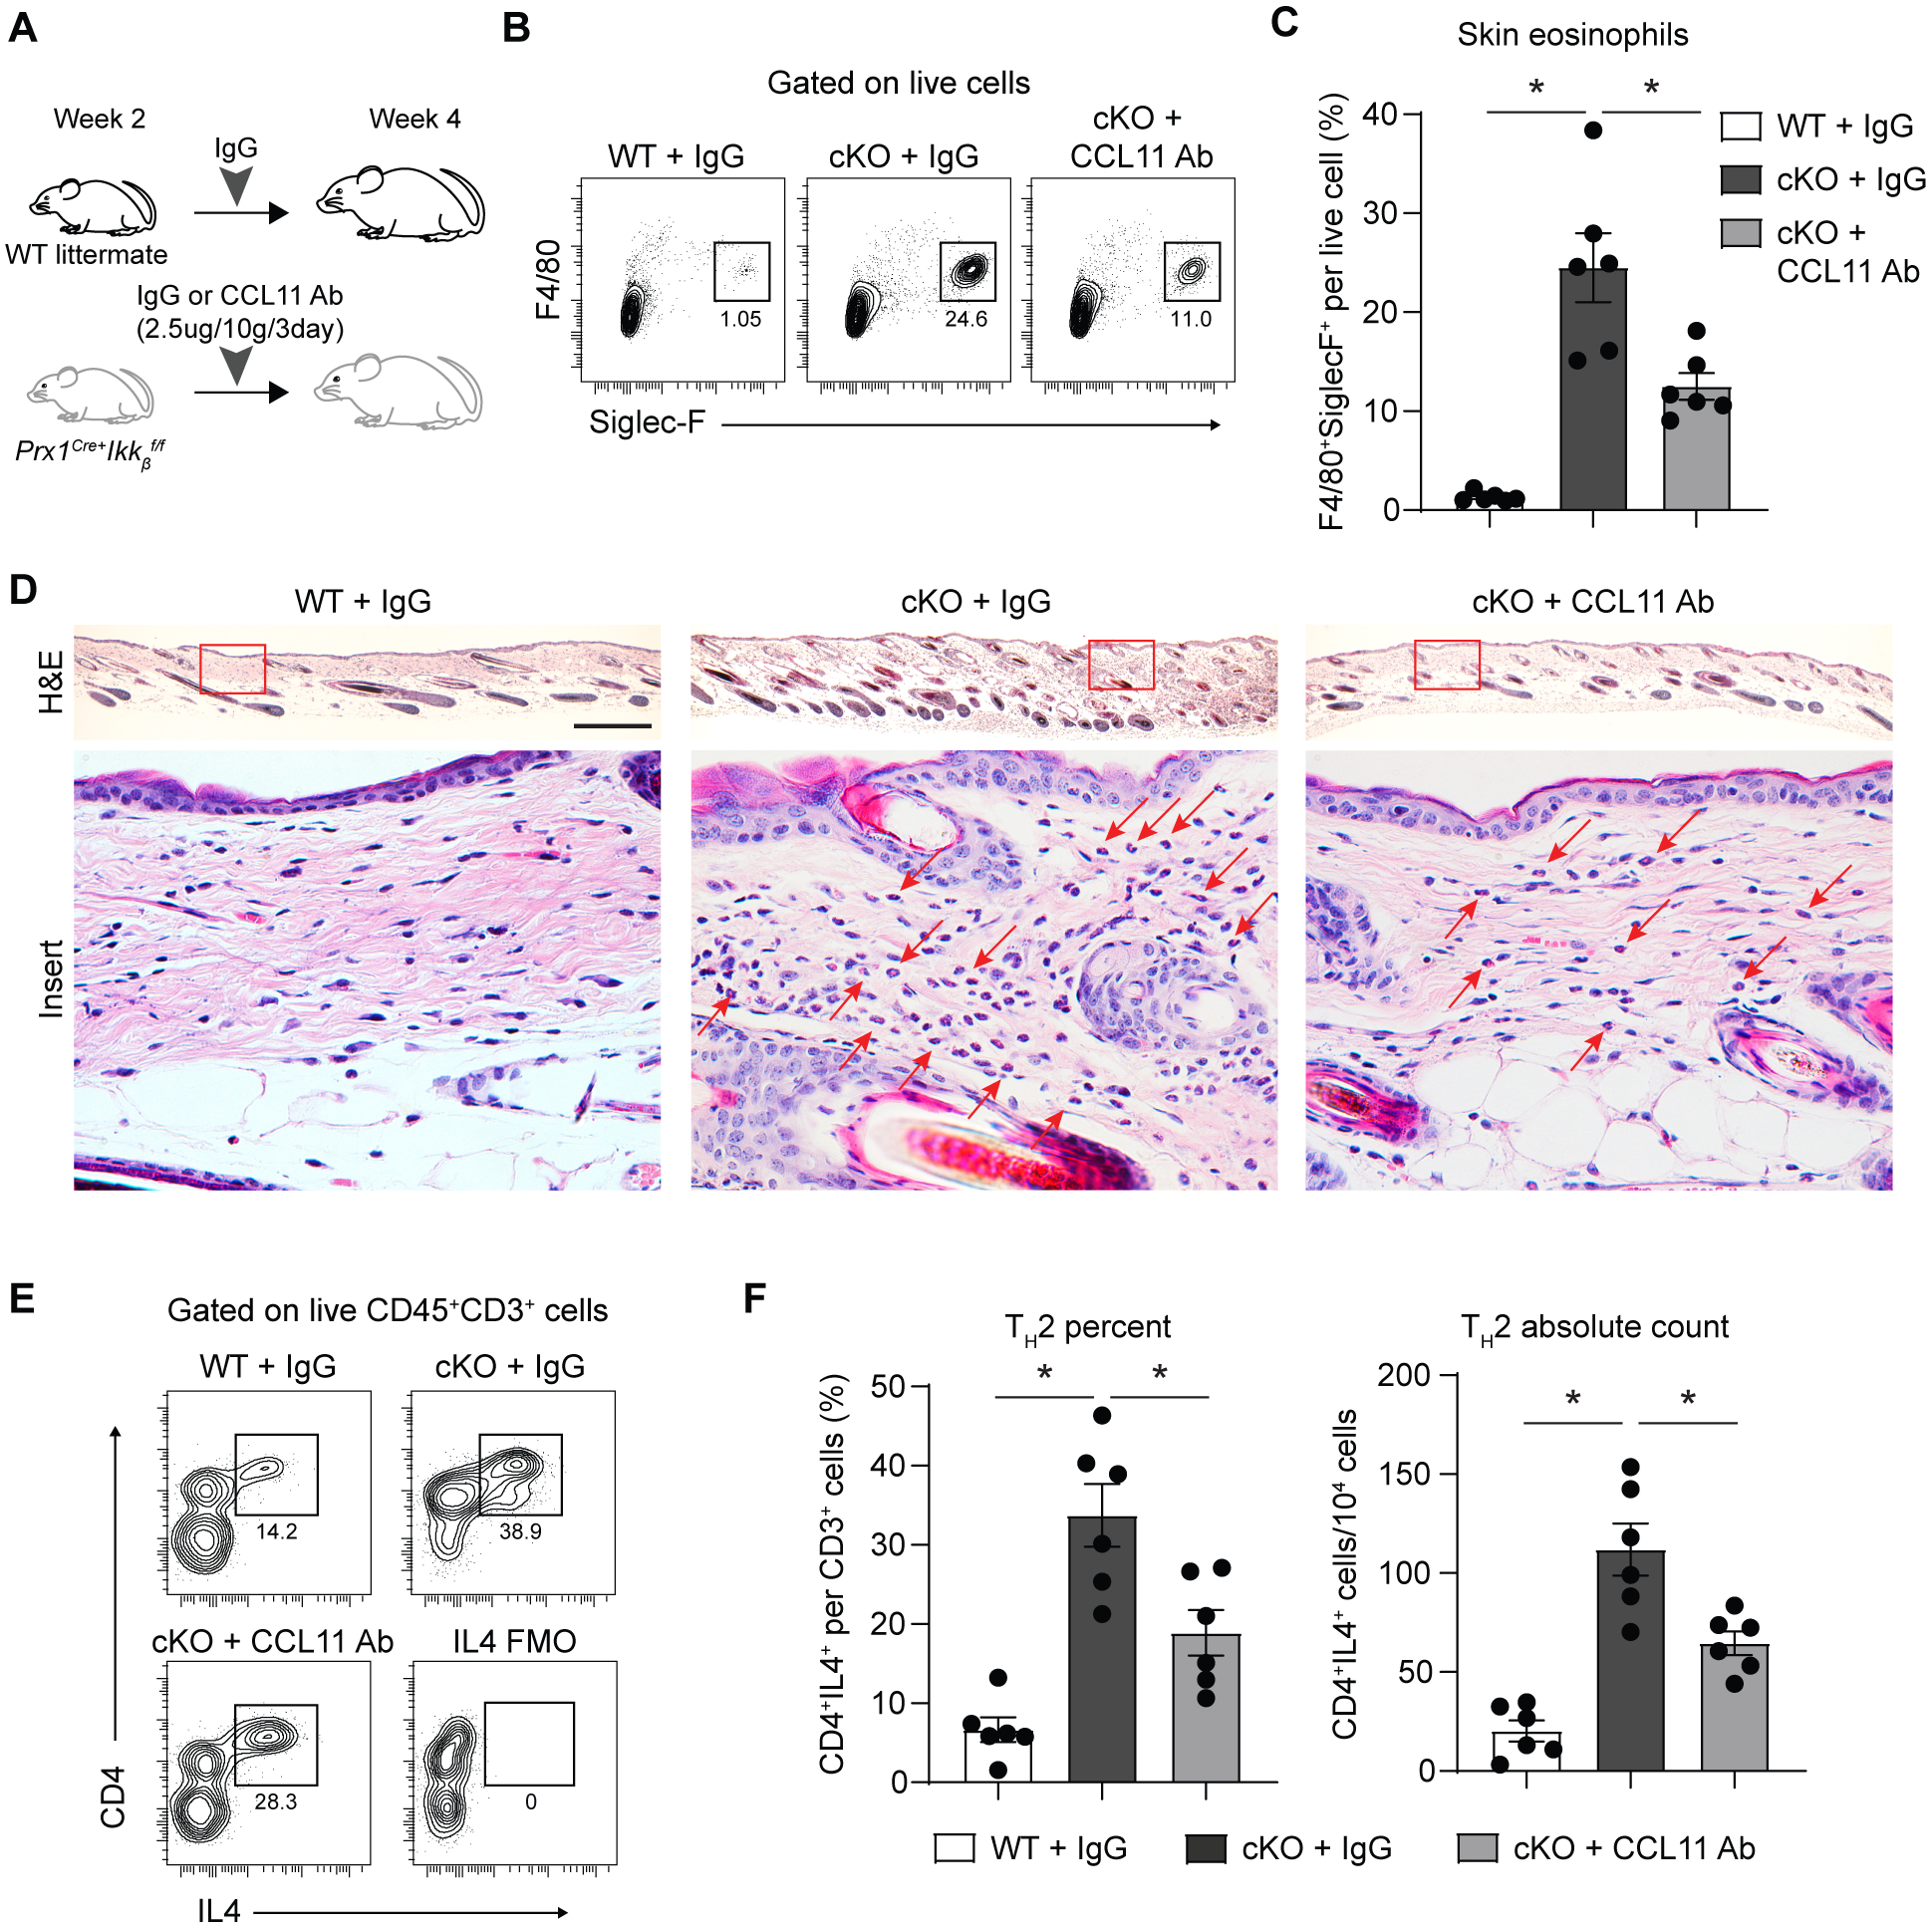
Skin is composed of diverse cell populations that cooperatively maintain homeostasis. Up-regulation of the nuclear factor κB (NF-κB) pathway may lead to the development of chronic inflammatory disorders of the skin, but its role during the early events remains unclear. Through analysis of single-cell RNA sequencing data via iterative random forest leave one out prediction, an explainable artificial intelligence method, we identified an immunoregulatory role for a unique paired related homeobox-1 (Prx1)+ fibroblast subpopulation. Disruption of Ikkb-NF-κB under homeostatic conditions in these fibroblasts paradoxically induced skin inflammation due to the overexpression of C-C motif chemokine ligand 11 (CCL11; or eotaxin-1) characterized by eosinophil infiltration and a subsequent TH2 immune response. Because the inflammatory phenotype resembled that seen in human atopic dermatitis (AD), we examined human AD skin samples and found that human AD fibroblasts also overexpressed CCL11 and that perturbation of Ikkb-NF-κB in primary human dermal fibroblasts up-regulated CCL11. Monoclonal antibody treatment against CCL11 was effective in reducing the eosinophilia and TH2 inflammation in a mouse model. Together, the murine model and human AD specimens point to dysregulated Prx1+ fibroblasts as a previously unrecognized etiologic factor that may contribute to the pathogenesis of AD and suggest that targeting CCL11 may be a way to treat AD-like skin lesions.


Conflict of interest statement

Competing interest. None declared.

Figures

Fig. 1.
Fig. 1.
Preventing basal NF-kB activation in Prx1+ mesenchymal cells leads to ventral skin anomalies. A. Representative immunofluorescent images of ventral skin stained with NF-kB (p65) antibody and vimentin (fibroblast marker) or perilipin (adipocyte marker) in 16-week-old control (WT) or experimental (Prx1Cre+Ikkbf/f) mice. White arrows point to fibroblasts or adipocytes with nuclear NF-kB expression. Scale bar, 50um; insert scale bar, 5um). B. Quantification of double-positive vimentin+/nuclear NF-kB+ fibroblasts per total vimentin+ cells (left), and perilipin+/nuclear NF-kB+ adipocytes per total perilipin+ cells (right), comparing between WT and Prx1Cre+Ikkbf/f (conditional knockout, cKO) group. n=7–8 mice in each group. C. Representative photograph images of ventral and dorsal skin in 16–20-week-old WT and Prx1Cre+Ikkbf/f mice; scale bar, 1cm. D. Hematoxylin and eosin (H&E) and trichrome images of ventral skin from WT or cKO mice; d, dermis, ad, adipose layer. Scale bar, 0.5mm. Insert, red arrows point to eosinophils. Scale bar, 50um. E and F. Epidermis, dermis and adipose width in ventral (E) or dorsal (F) skin of WT and cKO mice. n=6–10 mice in each group. H. Mechanical testing of ventral skins from WT and cKO mice; stiffness and maximum load until failure (tear) were quantified. n=4–5 each. Data are represented as mean ± SEM of biological replicates. Animal experiments were repeated two to three times. *P<0.05; Student’s t-test comparing WT to cKO groups.
Fig. 2.
Fig. 2.
Progressive dermatitis by Ikkb deletion worsens with aging. A. Representative images of clinical lesion from Prx1Cre+Ikkbf/f (cKO) mice over 15- to 19-week period in age. Scale bar, 1cm. B. Quantification of percent control (WT) or cKO animals affected by alopecia (solid line) and/or ulceration (dashed line) in function of age over 4- to 21-week time points. C. Lesion area quantified in mm2 over the observational period. D. Representative immunofluorescent images of CD34+ hair follicle bulge from WT or cKO groups (left, dotted line) and quantification of hair follicle numbers from H&E images or by CD34+ staining (right) in 20-week-old mice. Scale bar, 50um. E. H&E images of ventral skin in 1-day old (P1) neonatal WT and cKO mice (left) and quantification of epidermis and dermis thickness in each group (right). Scale bar, 0.5mm. F. H&E images of ventral skin in 4-week-old young WT or cKO mice (left; scale bar, 0.5mm), with insert images showing overt inflammatory infiltrate in the skin of cKO mice (right; scale bar, 50um). G. Quantification of epidermis, dermis and adipose layer thickness between WT versus cKO mice at 4 weeks of age. Dashed lines demarcate dermal (d) and adipose (ad) borders in E and F. Data are represented as mean ± SEM of biological replicates. Animal experiments were repeated three times. n=6–10 each. *P<0.05, ns = not significant; Student’s t-test comparing WT to cKO groups.
Fig 3.
Fig 3.
Skin inflammation in Ikkb-deleted mice is characterized by excessive myeloid cell infiltration. A. Representative immunofluorescent images with myeloperoxidase antibody (MPO, a neutrophil marker) and F4/80 antibody (a pan-macrophage marker) in 4-week-old wildtype (WT) or Prx1Cre+Ikkbf/f (cKO) mice, scale bar, 50um. B. Quantification of immunopositive cells for MPO, F4/80, or CD4 expression in 4-week (left) or 20-week-old (right) mice between WT and cKO groups; IF = immunofluorescence experiment. n=6–8 each. C. Quantification of MPO+ cells in the ventral skin of 1-day-old (P1) mice between WT and cKO groups. n=4–6 each. D. Representative flow cytometry plot on myeloid cell gating (live, CD45+CD11b+ cells) to analyze Gr-1Hi neutrophils and F4/80+ myeloid cells in 4-week-old mice. E. Quantification of neutrophils (CD45+CD11b+F4/80Gr-1Hi), F4/80+ myeloid cells (CD45+CD11b+F4/80+Gr-1) and CD3 T cells (SSClowCD45+CD3) per total live cells in 4-week (left) or 20-week-old mice (right) by flow cytometry analysis (FC). F. Quantification of neurophils and F4/80+ myeloid cells from 4-week- old mice that were weaned in soft paper cage bedding. G. Quantification of circulating hematopoetic cells from retro-orbital blood samples of the control (WT) or Prx1Cre+Ikkβf/f (cKO) mice aged at 20 weeks old by complete blood count/differential analysis. WBC: white blood cell, RBC: red blood cell, n=6–9 each. H. Representative micrograph of spleen from 20-week-old WT and cKO mice (left; scale bar, 1cm). Right, quantification of spleen weight per weight. I. Spleen cryosections stained for T cells (CD3 antibody) and B cells (B220 antibody) demonstrating intact germinal centers in both WT and cKO mice. Scale bar, 0.5mm. J and K. Quantification of neutrophils (Neut; CD45+CD11b+Gr-1Hi), monocytes (MO; CD45+CD11b+CD115+), macrophages (MΦ; CD45+CD11b+F4/80+) and eosinophils (Eos; CD45+CD11b+Siglec-F+) per total live cells from splenocyte preparations (J) and from bone marrow preparations (K) of WT and cKO mice; n=5–6 each. Data are represented as mean ± SEM of biological replicates. Animal experiments were repeated three times. *P<0.05, ns = not significant; Student’s t-test comparing WT to cKO groups.
Fig. 4.
Fig. 4.
Ikkb deletion in skin fibroblasts, not adipocytes, is responsible for myeloid inflammation during perinatal growth. A. H&E images of ventral skin in 4-week-old control group (WT) or adipocyte-specific Ikkb deletion (Adipoq-Cre+Ikkbf/f) mice. Scale bar, 50um. B. Flow cytometry analysis of neutrophils (CD45+CD11b+Gr-1Hi) and F4/80+ myeloid cells (CD45+CD11b+F4/80+) from enzymatically digested ventral skin of WT or Adipoq-Cre+Ikkbf/f mice. C. Quantification of neutrophils and F4/80+ myeloid cells per total live cell count in ventral skin (left), spleen (middle), and bone marrow (right) comparing WT versus adipocyte-specific deletion of Ikkb group. n=7–8 each. D. H&E images of ventral skin in 4-week-old WT or experimental mice that had induced deletion of Ikkb in Col1a2-expressing fibroblasts (Col1a2CreERT+Ikkbf/f). Mice received tamoxifen twice at P1 and P3 (50ug/dose) and were euthanized at 4 weeks of age. Red arrows point at monocytic and/or eosinophilic cells. Scale bar, 50um. E. Flow cytometry plot for neutrophils and F4/80+ myeloid cells in WT or mice with Ikkb-deleted in Col1a2+ fibroblasts. Tamoxifen was administered at P1 and P3 (intragastric, 50ug/dose). F. Quantification of neutrophils and F4/80+ myeloid cells per total live cell count in ventral (left), spleen (middle) and bone marrow (right) comparing WT versus Ikkb deletion in Col1a2-expressing pan-fibroblasts. n=5–8 each. G. Perinatal induction of dTomato reporter gene in postnatal Prx1+ cells (Prx1CreERT+R26RdTomato), labeling dermal mesenchymal cells and some subcutaneous adipocytes (insert, arrows; scale bar, 20um) after 4-week tracing period. Scale bar, 0.5mm. H. Immunofluorescent images of F4/80+ cells in the ventral skin of 4-week-old WT mice and Prx1CreERT+Ikkbf/f mice that had perinatal deletion of Ikkb (left), and quantification of F4/80+ cells per mm2 (right). IF=immunofluorescence analysis. n=8–10 each. Both WT and Prx1CreERT+Ikkbf/f mice received tamoxifen. Scale bar, 50um. I. Flow cytometry analysis (FC) for F4/80+ myeloid cells from ventral skin of WT and Prx1CreERT+Ikkbf/f mice. n=5–10 each. Data are represented as mean ± SEM of biological replicates. Animal experiments were repeated three times. *P<0.05, ns=not significant; Student’s t-test comparing WT to each respective experimental group.
Fig. 5.
Fig. 5.
Single cell RNA sequencing reveals marked changes in fibroblast transcriptome by the Ikkb gene deletion. A. iRF-MCL (iterative random forest-Markov clustering) of 11084 cells from enzymatically digested ventral skin of WT and Prx1Cre+Ikkbf/f mice with cell type designation based on putative gene expression. Clusters with >50 cells are shown. B. WT (blue) and cKO (Prx1Cre+Ikkbf/f, red) group designation demonstrating even distribution of sample (3566 cells from WT, 2510 cells from cKO are shown). C. Hierarchical partitioning of Markov clusters and cell type designation, using Ward’s linkage method between Pearson correlations of mean expression vectors of the clusters. The groups generated by this partitioning have been t-SNE projected in Figure 5D and share the same color legend. D. t-SNE plot with cell type designation (left) and WT/cKO designation (right) demonstrating clear separation of fibroblast clusters (encircled in dashed line) derived from Ikkb-deleted group. Mixed WT/cKO cluster threshold was determined at <0.90 cutoff. E. Fibroblast subtyping based on (36) demonstrating a transcriptomic shift towards that of hypodermal fibroblasts when Ikkb is deleted (left of the dashed line). F. Importance score for genes that determined the formation of top 2 clusters from WT and cKO groups as characterized in A and B.
Fig. 6.
Fig. 6.
Ikkb deletion causes excessive Ccl11 expression by the fibroblasts and leads to subsequent eosinophilia. A. Pairwise comparisons of chemokine genes from each fibroblast clusters (top) and from Prx1high fibroblasts, comparing WT to Prx1Cre+Ikkbf/f (cKO) group. Notable upregulated chemokine genes were Cxcl12, Ccl11, and Ccl7. LFC2: log2 fold-change. B. Gene ontology (GO) analysis for biological process related to chemotaxis and inflammation based on genes upregulated in Prx1high fibroblasts from cKO group compared to that of WT. C. tSNE plots of iRF-MCL clusters with Cxcl12, Ccl7 and Ccl11 gene expression with notable upregulation of Ccl11 in fibroblast clusters derived from cKO group. D. Volcano plot of genes upregulated in WT and cKO groups using each fibroblast as a datapoint through single cell analysis pipeline established by Seurat and DESeq2 packages. E. In vivo validation of CCL11 protein upregulation by immunofluorescence with CCL11 antibody in ventral skin of 4-week-old WT and cKO mice. Scale bar, 200um. Insert images (orange box) show CCL11+ cells at the border of dermis and subcutaneous layers, as indicated by the arrows. Scale bar: 50um. Representative images are from n=7 each. Isotype IgG control shows autofluorescence in hair follicles. F. Flow cytometry analysis of eosinophil count (CD45+CD11b+F4/80+Siglec-F+) per total live cells, comparing WT versus cKO groups. G. Percentage of Siglec-F+ eosinophils, classically activated macrophages (M1, CD80+), and alternatively activated macrophages (M2, CD206+) per total CD45+CD11b+F4/80+ cells. H. t-SNE plot for 5,136 fibroblasts (3,609 WT and 1,527 cKO) in the scRNA-seq dataset, comparing both WT versus cKO (left) and Cebpb UMI expression (normalized and log10-transformed) (right). I. Immunofluorescence with antibodies specific to CEBPB and PDGFRA in 4-week-old WT and experimental mice (left) and quantification of CEBPB+PDGFRA+ fibroblasts. Scale bar, 50um. J. Quantitative real-time PCR (RT-qPCR) for Ikkb, Cebpb and Ccl11 mRNA in skin fibroblasts with no treatment (sham), scrambled siRNA control (Scr), or Ikkb siRNA (20nM). Cells were isolated from ventral skin of 2-week-old Prx1Cre+R26RdTomato mice and stimulated with low-dose IL4 (5ng/ml) for 12–16h before analysis. K. Flow cytometry analysis of Prx1+ fibroblasts for mean fluorescent intensity of CEBPB (left) or CCL11+ fibroblast numbers (right). Cells were gated for live/dTomato+ expression. L. Quantification of CCL11+ fibroblasts after knockdown with Cebpb siRNA alone, Ikbkb siRNA alone, and Cebpb+Ikbkb siRNA. M. Quantification of CCL11 mRNA by RT-qPCR with IKBKB knockdown alone or IKBKB+CEBPB knockdown in human neonatal fibroblasts without IL4 treatment. F to G. n=6 each. J to M. n=3 each. Data are represented as mean ± SEM of biological replicates. In vitro experiments were repeated twice, and animal experiments were repeated three times. *P<0.05, ns: not significant; Student’s t-test comparing WT to cKO groups (F and G) or one-way ANOVA followed by post-hoc test (J to M).
Fig. 7.
Fig. 7.
Ikkb deletion in fibroblasts causes a shift in inflammatory phenotype towards type-2 immune response, mimicking atopic skin in humans. A. Leukocyte frequency distribution between control (WT) and Prx1Cre+Ikkbf/f (cKO) groups demonstrating marked increase in Th2 proportion in cKO group. B. Importance scores of genes that determined the largest immune cell cluster (Cluster 3) that is predominated by cells of cKO group. Il5, Areg and Il13 are classic type 2 immune cytokines. C. Seurat clustering of immune cells from WT (blue) and cKO (red) mice; myeloid and lymphoid cell designation was determined by their putative gene expression as shown in fig. S7. D. Volcano plot of genes upregulated in lymphocyte population of WT and cKO groups using Seurat and DESeq2 packages. E. Violin plot of Il1b and Tgfb1 in myeloid cell population between WT and cKO mice. F. Flow cytometry analysis of skin eosinophils and CD3+CD4+IL4+ Th2 cells from young (4-week-old) and adult (20-week-old) WT and cKO mice. n=6–8 each. G. Representative RNAScope images of human control and atopic skin specimens detecting CCL11 (red) and PDGFRA (green dots) signals in dermis. Dashed line demarcates epidermal-dermal junction. Black arrows point to some PDGFRA+ fibroblasts and red arrows to CCL11+ cells. Scale bar, 50um. H. Quantification of double CCL11+PDGFRA+ cells per total spindle-shaped cells (left) and percentage of CCL11+ expressing fibroblasts by normalizing to total PDGFRA+ cells. I. Quantification of CCL11+CEBPB+ spindle-shaped cells in matched control versus human AD skin. n=8 each. Data are represented as mean ± SEM of biological replicates. Animal experiments were repeated three times, and RNAScope was repeated twice. *P<0.05; F, two-way ANOVA followed by Tukey’s post-hoc test; H and I, Student’s t-test.
Fig. 8.
Fig. 8.
CCL11 neutralizing antibody treatment in young experimental mice with Ikkb deletion reduces eosinophil infiltration and Th2 cell numbers. A. Experimental design for CCL11 neutralization in young (2–4-weeks-old) mice. B. Flow cytometry plot of eosinophils (F4/80+Siglec-F+) from enzymatically digested ventral skin of control (WT) that received isotype IgG, Prx1Cre+Ikkbf/f (cKO) mice that received either isotype IgG or CCL11 neutralizing antibody. C. Quantification of eosinophils per total live cells comparing WT+IgG, cKO+IgG and cKO+CCL11 neutralizing antibody group. D. H&E images of ventral skin from WT mice that received control IgG, cKO mice that received IgG or CCL11 neutralizing antibody. Scale bar, 0.5mm. Red arrows point to eosinophils. Insert scale bar, 50um. E. Flow cytometry plot of Th2 cells (CD4+IL4+) on live CD45+CD3+ gated cells. F. Quantification of Th2 percent per total CD3+ T cells (left) and that of Th2 absolute count per 104 cells (right). Data are represented as mean ± SEM of biological replicates. Animal experiments were repeated three times. *P<0.05; one-way ANOVA followed by Tukey’s post-hoc test. Ab: antibody, FMO: fluorescence-minus-one control.

References

    1. Karimkhani C, Dellavalle RP, Coffeng LE, Flohr C, Hay RJ, Langan SM, Nsoesie EO, Ferrari AJ, Erskine HE, Silverberg JI, Vos T, Naghavi M, Global Skin Disease Morbidity and Mortality: An Update From the Global Burden of Disease Study 2013. JAMA Dermatol 153, 406–412 (2017). - PMC - PubMed
    1. Weidinger S, Beck LA, Bieber T, Kabashima K, Irvine AD, Atopic dermatitis. Nat Rev Dis Primers 4, 1 (2018). - PubMed
    1. Greb JE, Goldminz AM, Elder JT, Lebwohl MG, Gladman DD, Wu JJ, Mehta NN, Finlay AY, Gottlieb AB, Psoriasis. Nat Rev Dis Primers 2, 16082 (2016). - PubMed
    1. Arkwright PD, Motala C, Subramanian H, Spergel J, Schneider LC, Wollenberg A, Atopic A Dermatitis Working Group of the Allergic Skin Diseases Committee of the, Management of difficult-to-treat atopic dermatitis. J Allergy Clin Immunol Pract 1, 142–151 (2013). - PubMed
    1. Pasparakis M, Haase I, Nestle FO, Mechanisms regulating skin immunity and inflammation. Nat Rev Immunol 14, 289–301 (2014). - PubMed

Publication types

LinkOut - more resources