. 2022 Feb 2;18(2):e1009801.
doi: 10.1371/journal.pcbi.1009801. eCollection 2022 Feb.

Global diversity and balancing selection of 23 leading Plasmodium falciparum candidate vaccine antigens

Affiliations

Global diversity and balancing selection of 23 leading Plasmodium falciparum candidate vaccine antigens

Myo T Naung et al. PLoS Comput Biol. .

Abstract

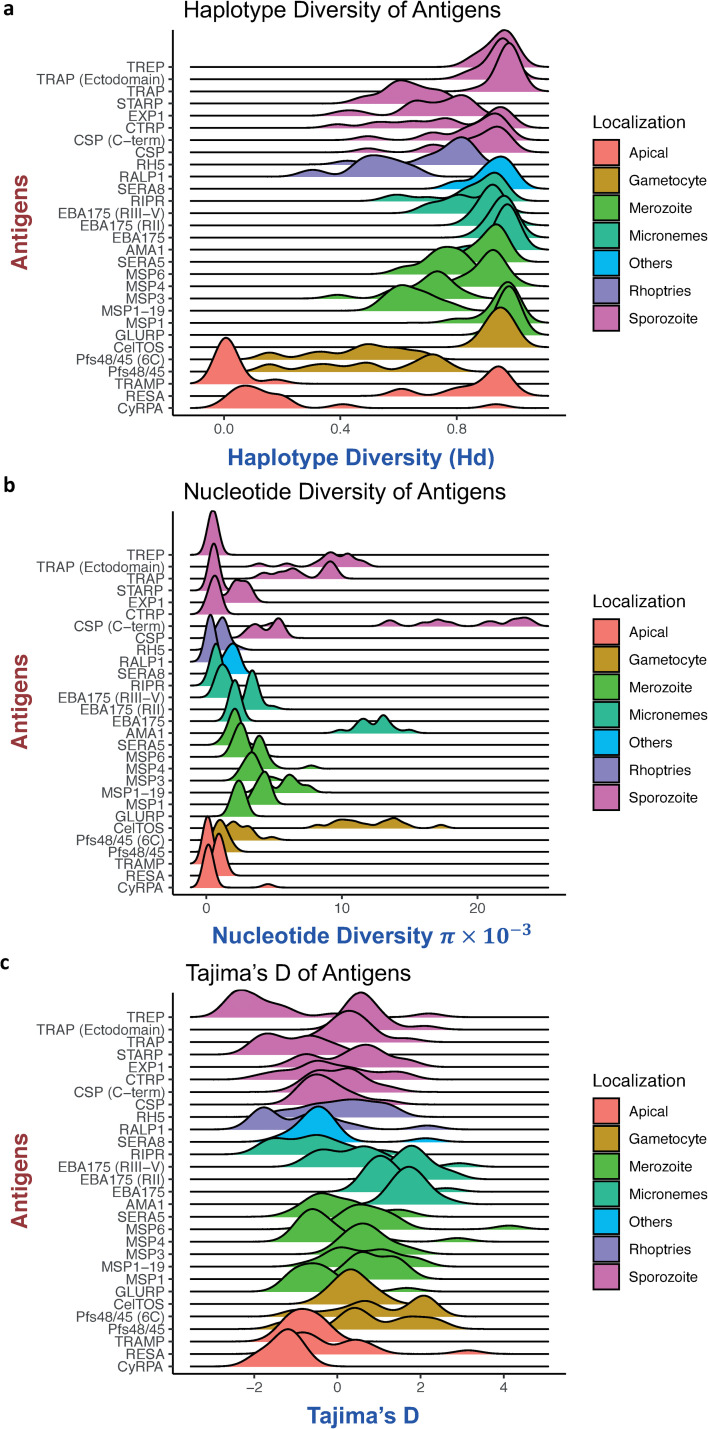
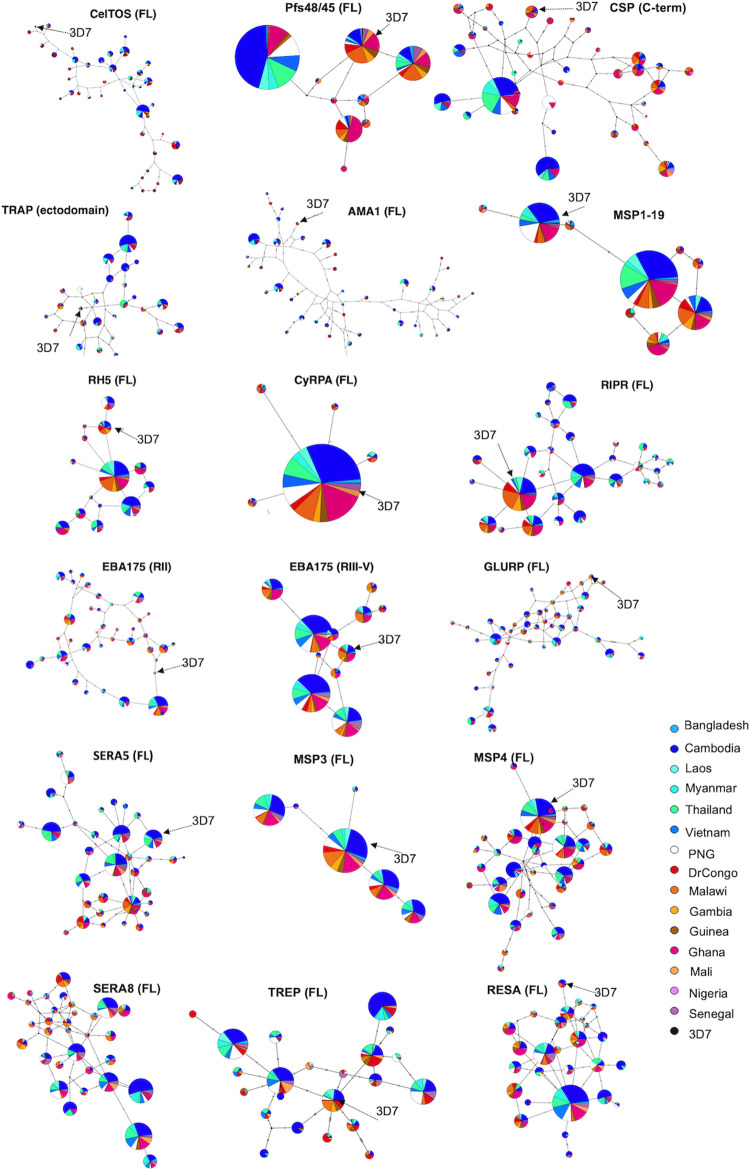
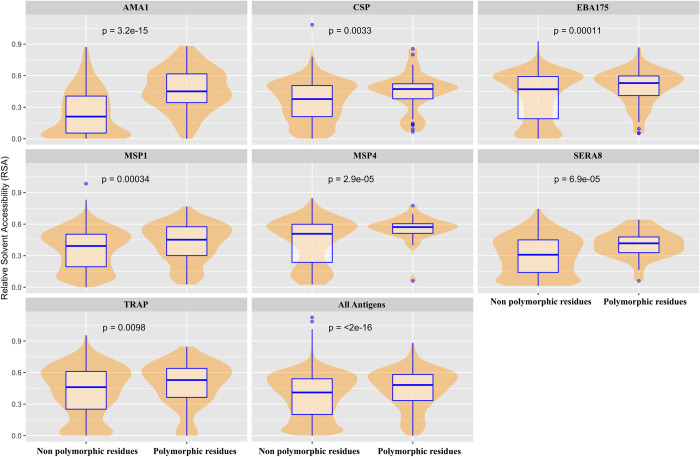
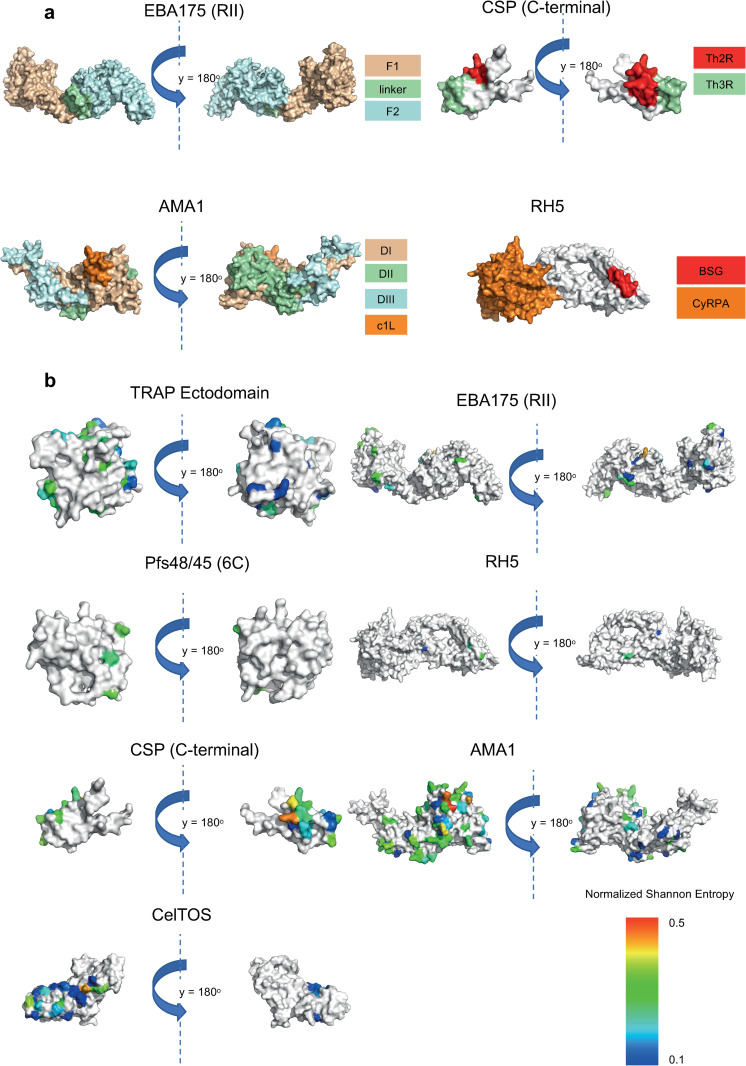
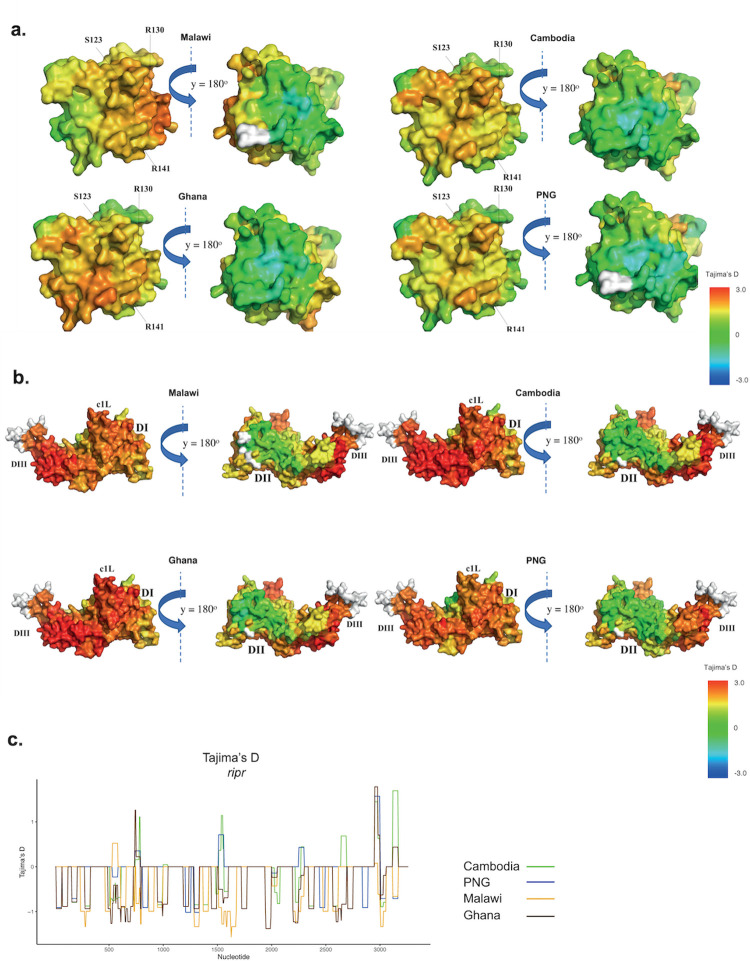
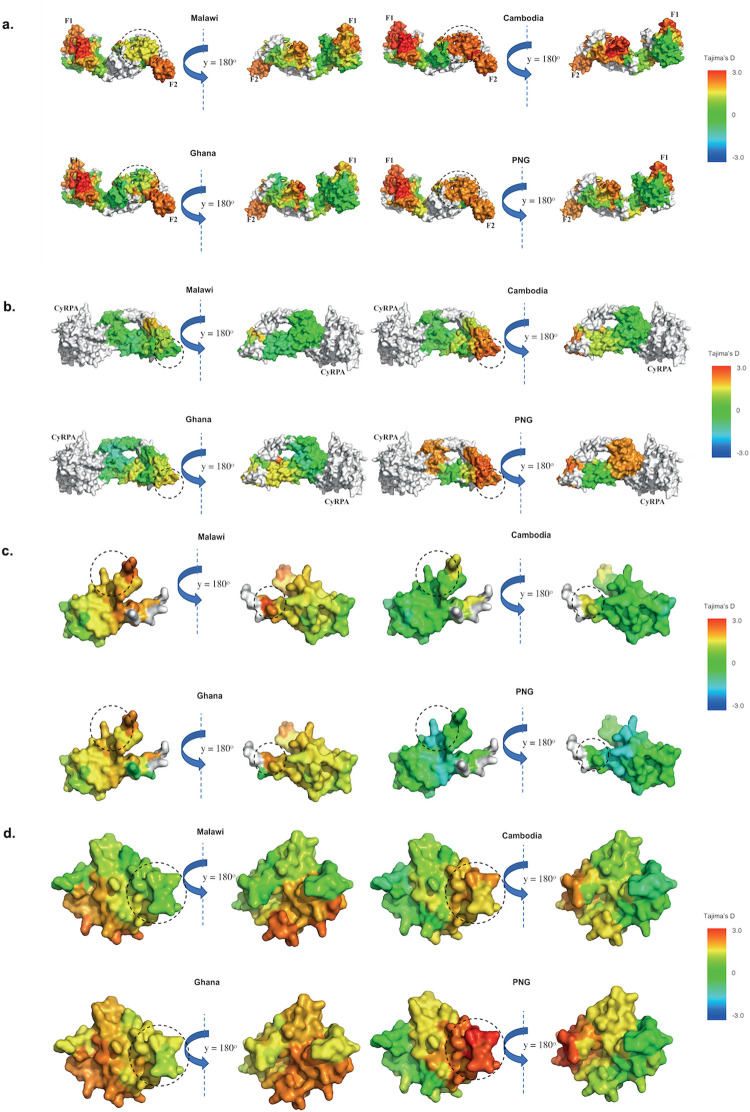
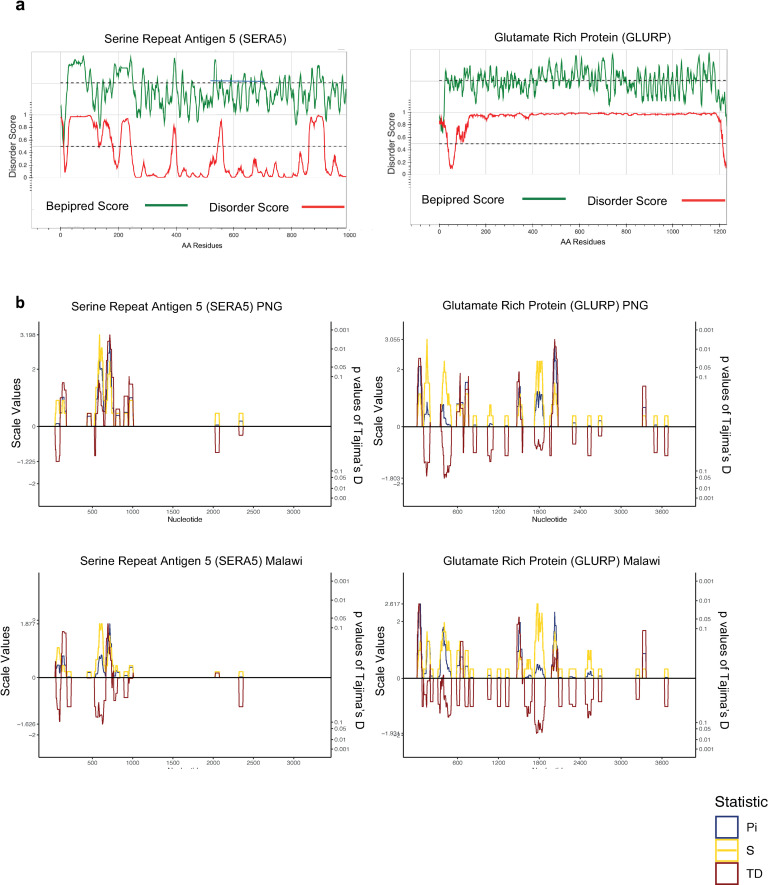
Investigation of the diversity of malaria parasite antigens can help prioritize and validate them as vaccine candidates and identify the most common variants for inclusion in vaccine formulations. Studies of vaccine candidates of the most virulent human malaria parasite, Plasmodium falciparum, have focused on a handful of well-known antigens, while several others have never been studied. Here we examine the global diversity and population structure of leading vaccine candidate antigens of P. falciparum using the MalariaGEN Pf3K (version 5.1) resource, comprising more than 2600 genomes from 15 malaria endemic countries. A stringent variant calling pipeline was used to extract high quality antigen gene 'haplotypes' from the global dataset and a new R-package named VaxPack was used to streamline population genetic analyses. In addition, a newly developed algorithm that enables spatial averaging of selection pressure on 3D protein structures was applied to the dataset. We analysed the genes encoding 23 leading and novel candidate malaria vaccine antigens including csp, trap, eba175, ama1, rh5, and CelTOS. Our analysis shows that current malaria vaccine formulations are based on rare haplotypes and thus may have limited efficacy against natural parasite populations. High levels of diversity with evidence of balancing selection was detected for most of the erythrocytic and pre-erythrocytic antigens. Measures of natural selection were then mapped to 3D protein structures to predict targets of functional antibodies. For some antigens, geographical variation in the intensity and distribution of these signals on the 3D structure suggests adaptation to different human host or mosquito vector populations. This study provides an essential framework for the diversity of P. falciparum antigens to be considered in the design of the next generation of malaria vaccines.


Conflict of interest statement

The authors have declared that no competing interests exist.

Figures

Fig 1
Fig 1. Distribution of haplotype diversity, nucleotide diversity, and Tajima’s D values amongst countries for each antigen.
The lines from ridgeline plots indicate the range and distribution of respective diversity parameters for each antigen across different parasite populations (countries). Tramp, and cyrpa were conserved across all populations, whilst trap, ama1, eba175, and celtos were diverse and showed evidence of diversifying selection across all parasite populations.
Fig 2
Fig 2. Haplotype network for malaria vaccine antigens.
Templeton, Crandall, and Sing (TCS) network summarizing the global diversity of selected antigens using only common haplotypes (> 0.5% of all haplotypes) based on non-synonymous SNPs for full length respective domain of each antigen. Circles represent unique haplotypes, and circles are scaled according to the prevalence of the observed haplotypes. The number of non-synonymous SNP differences between each haplotype was shown by the number of hatch marks on the branches. The vaccine strain 3D7 (arrowed) was included for reference.
Fig 3
Fig 3. Relative solvent accessibility of polymorphic versus conserved residues.
Relative solvent accessibility (RSA) was calculated for all residues for 23 antigens. RSA was calculated using neural network based NetSurfP1.1 program or DSSP program respectively based on the presence of known PDB or homology-modelled structures [30,31]. Polymorphic residues from more than 1000 sequences regardless of minor allele frequency (MAF) were included in the analysis. Box and whisker plots show the median (blue line), and interquartile range (blue box) of RSA values for each residue from respective group. The violin plot (which uses Kernel Density Estimation to compute an empirical probability distribution) shows a smooth distribution of RSA values for most of the calculated group. RSA scores for individual antigens as well as for the combination of all antigens were calculated. Only significant p-values are shown.
Fig 4
Fig 4. Mutations at functionally important interfaces.
(a) Available domain and epitope information for AMA1, EBA175 (RII), RH5, and CSP (C-terminal). (b) Site specific diversity measure for CelTOS, Pfs48/45 (6C domain), TRAP (ectodomain), CSP (C-terminal), AMA1, EBA175 (RII) and RH5. Normalized Shannon Entropy was calculated per residue for these antigens (unavailable residues were coloured in white). Higher entropy values indicate higher diversity across all populations for a particular residue. Residues from the CSP Th2R epitope and AMA1 C1L loop have the highest entropy values. Very low entropy values across all populations were observed for SERA5, and CyRPA.
Fig 5
Fig 5. Antigens displaying geographically conserved balancing selection at functionally important interfaces. Antigens were not normalised based on their sizes.
a. Spatially derived Tajima’s D (D*) score calculation for TRAP (Ectodomain) with incorporation of protein structural information using a 15Å window. TRAP (ectodomain) (PDB Code: 4HQF.A) was used. The structure was coloured according to D* scores mapped to each residue, and undefined D* are shown in white. Residues S123, R130 and R140 are involved in mediating heparin binding. Sample sizes: Malawi (n = 133), Ghana (n = 238), Cambodia (n = 430), and PNG (n = 112). b. Spatially derived Tajima’s D (D*) calculations for AMA1 with incorporation of protein structural information using 15 Å window. The manually modelled structure of AMA1 was used based on published results [27]. The structure was coloured according to D* scores mapped to each residue with undefined D* scores were shown in white. The DI, DII, DIII, and surface exposed c1L loop are indicated. Sample sizes: Malawi (n = 139), Ghana (n = 243), Cambodia (n = 433), and PNG (n = 112). c. Polymorphism and evidence of selection for ripr. Tajima’s D statistic calculated for disordered regions of RIPR in samples from Cambodia, PNG, Malawi, and Ghana. Tajima’s D is calculated with a sliding window approach (a window size of 50 bp and a step size of 5 bp). Nucleotide positions based on coding region are shown in the x-axis. Sample size for each respective population are as follows: Malawi (n = 137), Ghana (n = 246), Cambodia (n = 428), and PNG (n = 111).
Fig 6
Fig 6. Antigens displaying geographically variable balancing selection hotspots. Antigens were not normalised based on their sizes.
a. Spatially derived Tajima’s D (D*) for EBA175 with incorporation of protein structural information using 15 Å window. 3D7-based ModPipe model of EBA175 (RII) based on 1ZRO template was used. Structure was coloured according to D* scores mapped to each residue with undefined D* were shown in white. The highlighted region (in circle) shows different D* scores between Asia-Pacific and African countries. Sample sizes: Malawi (n = 136), Ghana (n = 237), Cambodia (n = 432), and PNG (n = 112). b. Spatially derived Tajima’s D (D*) calculation for countries from Asia-Pacific and Africa for RH5 with incorporation of protein structural information using 15Å window. Cryo-EM structure of RH5-CyRPA complex (PDB code: 6MPV.B) was used. Structure was coloured according to D* scores mapped to each residue with undefined D* and CyRPA were shown in white. The circle indicates Basigin-binding sites where different D* scores were observed between Asia-Pacific and African countries. Sample sizes: Malawi (n = 142), Ghana (n = 249), Cambodia (n = 433), and PNG (n = 112). c. Spatially derived Tajima’s D (D*) calculations for populations from Asia-Pacific and African regions for CSP (C-terminal) with incorporation of protein structural information using 15 Å window. The crystal structure of the thrombospondin receptor (TSR) domain of CSP [58] (PDB code: 3VDJ, chain A, AA residues: Y306—H376, 3D7 sequence), which consists of Th2R and Th3R (T-cell epitopes) was used [59]. Structure was coloured according to D* scores mapped to each residue with undefined D* were shown in white. The highlighted region (in circle) shows different D* scores between Asia-Pacific and African countries. Sample sizes: Malawi (n = 135), Ghana (n = 223), Cambodia (n = 431), and PNG (n = 111). d. Tajima’s D (D*) calculation for geographic area or countries from the Asia-Pacific and African regions for MSP119 with incorporation of protein structural information using 15 Å window. The structured region of MSP1 (MSP1-19, AA residue: N1607—S1699) is based on the ModPipe homology model using template (PDB code: 1OB1) [60]. The structure was coloured according to D* scores mapped to each residue with undefined D* were shown in white. The circle indicates variable balancing selection hotspots between Asia-Pacific and African countries. Sample sizes: Malawi (n = 101), Ghana (n = 183), Cambodia (n = 270), and PNG (n = 72).
Fig 7
Fig 7. Diversity and selection of SERA5 and GLURP in Asia-Pacific and African regions.
a) Computational predictions of protein disorder and B-cell epitopes in SERA5 and GLURP. The green line represents the linear B-cell epitope mapping scores and the red line shows the protein disorder score, respectively. b) Diversity statistics along the sera5 and glurp genes in samples from in Asia-Pacific and African regions, represented by Tajima’s D (red line), nucleotide diversity (blue line) and number of segregating sites (yellow line). It is calculated in the context of linear sequence level based on coding region with the sliding window approach (a window size of 50 bp and a step size of 5 bp). Nucleotide positions based on coding region are shown in the x-axis. Sample sizes: Malawi (n = 106), Ghana (n = 208), Cambodia (n = 405), and PNG (n = 108).

Similar articles

Cited by

References

    1. Prugnolle F, Durand P, Ollomo B, Duval L, Ariey F, Arnathau C, et al.. A Fresh Look at the Origin of Plasmodium falciparum, the Most Malignant Malaria Agent. PLOS Pathog. 2011;7: e1001283. doi: 10.1371/journal.ppat.1001283 - DOI - PMC - PubMed
    1. Mobegi VA, Duffy CW, Amambua-Ngwa A, Loua KM, Laman E, Nwakanma DC, et al.. Genome-Wide Analysis of Selection on the Malaria Parasite Plasmodium falciparum in West African Populations of Differing Infection Endemicity. Mol Biol Evol. 2014;31: 1490–1499. doi: 10.1093/molbev/msu106 - DOI - PMC - PubMed
    1. Leffler EM, Band G, Busby GBJ, Kivinen K, Le QS, Clarke GM, et al.. Resistance to malaria through structural variation of red blood cell invasion receptors. Science. 2017;356. doi: 10.1126/science.aam6393 - DOI - PMC - PubMed
    1. Good MF, Doolan DL. Malaria vaccine design: immunological considerations. Immunity. 2010;33: 555–566. doi: 10.1016/j.immuni.2010.10.005 - DOI - PubMed
    1. Deroost K, Pham T-T, Opdenakker G, Van den Steen PE. The immunological balance between host and parasite in malaria. FEMS Microbiol Rev. 2016;40: 208–257. doi: 10.1093/femsre/fuv046 - DOI - PubMed

Publication types