. 2022 May 1;71(5):1081-1098.
doi: 10.2337/db21-0536.

Diabetes-Induced Cellular Senescence and Senescence-Associated Secretory Phenotype Impair Cardiac Regeneration and Function Independently of Age

Affiliations

Diabetes-Induced Cellular Senescence and Senescence-Associated Secretory Phenotype Impair Cardiac Regeneration and Function Independently of Age

Fabiola Marino et al. Diabetes. .

Abstract

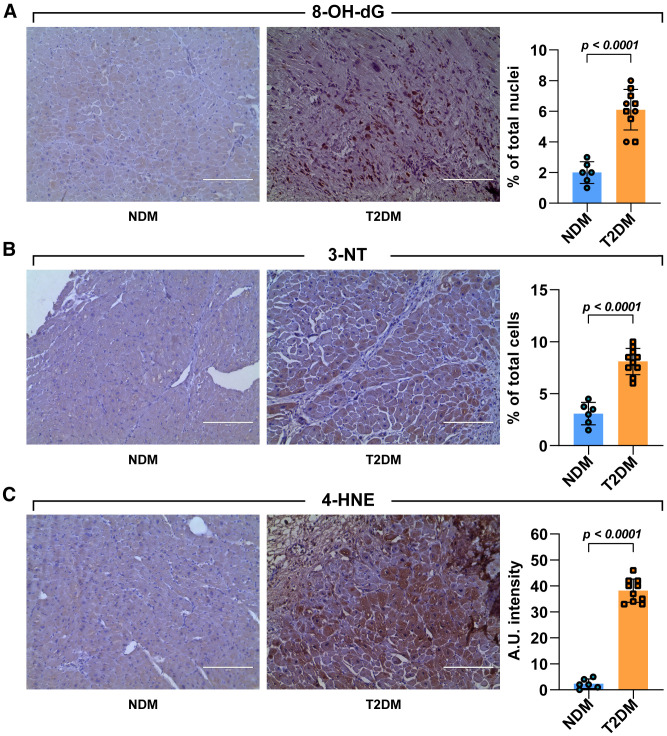
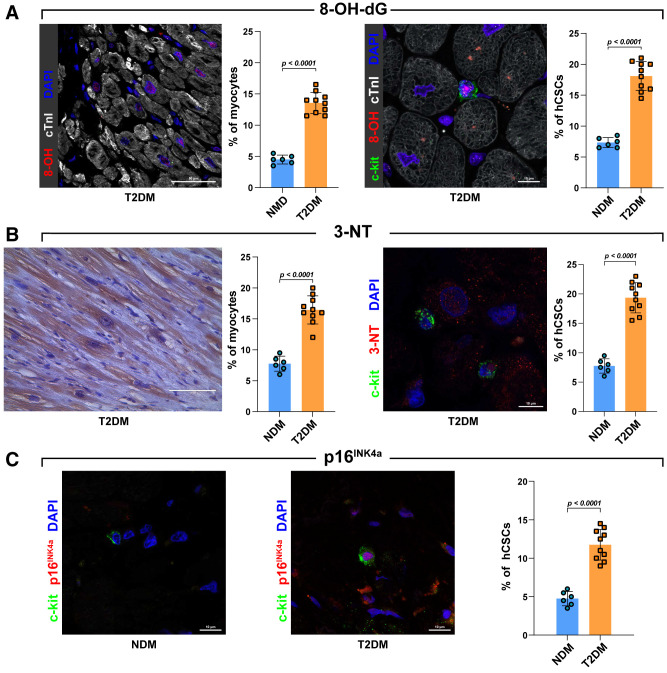
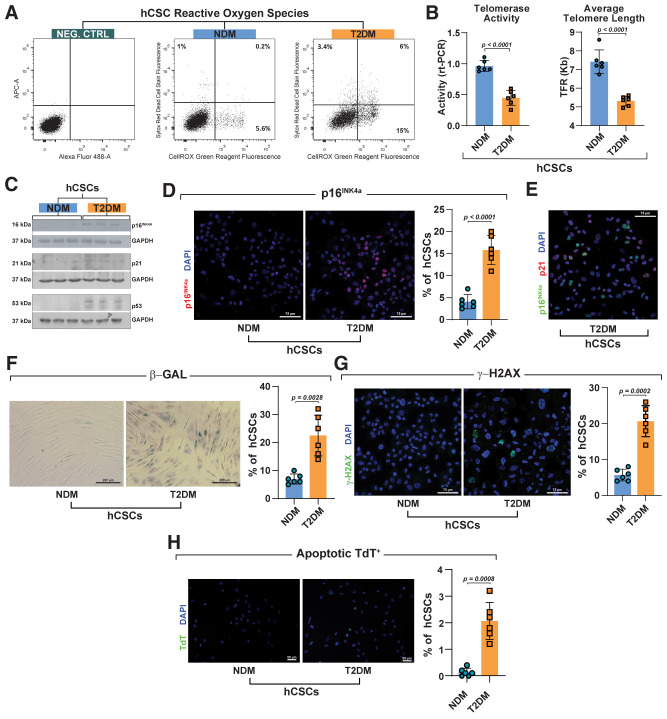
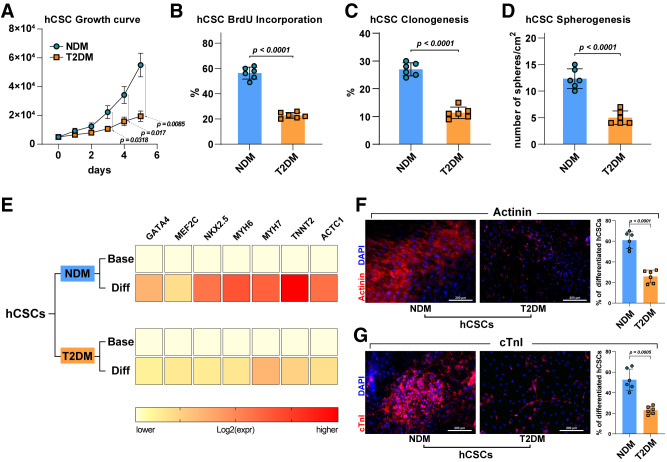
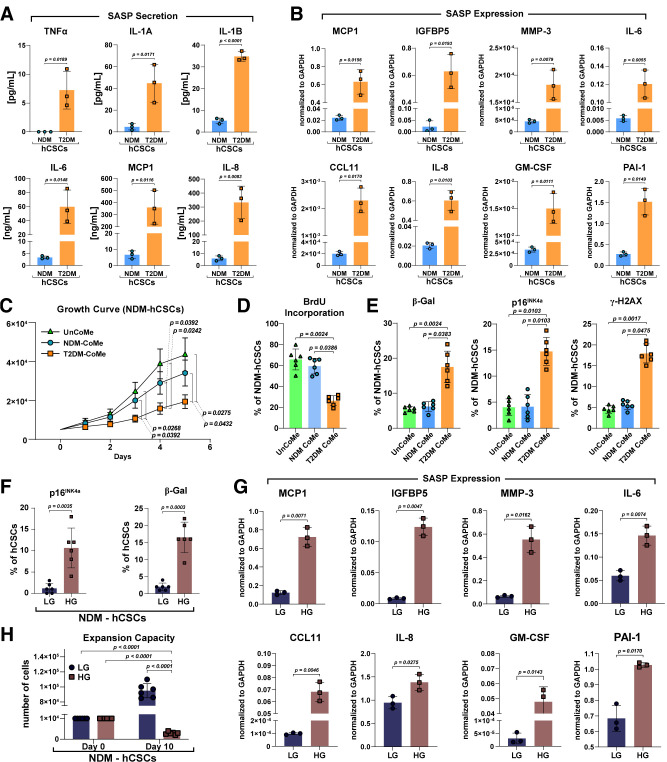
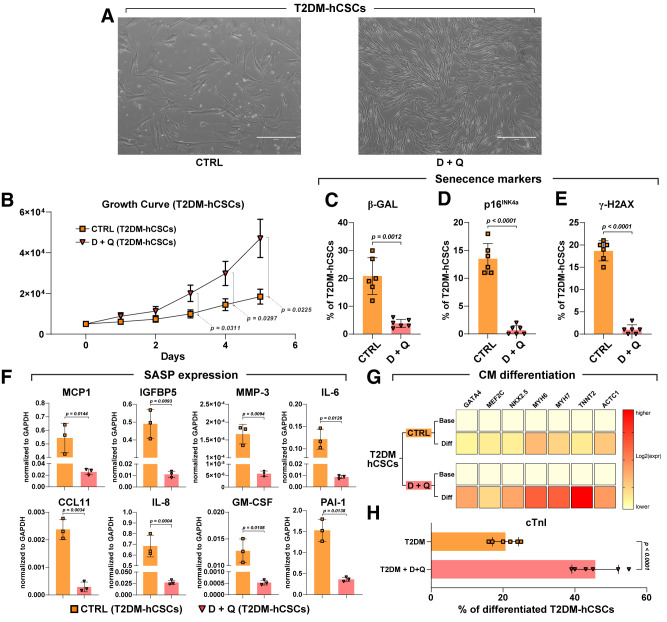
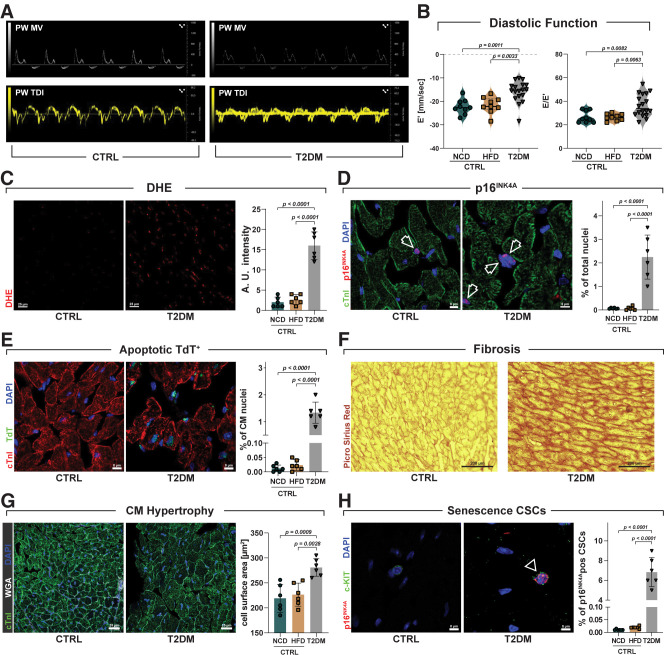
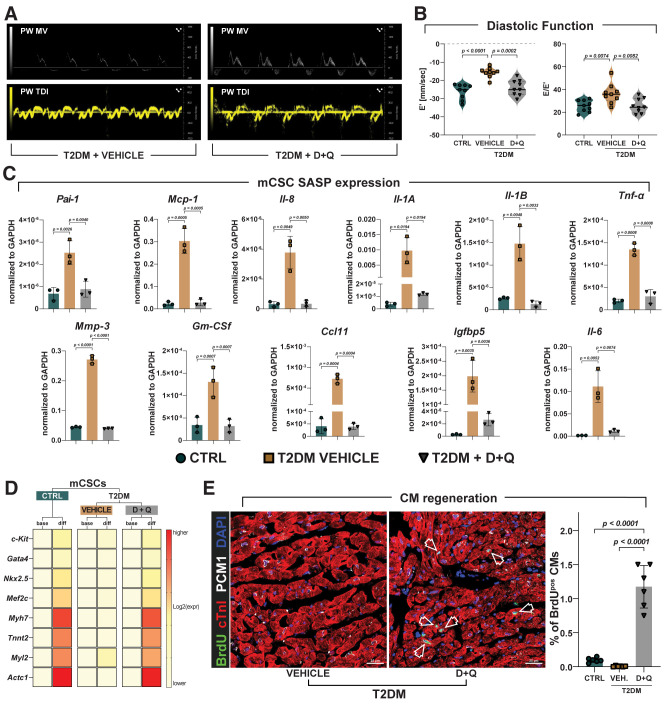
Diabetes mellitus (DM) affects the biology of multipotent cardiac stem/progenitor cells (CSCs) and adult myocardial regeneration. We assessed the hypothesis that senescence and senescence-associated secretory phenotype (SASP) are main mechanisms of cardiac degenerative defect in DM. Accordingly, we tested whether ablation of senescent CSCs would rescue the cardiac regenerative/reparative defect imposed by DM. We obtained cardiac tissue from nonaged (50- to 64-year-old) patients with type 2 diabetes mellitus (T2DM) and without DM (NDM) and postinfarct cardiomyopathy undergoing cardiac surgery. A higher reactive oxygen species production in T2DM was associated with an increased number of senescent/dysfunctional T2DM-human CSCs (hCSCs) with reduced proliferation, clonogenesis/spherogenesis, and myogenic differentiation versus NDM-hCSCs in vitro. T2DM-hCSCs showed a defined pathologic SASP. A combination of two senolytics, dasatinib (D) and quercetin (Q), cleared senescent T2DM-hCSCs in vitro, restoring their expansion and myogenic differentiation capacities. In a T2DM model in young mice, diabetic status per se (independently of ischemia and age) caused CSC senescence coupled with myocardial pathologic remodeling and cardiac dysfunction. D + Q treatment efficiently eliminated senescent cells, rescuing CSC function, which resulted in functional myocardial repair/regeneration, improving cardiac function in murine DM. In conclusion, DM hampers CSC biology, inhibiting CSCs' regenerative potential through the induction of cellular senescence and SASP independently from aging. Senolytics clear senescence, abrogating the SASP and restoring a fully proliferative/differentiation-competent hCSC pool in T2DM with normalization of cardiac function.


Figures

Figure 1
Figure 1
Cardiac damage in diabetes is associated with higher ROS production. AC: Light microscopy images show representative 3,3′-diaminobenzidine tetrahydrochloride staining of LV samples obtained from patients with T2DM and NDM. The respective bar graphs show (in brown) the percentage of 8-OH-dG–positive nuclei (A), 3-NT–positive cells (B), and the 4-HNE arbitrary unit (A.U.) intensity levels (C) in T2DM compared with NDM heart tissue cross sections (n = 10 and 6, respectively). Scale bars = 200 μm. Data are mean ± SD.
Figure 2
Figure 2
Quantification of oxidative stress and senescent markers in myocytes and progenitor cells. A: Representative confocal images and bar graphs showing 8-OH-dG–positive cardiomyocytes and 8-OH-dG–positive hCSCs in LV samples obtained from patients with T2DM (8-OH-dG, red; c-kit, green; cTnI, white; DAPI, blue; n = 10 and 6 T2DM and NDM heart sections, respectively). Scale bars = 50 μm and 10 μm, respectively. B: Representative light microscopy, confocal image, and bar graphs showing 3-NT–positive cardiomyocytes (brown) and 3-NT–positive hCSCs in LV samples obtained from patients with T2DM and NDM (3-NT, red; c-kit, green; DAPI, blue; n = 10 and 6 T2DM and NDM heart sections, respectively). Scale bars = 100 μm and 10 μm, respectively. C: Bar graph and representative confocal images showing p16INK4a expression in LV T2DM-hCSCs compared with NDM-hCSCs (p16INK4a, red; c-kit, green; DAPI, blue; n = 10 and 6 T2DM and NDM heart sections, respectively). Scale bars = 10 μm. Data are mean ± SD.
Figure 3
Figure 3
Phenotypic characterization of T2DM-hCSCs in vitro. A: Flow cytometry dot plots showing ROS in T2DM-hCSCs compared with NDM-hCSCs (representative of n = 3 experiments). B: Bar graphs showing telomerase activity and average telomere length in T2DM-hCSCs compared with NDM-hCSCs (n = 6 biological replicates). Data are mean ± SD. C: Representative Western blot showing p16INK4a, p21, and p53 levels in T2DM-hCSCs compared with NDM-hCSCs (n = 3 biological replicates). D: Bar graph and representative confocal microscopy images from cytospin preparations showing p16INK4a expression (red) in T2DM-hCSCs compared with NDM-hCSCs. Scale bar = 75 μm (n = 6 biological replicates). E: Representative confocal microscopy image from cytospin preparation of T2DM-hCSCs coexpressing the senescent markers p16INK4a (green) and p21 (red). Scale bar = 75 μm. (n = 6 biological replicates). F: Bar graph and representative light microscopy images showing senescence-associated β-gal–positive cells (blue) in T2DM-hCSCs compared with NDM-hCSCs. Scale bar = 200 μm. (n = 6 biological replicates). G and H: Bar graphs and representative confocal microscopy images from cytospin preparations of c T2DM-hCSCs and NDM-hCSCs showing the expression of γ-H2AX (green) and terminal deoxynucleotidyl transferase (TdT) (green) in T2DM-hCSCs compared with NDM-hCSCs. Scale bars = 75 μm and 50 μm (n = 6 biological replicates). Data are mean ± SD. NEG. CTRL, negative control.
Figure 4
Figure 4
Impaired cell growth and myogenic differentiation potential of T2DM-hCSCs in vitro. A: Cell growth curve shows a decreased proliferation in vitro of T2DM-hCSCs compared with NDM-hCSCs (n = 6 biological replicates). BD: Bar graphs showing BrdU incorporation, clonogenesis, and spherogenesis in T2DM-hCSCs compared with NDM-hCSCs (n = 6 biological replicates). E: Heat maps showing qRT-PCR analysis of the main cardiac transcription factors and myocyte contractile genes in T2DM-hCSCs compared with NDM-hCSCs after myogenic differentiation induction. Color scale indicates change in threshold cycle relative to the normalized GAPDH control (n = 3 biological replicates). F: Bar graph and confocal images showing actinin (red) expression levels of differentiated T2DM-hCSCs compared with NDM-hCSCs. Scale bar = 200 μm (n = 6 biological replicates). G: Bar graph and confocal images showing cTnI (red) expression levels of differentiated T2DM-hCSCs compared with NDM-hCSCs. Scale bar = 200 μm (n = 6 biological replicates). Data are mean ± SD. Diff, differentiated; expr, expression.
Figure 5
Figure 5
The SASP of T2DM-hCSCs. A: Bar graphs showing the SASP factor protein levels in culture media from T2DM-hCSCs and NDM-hCSCs after 24 h in serum-free conditions (n = 3 biological replicates). B: Bar graphs showing transcript SASP factor expression in T2DM-hCSCs vs. NDM-hCSCs (n = 3 biological replicates). C: Cell growth curve showing the in vitro proliferative change of NDM-hCSCs placed in conditioned medium (NSM-CoMe) derived from T2DM-hCSCs CoMe (T2DM-CoMe) compared with the NDM-hCSCs placed in unconditioned medium (UnCoMe) and NDM-hCSC CoMe (n = 6 biological replicates). D: Bar graph showing BrdU incorporation of NDM-hCSCs placed in UnCoMe, NDM-CoMe, and T2DM-CoMe (n = 6 biological replicates). E: Bar graphs showing senescent p16INK4a–positive hCSCs, senescence-associated β-gal–positive hCSCs, and γ-H2AX–positive hCSCs in NDM-hCSCs treated with T2DM-CoMe compared with UnCoMe and NDM-CoMe (n = 6 biological replicates). F: Bar graphs showing the number of p16INK4a– and β-gal–positive NDM-hCSCs under high-glucose (HG) conditions in vitro compared with NDM-hCSCs grown in low-glucose (LG) conditions (n = 6 biological replicates). G: Bar graphs showing transcript SASP factor expression of NDM-hCSCs under HG conditions in vitro compared with NDM-hCSCs grown in LG conditions (n = 3 biological replicates). H: Bar graphs showing expansion capacity of NDM-hCSCs under HG conditions in vitro compared with NDM-hCSCs grown in LG conditions (n = 6 biological replicates). Data are mean ± SD.
Figure 6
Figure 6
Senolytics ameliorates regenerative deficit of diabetic hCSCs. A: Light microscopy images showing that the typical enlarged and flattened morphology of senescent cells present in untreated control (CTRL) disappear in D + Q–treated T2DM-hCSCs in vitro. Scale bars = 400 μm. B: Cell growth curve shows the in vitro proliferation T2DM-hCSCs after D + Q treatment compared with CTRL (n = 6 biological replicates). CE: Bar graphs showing the number of β-gal, p16INK4a senescent cells, and γ-H2AX–positive cells in T2DM-hCSCs after D + Q treatment compared with CTRL (n = 6 biological replicates). F: Bar graphs showing transcript SASP factor expression in T2DM-hCSCs after D + Q treatment vs. CTRL (n = 3 biological replicates). G: Heat maps showing qRT-PCR analysis of the main cardiac transcription factors and myocyte contractile genes (GATA4, NKX2.5, MEF2C, TNNT2, ACTC1, MYH6, and MYH7) in differentiating T2DM-hCSCs after D + Q treatment vs. CTRL. Color scale indicates change in threshold cycle relative to the normalized GAPDH control (representative of n = 3 biological replicates). H: Bar graphs show the percentage of cTnI-expressing cells in differentiated T2DM-hCSCs after D + Q treatment vs. CTRL (n = 6 biological replicates). Data are mean ± SD. CM, cardiomyocyte; Diff, differentiated; expr, expression.
Figure 7
Figure 7
Diabetic status causes myocardial cell senescence with myocardial pathologic remodeling and cardiac dysfunction. A: Representative pulsed wave (PW) Doppler mitral velocity (MV) tracing and representative PW tissue Doppler imaging (TDI) velocity tracing of T2DM vs. control (CTRL) mice fed NCD and HFD (NCD, n = 9; HFD, n = 9; T2DM, n = 18). B: Violin plots represent cumulative E/A ratio (left) and E/E′ ratio (right) in T2DM vs. CTRL NCD and HFD mice (NCD, n = 9; HFD, n = 9; T2DM, n = 18). C: Bar graph and confocal images of dihydroethidium (DHE) detection in frozen heart sections from CTRL and T2DM mice. Scale bar = 25 μm (n = 6 biological replicates). D: Bar graph and representative confocal images showing p16INK4a–positive nuclei in myocardial (interstitial) cells in T2DM mice compared with CTRL mice. Scale bar = 8 μm (left) and 5 μm (right) (n = 6 biological replicates). E: Bar graph and representative confocal images of apoptotic terminal deoxynucleotidyl transferase (TdT)–positive (green) cardiomyocyte nuclei in T2DM mice compared with CTRL mice. Scale bar = 8 μm (n = 6 biological replicates). F: Representative light microscopy of Picrosirius Red staining of T2DM mice compared with CTRL mice. Scale bar = 200 μm (n = 6 biological replicates). G: Bar graph and representative confocal images of cardiac cross section showing cardiomyocyte hypertrophy in T2DM mice compared with CTRL mice (wheat germ agglutinin [WGA] Cy5 staining, white fluorescence; cTnI, green; nuclei, DAPI blue). Scale bars = 25 μm (n = 6 biological replicates). H: Bar graph and confocal images showing the percentage of p16INK4a-positive CSCs in T2DM mice compared with CTRL mice (n = 6 biological replicates). Data are mean ± SD.
Figure 8
Figure 8
Senolytics treatment in vivo removes senescent CSCs and improves cardiac repair and regeneration in diabetic mice. A: Representative pulsed wave (PW) Doppler mitral velocity (MV) tracing and representative PW tissue Doppler imaging (TDI) velocity tracing in D + Q–treated T2DM mice compared with vehicle-treated mice (control [CTRL], n = 9; vehicle, n = 9; D + Q, n = 9). (Note that considering that CTRL mice fed an NCD or HFD had indistinguishable cardiac systolic and diastolic function and that their cardiac history and CSC content, phenotype, and function were comparable (data not shown), only the HFD mice are presented as the CTRL in this figure.) B: Violin plots represent cumulative E/A ratio (left) and E/E′ ratio (right) in D + Q–treated diabetic mice compared with vehicle-treated mice. (CTRL, n = 9; vehicle, n = 9; D + Q, n = 9). C: Bar graphs showing transcript SASP factor expression in CSCs isolated from vehicle- and D + Q–treated T2DM mice compared with CSCs isolated from CTRL mice (n = 3 biological replicates). D: Heat maps showing the myogenic differentiation of CSCs isolated from vehicle or D + Q–treated T2DM mice compared with CSCs from CTRL mice (n = 3 biological replicates). E: Bar graph and representative confocal microscopy images of BrdU-positive cardiomyocytes (arrowhead indicates BrdU-positive cardiomyocytes, green; cTnI, red; PCM1, white; nuclei, DAPI blue) in D + Q–treated T2DM mouse compared vehicle-treated mouse heart sections. Scale bar = 25 μm (n = 6 biological replicates). Data are mean ± SD. CM, cardiomyocyte; diff, differentiated; expr, expression; VEH., vehicle.

References

    1. Dunlay SM, Givertz MM, Aguilar D, et al. .; American Heart Association Heart Failure and Transplantation Committee of the Council on Clinical Cardiology; Council on Cardiovascular and Stroke Nursing and the Heart Failure Society of America . Type 2 diabetes mellitus and heart failure: a scientific statement from the American Heart Association and the Heart Failure Society of America: This statement does not represent an update of the 2017 ACC/AHA/HFSA heart failure guideline update. Circulation 2019;140:e294–e324 - PubMed
    1. Gude NA, Broughton KM, Firouzi F, Sussman MA. Cardiac ageing: extrinsic and intrinsic factors in cellular renewal and senescence. Nat Rev Cardiol 2018;15:523–542 - PubMed
    1. Halim M, Halim A. The effects of inflammation, aging and oxidative stress on the pathogenesis of diabetes mellitus (type 2 diabetes). Diabetes Metab Syndr 2019;13:1165–1172 - PubMed
    1. van Deursen JM. The role of senescent cells in ageing. Nature 2014;509:439–446 - PMC - PubMed
    1. Lewis-McDougall FC, Ruchaya PJ, Domenjo-Vila E, et al. . Aged-senescent cells contribute to impaired heart regeneration. Aging Cell 2019;18:e12931. - PMC - PubMed

Publication types