. 2022 Apr;52(4):618-632.
doi: 10.1002/eji.202149745. Epub 2022 Feb 13.

Structure-guided stabilization of pathogen-derived peptide-HLA-E complexes using non-natural amino acids conserves native TCR recognition

Affiliations

Structure-guided stabilization of pathogen-derived peptide-HLA-E complexes using non-natural amino acids conserves native TCR recognition

Claire Barber et al. Eur J Immunol. 2022 Apr.

Abstract

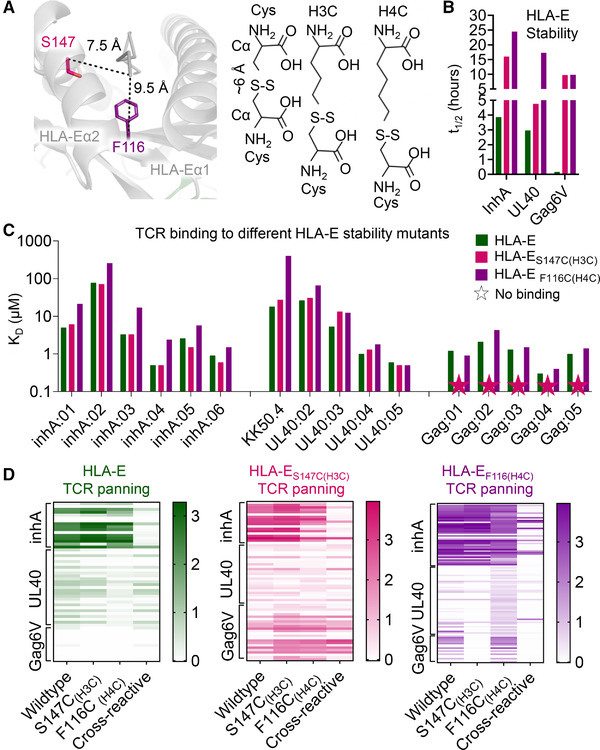
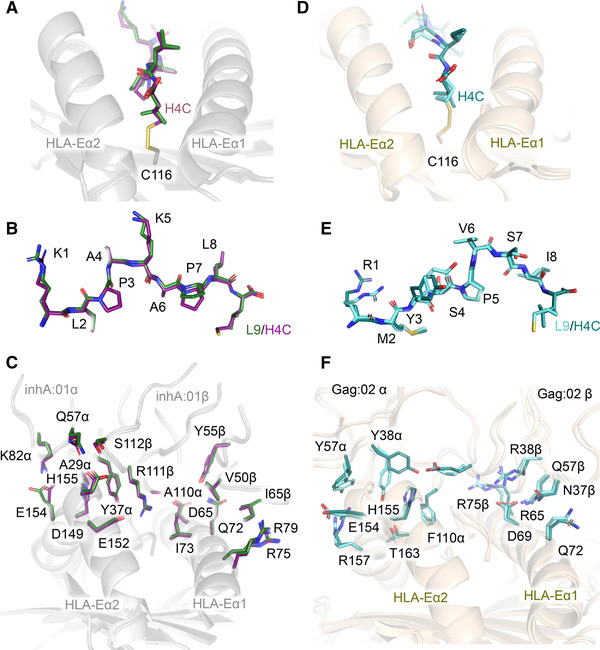
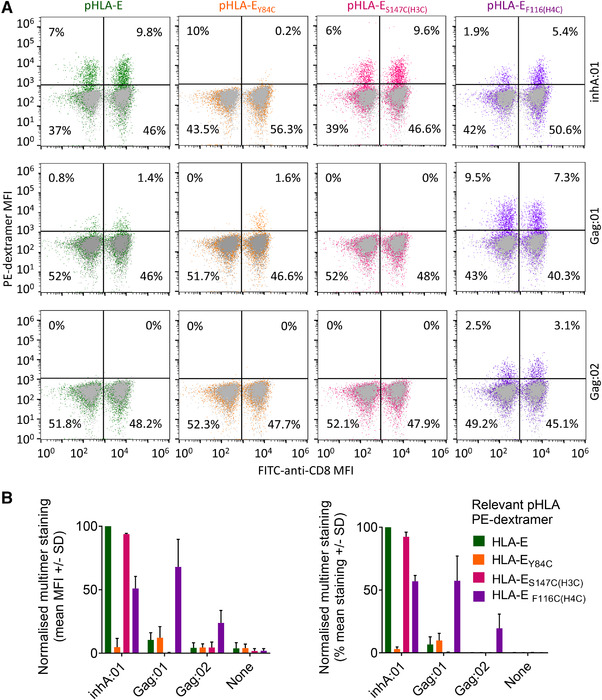
The nonpolymorphic class Ib molecule, HLA-E, primarily presents peptides from HLA class Ia leader peptides, providing an inhibitory signal to NK cells via CD94/NKG2 interactions. Although peptides of pathogenic origin can also be presented by HLA-E to T cells, the molecular basis underpinning their role in antigen surveillance is largely unknown. Here, we solved a co-complex crystal structure of a TCR with an HLA-E presented peptide (pHLA-E) from bacterial (Mycobacterium tuberculosis) origin, and the first TCR-pHLA-E complex with a noncanonically presented peptide from viral (HIV) origin. The structures provided a molecular foundation to develop a novel method to introduce cysteine traps using non-natural amino acid chemistry that stabilized pHLA-E complexes while maintaining native interface contacts between the TCRs and different pHLA-E complexes. These pHLA-E monomers could be used to isolate pHLA-E-specific T cells, with obvious utility for studying pHLA-E restricted T cells, and for the identification of putative therapeutic TCRs.

Keywords: HIV; HLA-E; TCR; crystal structure; non-natural amino acids.


Conflict of interest statement

All authors are, or were, employees of Immunocore Ltd.

Figures

Figure 1
Figure 1
Pathogen‐derived pHLA‐E complexes can be highly unstable. (A) The half‐life (t 1/2) of functionally folded pathogenic and leader peptide loaded HLA‐E as assessed by surface plasmon resonance via detection over time using ILT2. Data representative of at least two independent experiments. (B) Correlation of t 1/2 of pathogenic and leader peptide loaded HLA‐E as assessed by surface plasmon resonance versus average thermal melting point (Tm) as assessed by thermal shift assay. Data representative of two independent experiments. (C) Pathogenic and leader peptides binding to HLA‐E as assessed by HLA‐E upregulation at the cell surface by flow cytometry detection using an HLA‐E antibody. Bar graphs display HLA‐E stabilization (% cells in PE gate) with corresponding histograms plots and MFI values of PE‐anti‐HLA‐E staining. The negative control sample shows results for unpulsed cells stained with PE‐anti‐HLA‐E (grey histogram). Gating performed as shown in Supporting information Figure S1. Data representative of two independent experiments. Purple = bacterially derived peptides, blue = virally derived peptides and green = self‐derived peptides.
Figure 2
Figure 2
Structural overview of the inhA:01‐HLA‐E‐inhA and Gag:02‐HLA‐E‐Gag6V complexes. (A) LEFT: overview of the inhA:01‐HLA‐E‐inhA complex (inhA:01 TCR shown as green cartoon, HLA‐E shown as gray ribbon, inhA53‐61 shown as green sticks). RIGHT: superposition of the inhA:01‐HLA‐E‐inhA complex with the KK50.4‐HLA‐E‐UL40 complex (PDB code: 2ESV) (inhA:01 TCR shown as green cartoon, KK50.4 TCR shown as cyan cartoon, UL4015‐23 shown as cyan sticks). (B) Top‐down view of the positioning of the inhA:01 TCR CDR loops (shown as colored surface) over HLA‐E‐inhA. (C) Superposition of HLA‐E bound inhA53‐61, CMV UL4015‐23 and LB73‐11 (shown as gray sticks, PDB code: 1MHE). (D) LEFT: overview of the Gag:02‐HLA‐E‐Gag6V complex (Gag:02 TCR shown as pink cartoon, Gag6V276‐284 shown as pink sticks). RIGHT: superposition of the Gag:02‐HLA‐E‐Gag6V complex with the KK50.4‐HLA‐E‐UL40 complex (PDB code: 2ESV). (E) Top‐down view of the positioning of the Gag:02 TCR CDR loops (shown as colored surface) over HLA‐E‐Gag6V (gray surface with Gag6V276‐284 shown as pink sticks). (F) Superposition of HLA‐E bound inhA53‐61, CMV UL4015‐23 and Gag6V276‐284.
Figure 3
Figure 3
Key interactions in the inhA:01‐HLA‐E‐inhA and Gag:02‐HLA‐E‐Gag6V complexes. (A) Main inhA:01 TCR interactions with HLA‐Eα1 (green sticks). (B) Main inhA:01 TCR interactions with HLA‐Eα2 (green sticks). (C) inhA:01 TCR interactions with inhA53‐61 (green sticks). (D) Surface (gray) representation of the pocket formed by the inhA:01 TCR residues A30, Y32, Q96 and R98 (green sticks) interacting with inhA53‐61 residue K5 (green sticks). (E) Main Gag:02 TCR interactions with HLA‐Eα1 (pink sticks). (F) Main Gag:02 TCR interactions with HLA‐Eα2 (pink sticks). (G) Gag:02 TCR interactions with Gag6V276‐284 (pink sticks). Hydrogen bonds (<3.4Å) are shown as red dotted lines. Gray dots indicate sphere of vdW (<4Å) interactions.
Figure 4
Figure 4
Characterization of stability of, and TCR binding to, HLA‐E with conventional cysteine trapped pHLA. (A) The t 1/2 of pathogenic and leader peptide‐loaded HLA‐E as assessed by surface plasmon resonance. WT pHLA‐E shown as green bars, pHLA‐EY84C shown as orange bars, and HLA‐EY84C/A139C shown as blue bars. Data representative of two independent experiments. (B) Heat map of ELISA results from inhA, UL40, or Gag6V phage biopanning outputs using WT HLA‐E (green), or HLA‐EY84C (orange). Clones are arranged horizontally across the heat map and are grouped along the y‐axis according to which HLA‐E target complex they were panned against. Antigens tested by ELISA are indicted along the x‐axis; Wildtype = unmodified pHLA‐E. Y84C = HLA‐EY84Cpeptide. Cross‐reactive = TCRs that bind to a mixture of leader peptides presented by HLA‐E. (C) TCR binding affinity, as assessed by surface plasmon resonance, depicting the equilibrium dissociation constant (KD ) of the WT pHLA‐E (green bars) and the cysteine trapped pHLA variants (pHLA‐EY84C–orange bars and pHLA‐EY84C/A139C–blue bars) for multiple different TCRs recognizing inhA, UL40 and Gag6V peptides. Colored stars = no binding detected. Data representative of at least two independent experiments. (D) Superposition of the inhA:01 TCR in complex with WT HLA‐E‐inhA, or HLA‐EY84C‐inhA. Key differences in TCR contacts between wildtype HLA‐E‐inhA and HLA‐EY84C‐inhA are shown in green sticks and orange sticks, respectively. The arrow shows the flipped orientation of D149 in the inhA:01‐HLA‐EY84C‐inhA complex.
Figure 5
Figure 5
Characterization of stability of, and TCR binding to, HLA‐E with non‐natural amino acid trapped peptides. (A) LEFT: Wildtype apo pHLA‐E (gray cartoon) with the residues for non‐natural amino acid cysteine trapping drawn as colored sticks. RIGHT: Representation of distance between Cα positions in disulfide bonded pair of cysteine residues compared to non‐natural cysteine‐like amino acids with additional methylene groups. (B) The t 1/2 of inhA, UL40, and Gag6V peptide‐loaded HLA‐E. WT pHLA‐E shown as green bars, HLA‐ES147C(H3C)peptide shown as pink bars, and HLA‐EF116C(H4C)peptide shown as purple bars. Data representative of two independent experiments. (C) TCR binding affinity, as assessed by surface plasmon resonance, depicting equilibrium dissociation constant (KD ) of the WT pHLA‐E (green bars) and the non‐natural amino acid trapped peptide variants (pHLA‐ES147C(H3C)peptide – pink bars and pHLA‐EF116C(H4C)peptide – purple bars) for multiple different TCRs recognizing inhA, UL40, and Gag6V peptides. Colored stars = no binding detected. Data representative of at least two independent experiments. (D) Heat map of ELISA results from inhA, UL40, or Gag6V phage biopanning outputs using WT HLA‐E (green), HLA‐ES147C(H3C)peptide (pink), or HLA‐EF116C(H4C)peptide (purple). Clones are arranged horizontally across the heat map and are grouped along the y‐axis according to which HLA‐E target complex they were panned against. Antigens tested by ELISA are indicted along the x‐axis; Wildtype = unmodified pHLA‐E, S147C(H3C) = S147C(H3C)peptide, F116C(H4C) = F116C(H4C)peptide. Cross‐reactive = TCRs that bind to a mixture of leader peptides presented by HLA‐E.
Figure 6
Figure 6
Structural comparison of HLA‐E‐inhA‐ and HLA‐E‐Gag6V‐specific TCRs bound to their respective WT pHLA‐E and pHLA‐EF116C(H4C)peptide complexes. (A‐C) Superposition of the WT inhA:01‐HLA‐E‐inhA complex and inhA:01‐HLA‐EF116C(H4C)inhA complex calculated considering the HLA chain only. (A) HLA‐E‐inhA and HLA‐EF116C(H4C)inhA with HLA‐E shown in gray ribbon, inhA peptide shown in dark green sticks, and HLA‐EF116C shown in gray ribbon with C116 as sticks, H4C inhA‐modified peptide shown in purple sticks. (B) inhA peptide presented by WT HLA‐E, and HLA‐EF116C(H4C)inhA. (C) inhA:01 TCR in complex with WT HLA‐E‐inhA or HLA‐EF116C(H4C)inhA showing key TCR‐pHLA interface contacts between WT HLA‐E‐inhA and HLA‐EF116C(H4C)inhA. (D‐F) Superposition of the WT Gag:02‐HLA‐E‐Gag6V complex and Gag:02‐HLA‐EF116C(H4C)Gag6V complex calculated considering the HLA chain only. (D) HLA‐E‐Gag6V and HLA‐EF116C(H4C)Gag6V with HLA‐E shown in wheat ribbon, H4C Gag6V276‐284 peptide shown in deep teal sticks, and HLA‐EF116C shown in wheat ribbon with C116 as sticks, Gag6V276‐284‐modified peptide shown in aquamarine sticks. (E) Wildtype HLA‐E‐Gag6V, and HLA‐EF116C(H4C)Gag6V. (F) Gag:02 TCR in complex with WT HLA‐E‐Gag6V or HLA‐EF116C(H4C)inhA showing key TCR‐pHLA interface contacts between WT HLA‐E‐Gag6V and HLA‐EF116C(H4C)Gag6V.
Figure 7
Figure 7
Identification of pHLA‐E‐specific T cells using WT, and non‐natural amino acid stabilized, pHLA‐E complex multimers. (A) Healthy PBMCs, lentivirally transduced to express WT TCRs recognizing HLA‐E‐inhA (inhA:01 TCR) or HLA‐E‐Gag6V (Gag6V:01, or Gag6V:02 TCRs) were stained with PE‐dextramers assembled with WT HLA‐E, HLA‐EY84C, HLA‐ES147C(H3C)peptide, or HLA‐EF116C(H4C)peptide in complex with either inhA53‐61 or Gag6V276‐284. Flow cytometry was used to detect the % of dextramer positive CD8+, or CD8 T cells. Dot plots from one donor is shown as representative of n = 4 and n = 2 healthy PBMC donors for HLA‐E‐inhA or HLA‐E‐Gag6V‐specific TCRs, respectively. (B) Combined data from all donors as described in (A) normalized to PBMCs transduced with the inhA:01 TCR stained with WT HLA‐E‐inhA dextramer. Dextramer positive CD8+ T‐cell staining represented as MFI (Left) and percentage stained with each dextramer (Right) is shown.

References

    1. Geraghty, D. E. , Stockschleader, M. , Ishitani, A. and Hansen, J. A. , Polymorphism at the HLA‐E locus predates most HLA‐A and ‐B polymorphism. Hum. Immunol. 1992. 33: 174–184. - PubMed
    1. Tomasec, P. , Braud, V. M. , Rickards, C. , Powell, M. B. , McSharry, B. P. , Gadola, S. , Cerundolo, V. et al., Surface expression of HLA‐E, an inhibitor of natural killer cells, enhanced by human cytomegalovirus gpUL40. Science (New York, N.Y.). 2000. 287: 1031. - PubMed
    1. Grimsley, C. and Ober, C. , Population genetic studies of HLA‐E. Hum. Immunol. 1997. 52: 33–40. - PubMed
    1. Strong, R. K. , Holmes, M. A. , Li, P. , Braun, L. , Lee, N. and Geraghty, D. E. , HLA‐E allelic variants. J. Biol. Chem. 2003. 278: 5082–5090. - PubMed
    1. Braud, V. , Yvonne Jones, E. and McMichael, A. , The human major histocompatibility complex class Ib molecule HLA‐E binds signal sequence‐derived peptides with primary anchor residues at positions 2 and 9. Eur. J. Immunol. . 1997. 27: 1164–1169. - PubMed

Publication types