

Behavioral context affects social signal representations within single primate prefrontal cortex neurons
- PMID: 35108498
- PMCID: PMC10064486
- DOI: 10.1016/j.neuron.2022.01.020
Behavioral context affects social signal representations within single primate prefrontal cortex neurons
Abstract
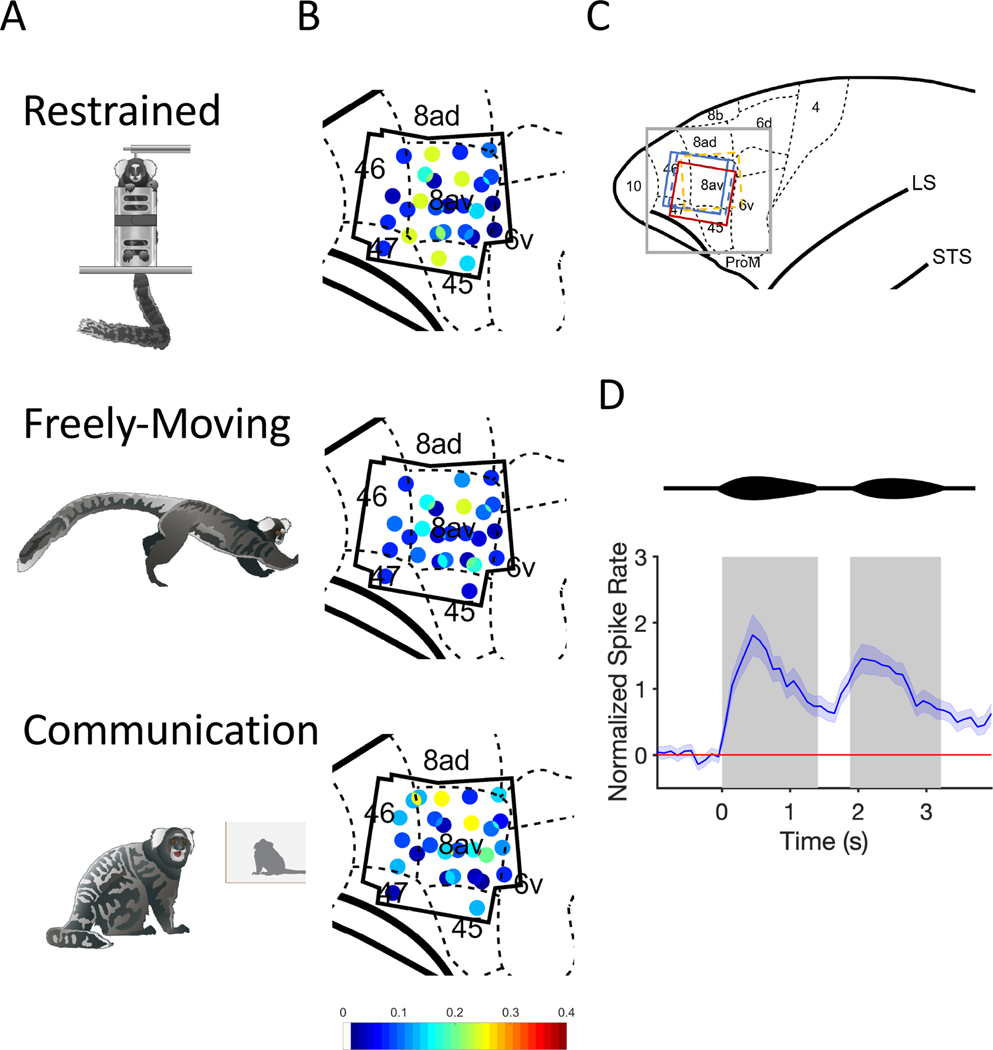
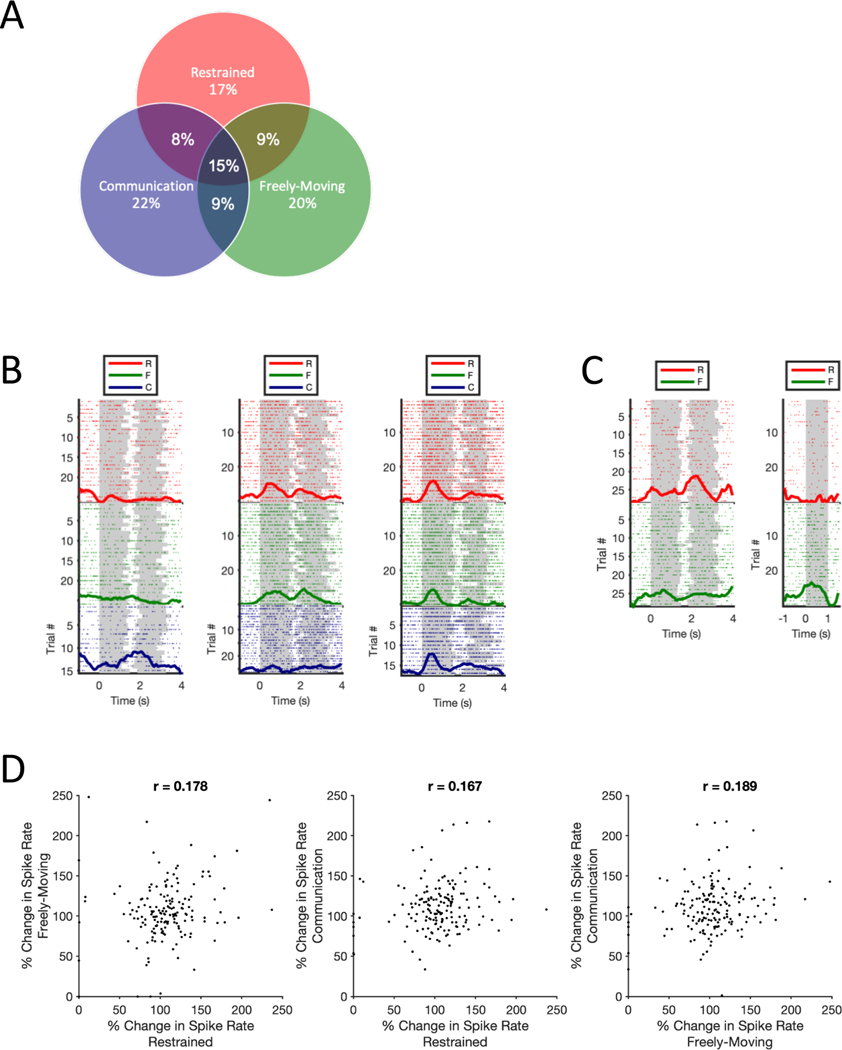
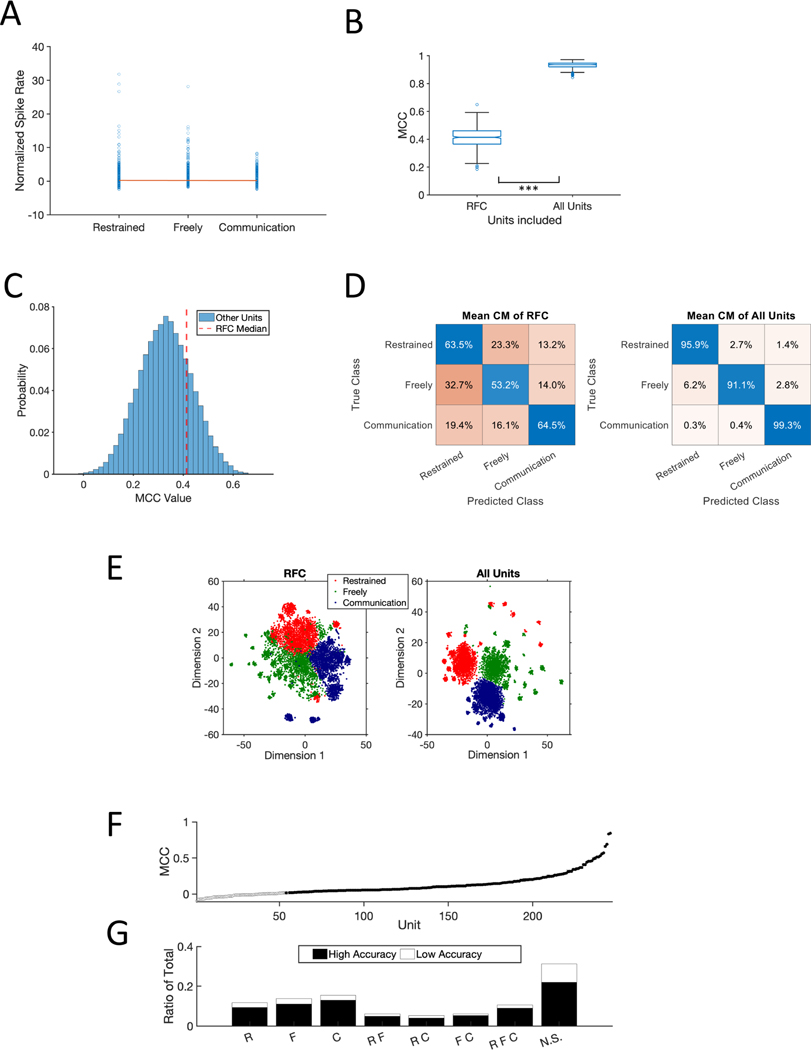
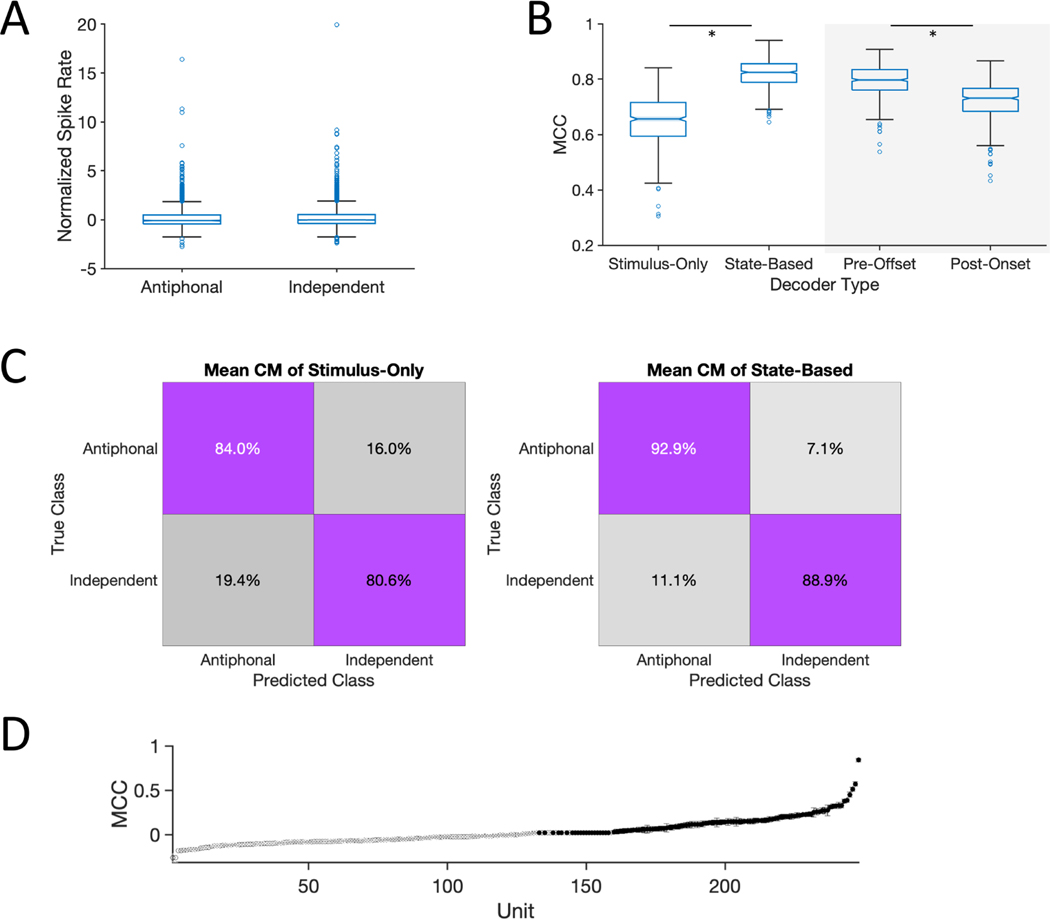
We tested whether social signal processing in more traditional, head-restrained contexts is representative of the putative natural analog-social communication-by comparing responses to vocalizations within individual neurons in marmoset prefrontal cortex (PFC) across a series of behavioral contexts ranging from traditional to naturalistic. Although vocalization-responsive neurons were evident in all contexts, cross-context consistency was notably limited. A response to these social signals when subjects were head-restrained was not predictive of a comparable neural response to the identical vocalizations during natural communication. This pattern was evident both within individual neurons and at a population level, as PFC activity could be reliably decoded for the behavioral context in which vocalizations were heard. These results suggest that neural representations of social signals in primate PFC are not static but highly flexible and likely reflect how nuances of the dynamic behavioral contexts affect the perception of these signals and what they communicate.
Keywords: faces; marmoset; natural communication; prefrontal cortex; primate; social signals; vocalizations.
Copyright © 2022 Elsevier Inc. All rights reserved.
Conflict of interest statement
Declaration of interests The authors declare no competing interests.
Figures
Comment in
-
Marmosets confirm that context is king.Neuron. 2022 Apr 20;110(8):1273-1274. doi: 10.1016/j.neuron.2022.03.029. Neuron. 2022. PMID: 35447094 Free PMC article.
Similar articles
-
Responses of primate frontal cortex neurons during natural vocal communication.J Neurophysiol. 2015 Aug;114(2):1158-71. doi: 10.1152/jn.01003.2014. Epub 2015 Jun 17. J Neurophysiol. 2015. PMID: 26084912 Free PMC article.
-
Social Context-Dependent Activity in Marmoset Frontal Cortex Populations during Natural Conversations.J Neurosci. 2017 Jul 19;37(29):7036-7047. doi: 10.1523/JNEUROSCI.0702-17.2017. Epub 2017 Jun 19. J Neurosci. 2017. PMID: 28630255 Free PMC article.
-
Distinct Neural Activities in Premotor Cortex during Natural Vocal Behaviors in a New World Primate, the Common Marmoset (Callithrix jacchus).J Neurosci. 2016 Nov 30;36(48):12168-12179. doi: 10.1523/JNEUROSCI.1646-16.2016. J Neurosci. 2016. PMID: 27903726 Free PMC article.
-
Coding of vocalizations by single neurons in ventrolateral prefrontal cortex.Hear Res. 2013 Nov;305:135-43. doi: 10.1016/j.heares.2013.07.011. Epub 2013 Jul 26. Hear Res. 2013. PMID: 23895874 Free PMC article. Review.
-
Cognitive control of vocalizations in the primate ventrolateral-dorsomedial frontal (VLF-DMF) brain network.Neurosci Biobehav Rev. 2017 Nov;82:32-44. doi: 10.1016/j.neubiorev.2016.12.001. Epub 2016 Dec 5. Neurosci Biobehav Rev. 2017. PMID: 27923733 Review.
Cited by
-
Orbitofrontal cortex populations are differentially recruited to support actions.Curr Biol. 2022 Nov 7;32(21):4675-4687.e5. doi: 10.1016/j.cub.2022.09.022. Epub 2022 Oct 3. Curr Biol. 2022. PMID: 36195096 Free PMC article.
-
Marmosets confirm that context is king.Neuron. 2022 Apr 20;110(8):1273-1274. doi: 10.1016/j.neuron.2022.03.029. Neuron. 2022. PMID: 35447094 Free PMC article.
-
Active vision in freely moving marmosets using head-mounted eye tracking.bioRxiv [Preprint]. 2024 Nov 21:2024.05.11.593707. doi: 10.1101/2024.05.11.593707. bioRxiv. 2024. Update in: Proc Natl Acad Sci U S A. 2025 Feb 11;122(6):e2412954122. doi: 10.1073/pnas.2412954122. PMID: 38766147 Free PMC article. Updated. Preprint.
-
The neurobiology of vocal communication in marmosets.Ann N Y Acad Sci. 2023 Oct;1528(1):13-28. doi: 10.1111/nyas.15057. Epub 2023 Aug 24. Ann N Y Acad Sci. 2023. PMID: 37615212 Free PMC article. Review.
-
Neural activity for complex sounds in the marmoset anterior cingulate cortex.Commun Biol. 2024 Oct 11;7(1):1310. doi: 10.1038/s42003-024-07019-2. Commun Biol. 2024. PMID: 39394433 Free PMC article.
References
-
- Ainsworth M, Sallet J, Joly O, Kyriazis D, Kriegeskorte N, Duncan J, Schüffelgen U, Rushworth MFS, and Bell AH (2021). Viewing Ambiguous Social Interactions Increases Functional Connectivity between Frontal and Temporal Nodes of the Social Brain. The Journal of Neuroscience 41, 6070–6086. - PMC - PubMed
Publication types
MeSH terms
Grants and funding
LinkOut - more resources
Full Text Sources
Miscellaneous
