. 2022 Feb 17;185(4):690-711.e45.
doi: 10.1016/j.cell.2021.12.045. Epub 2022 Feb 1.

Mapping transcriptomic vector fields of single cells

Affiliations

Mapping transcriptomic vector fields of single cells

Xiaojie Qiu et al. Cell. .

Abstract

Single-cell (sc)RNA-seq, together with RNA velocity and metabolic labeling, reveals cellular states and transitions at unprecedented resolution. Fully exploiting these data, however, requires kinetic models capable of unveiling governing regulatory functions. Here, we introduce an analytical framework dynamo (https://github.com/aristoteleo/dynamo-release), which infers absolute RNA velocity, reconstructs continuous vector fields that predict cell fates, employs differential geometry to extract underlying regulations, and ultimately predicts optimal reprogramming paths and perturbation outcomes. We highlight dynamo's power to overcome fundamental limitations of conventional splicing-based RNA velocity analyses to enable accurate velocity estimations on a metabolically labeled human hematopoiesis scRNA-seq dataset. Furthermore, differential geometry analyses reveal mechanisms driving early megakaryocyte appearance and elucidate asymmetrical regulation within the PU.1-GATA1 circuit. Leveraging the least-action-path method, dynamo accurately predicts drivers of numerous hematopoietic transitions. Finally, in silico perturbations predict cell-fate diversions induced by gene perturbations. Dynamo, thus, represents an important step in advancing quantitative and predictive theories of cell-state transitions.

Keywords: RNA Jacobian; RNA metabolic labeling; cell-fate transitions; differential geometry analysis; dynamical systems theory; dynamo; hematopoiesis; in silico perturbation; least action path; vector field reconstruction.


Conflict of interest statement

Declaration of interests E.S.L. is currently on leave from MIT and Harvard to serve as the Director of the White House Office of Science and Technology Policy. J.S.W. declares outside interest in 5 AM Venture, Amgen, Chroma Medicine, KSQ Therapeutics, Maze Therapeutics, Tenaya Therapeutics, Tessera Therapeutics, and Third Rock Ventures. V.G.S. serves as an advisor to and/or has equity in Novartis, Forma, Cellarity, Ensoma, and Branch Biosciences. All interests mentioned earlier are unrelated to this work.

Figures
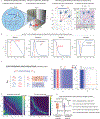
Figure 1:
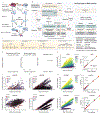
Figure 1:. Modeling single-cell expression dynamics using velocity vector field functions and differential geometry analyses.
A. Cell state transition under dynamical systems framework. 1) The toggle-switch motif of two genes (whose instantaneous expression levels are denoted as x1 and x2) and one of their downstream targets, x3, are embedded in an unknown complex regulatory network. 2) Cell fate transitions as trajectories in a high-dimensional state space spanned by state descriptors. Here a three-dimensional state space is used to reveal the dynamics of the highlighted three-gene system from 1. Any point in this space represents a network state S(t) = (x1, x2, x3) at time t. Three example states S1, S2, and S3 and their convergent trajectories toward the same stable attractor state, A1, are shown. 3) Global view of cell dynamics via vector field functions. 4) Topological features of the vector field. Important features include: steady states, and saddle points, attractor basins, separatrices, and nullclines. Definition of these features can be found in STAR Methods. The vector field function of genes x1 and x2 is included in 1) (Qiu et al., 2012) B. Velocity and Jacobian along the dashed line indicated in A4. Calculating the derivative of the velocity of x1, f1 (1th-panel) or that of x2, f2 (3th-panel) along the indicated line gives rise to the Jacobian terms J11 (self-activation of gene x1) or J21 (inhibition of x2 by x1). C. The Jacobian (left) of a vector field function reflects state-dependent gene interactions in the state space, represented as a heatmap (right). D. Acceleration and curvature vector fields of single-cell gene expression. Color of the heatmaps corresponds to the length of the acceleration and curvature vectors at each point in the state space. Quivers correspond to the acceleration or curvature vectors. For C/D, see more details in Box 1. E. Summary of the task of mapping vector field functions from transcriptomic data, formulated as a machine learning problem, with downstream validations, analyses and predictions.
Figure 2:
Figure 2:. Inclusive model of single-cell expression dynamics incorporates RNA metabolic labeling.
A. A comprehensive model of expression kinetics that includes promoter state switch, metabolic labeling, transcription, splicing, translation, and RNA/protein degradation. A and I correspond to active and inhibitive promoter states, whereas ρ is the fraction of labeled RNA (STAR Methods). uu, ul, su, and sl are respectively unspliced unlabeled, unspliced labeled, spliced unlabeled, and spliced labeled RNA. B. Dynamo’s estimation framework of kinetic parameters for tscRNA-seq and cscRNA-seq experiments. GMM: generalized methods of moments; NB: negative binomial; SS: steady state. C. Typical RNA metabolic labeling strategies and their applications. On the left, One-shot experiment, an experiments with a single RNA labeling period; kinetics experiment, a time-series of multiple durations of RNA labeling; degradation experiment, a time-series with an extended RNA labeling period, followed by chase at multiple time points; Multi-time-series experiment, single cell samples are collected at multiple time points, each with a kinetics experiment. The table on the right summarizes the main labeling strategies used in published tscRNA-seq studies. D. Comparing degradation rate constants (r) calculated from tscRNA-seq data and the relative degradation rate constants (γ˜) from the corresponding splicing data, and those from human cells or mouse cells. Each point corresponds to a gene. E. Two-step method (see STAR Methods) of the kinetics experiment [data from scEU-seq study (Battich et al., 2020)]: step 1) A strong linearity in the new–total RNA phase plane of gene UNG with ascending slope k for longer labeling times; step 2) A strong linearity between −ln(1 − k) and labeling time period t for the UNG gene. Color of data points (right) corresponds to the experimental time, as on the left. The same applies to panel I. F. Phase portraits of spliced-unspliced RNA planes of HMGB2 and HMGA2. Quivers correspond to the spliced RNA velocity. G. Same as above but for the total–new RNA planes. Quivers correspond to the total (x-component) or new (y-component) RNA velocity. H. Step 1 as in panel E but for genes HMGB2 and HMGA2. I. Step 2 as in panel E but for genes HMGB2 and HMGA2. Panels F-I all used the kinetics experiment dataset from scEU-seq study (Battich et al., 2020)
Figure 3:
Figure 3:. Metabolic labeling experiments improve and generalize RNA velocity estimation.
A. Schematic of the one-shot labeling scNT-seq experiment for human hematopoietic stem and progenitor cells (HSPCs) (STAR Methods). B. RNA velocity flow projected in the UMAP space. Left: splicing data give noisy, nonsensical velocity flow with terminal cell types moving back to progenitors. scVelo’s dynamical model (Bergen et al., 2020) was used to generate this figure (see more at Figure S3C). Right: Dynamo analysis of the labeling data reveals a smooth transition of HSCs into MEP-like and GMP-like cells, which further ramify into Meg/Ery/Bas lineages and Mon/Neu lineages, respectively. C. Gene expression distribution of PF4, an Meg lineage marker, across cells. D. Velocity magnitude of PF4 across cells. Left: spliced RNA velocities based on splicing data. Right: total RNA velocities based on labeling data with dynamo’s estimation framework. E. Phase plot of gene PF4. Left: Splicing RNA phase plot. Because of unsuccessful capture of unspliced RNA and a rapid increase of transcription rate in the Meg lineage, the majority of cells are mistakenly treated as if they are in the repression phase with negative velocity. Right: Labeling RNA phase plot. Quivers correspond to the total RNA velocity. With labeling data under dynamo’s framework, the transcription rate is modeled as a variable that depends on new RNA (n) which is measured in an unbiased manner for each gene in each cell (STAR Methods). F. Streamline plots of one-shot labeling dataset from (Cao et al., 2020b) reveal two orthogonal processes of GR response and cell cycle progression. From left to right: streamline plot on the first two principal components (PCs), the second two PCs, and the first two UMAP components that are reduced from the four PCs, respectively. G. Conventional (top) and kinetics labeling (bottom) velocity analysis of the RPE1-FUCCI cells (left) and murine intestinal organoid system (right) of the scEU-seq study. H. Conventional (top, middle) and degradation labeling (bottom) velocity analysis of the TET-dependent stepwise pluripotent–2C bidirectional transition of murine ESC in the scNT-seq study.
Figure 4.
Figure 4.. Mapping the vector field, quantifying its topography, and moving towards differential geometry analyses.
A. Functional reconstruction of the continuous and analytical velocity vector field from sparse, noisy single cell velocity measurements with sparseVFC (Ma et al., 2013) (Box 2, STAR Methods and STAR Methods). B. Reconstructed vector field and topological features of the simulated toggle-switch system. Top: Scatterplots of simulated cells (x/y-axis: expression of x1/x2, same as in C) that are colored by vector-field based pseudotime, calculated via the ddhodge algorithm (Maehara and Ohkawa, 2019). Full-cycle nodes correspond to attractors while half-cycle saddle points. Streamline plot of the reconstructed vector field is superimposed on top of the scatterplot. Bottom: x/y-nucline and separatrix, plotted on top of the streamline plot of the reconstructed vector field. C. Scatterplots of simulated cells with a frontier representing the expression boundary of sample cells (top). Cells are colored by the estimated values of the indicated Jacobian elements. Bottom: Scatterplots comparing the estimated (x-axis) and analytical (y-axis) Jacobian elements across cells. D. Same as in C but for the recovered curl and curvature. E. Same as in C but for the acceleration and curvature. Since acceleration and curvature are vectors, the streamlines of the recovered acceleration and curvature vector field are visualized. Cells are colored by the length of acceleration or curvature vectors.
Figure 5:
Figure 5:. Vector field and differential geometry analyses of human hematopoiesis.
A. Schematic of leveraging differential geometry quantities to rank genes (using either raw or absolute values) across all cells or in each cell group/state, followed by gene set enrichment, network construction, and visualization. Furthermore, dynamo can identify top toggle-switch pairs driving cell fate bifurcations. B. The reconstructed vector field and associated fixed points. The color of digits in each node reflects the type of fixed point: red, emitting fixed point; black, absorbing fixed point. The color of the numbered nodes corresponds to the confidence of the fixed points. C. Lineage tree of hematopoiesis, lumped automatically from the vector field built in the UMAP space (STAR Methods). D. Megakaryocytes appear earliest among the Meg, Ery, and Bas lineages. The vector field pseudotime is calculated based on the velocity transition matrix, as in Figure S6A. E. Megakaryocytes have the largest acceleration among all cell types. F. Molecular mechanisms underlying the early appearance of the Meg lineage. i) Self-activation of FLI1. ii) Repression of KLF1 by FLI1. iii) FLI1 represses KLF1; iv) Schematic summarizing the interactions involving FLI1 and KLF1. G. Regulatory network governing the Bas lineage’s dual origins. i) GATA2 has high expression in the Bas lineage; ii) CEBPA represses RUNX1; iii) CEBPA represses GATA2; iv) A minimal network governing GMP vs. Bas origin of Bas lineage (Figure S6I). H. Three approaches for in-depth network motif characterizations: 1) cell-wise analyses to reveal dominant interactions across all cells; 2) trajectory-wise analyses reveal trajectory dependent interactions along a trajectory (predicted either from vector field streamline, or least action path, see Figure 6). 3). Plane-wise analyses reveal direct interactions for any characteristic cell states by varying genes of interest while holding all other genes constant. I. Cell-wise analyses of the PU.1/SPI1–GATA1 network motif across all cells. i) Schematic of the SPI1-GATA1 toggle switch model. ii) Streamline plot of the RNA velocities of SPI1 (x-axis) and GATA1 (y-axis). iii) Repression from SPI1 to GATA1, GATA1 to SPI1, and self-activation of SPI1, and GATA1, in the SPI1 and GATA1 expression space. In particular, the repression from SPI1 to GATA1 is mostly discernable in progenitors (rectangle A) but becomes negligible when either GATA1 is much higher than SPI1 (rectangle B) or GATA1 is close to zero (rectangle C). iv) GATA1 has overall lower expression in the HSC state than SPI1. v) Similar to iii) but replaced with a response heatmap (Qiu et al., 2020b). White dashed lines indicate the minimum or maximum of repression or activation and the corresponding expression threshold.
Figure 6:
Figure 6:. Least action path approach accurately predicts optimal cellular conversion paths.
A. The grand problem of predicting OPtimal cell-fate Conversions (OPCs). B. Predicting OPCs for hematopoietic cell types. i) The developmental tree, known dedifferentiation and transdifferentiation events previously reported for the six cell types observed in our data. ii) Matrix representation of subpanel i. iii). The optimal paths for hematopoietic transitions can be found by identifying the LAPs between the fixed points that correspond to each stable cell type (STAR Methods). C. Predicted optimal developmental path (a.k.a. developmental LAP) from HSC to each of the terminal cell types in the UMAP embedding. Color of the node along the paths indicates the LAP transition time. D. The transition time of HSC to Meg lineage LAP (31 hour) is the shortest among all developmental LAPs. E. Action (STAR Methods) of the LAPs of transitions between any two hematopoietic cell states. F. Three TF-activation waves along the LAP from HSC to Bas lineage. G. Majority of TFs involved in known hematopoietic transdifferentiation are accurately prioritized by LAP predictions (STAR Methods). H. Receiver operating curve analyses of LAP TF priority predictions when using all known genes of all known transitions as the gold standard (STAR Methods). AUC: area under curve.
Figure 7:
Figure 7:. in silico perturbation dissects cell fate transitions under genetic perturbation
A. In silico genetic perturbation of the velocity vector field. i) In silico perturbation can predict the gene-wise response. ii) In silico perturbation can predict the cell fate trajectory after genetic perturbation by integrating the displacement of velocities across cells. B. Validation of in silico trajectory predictions. i) Suppression of SPI1 diverts cells from MEP-related lineages to GMP-related lineages. ii) Suppression of GATA1 diverts cells from GMP-related lineages to MEP-related lineages. iii) Suppression of both SPI1 and GATA1 traps cells in the progenitor states. iv) Activation of KLF1 diverts cells into the Ery lineage. v) Suppression of HLF1 leads to differentiation of HSCs. vi) Triple activation of GATA1, KLF1, and TAL1 leads to transdifferentiation of other lineages into erythrocytes.
Box Fig. 1.
Box Fig. 1.
Divergence, curl, acceleration and curvature of vector field.
Box Fig. 2.
Box Fig. 2.
Learning a vector field function expressed as a linear combination of a set of basis functions in the function space.

References

    1. Adamson B, Norman TM, Jost M, Cho MY, Nuñez JK, Chen Y, Villalta JE, Gilbert LA, Horlbeck MA, Hein MY, et al. (2016). A Multiplexed Single-Cell CRISPR Screening Platform Enables Systematic Dissection of the Unfolded Protein Response. Cell 167, 1867–1882.e21. - PMC - PubMed
    1. Alon U (2006). An Introduction to Systems Biology.
    1. Aurell E, and Sneppen K (2002). Epigenetics as a first exit problem. Phys. Rev. Lett. 88, 048101. - PubMed
    1. Baker M (2010). Taking a long, hard look. Nature 466, 1137–1138. - PubMed
    1. Barile M, Imaz-Rosshandler I, Inzani I, Ghazanfar S, Nichols J, Marioni JC, Guibentif C, and Göttgens B (2021). Coordinated changes in gene expression kinetics underlie both mouse and human erythroid maturation. Genome Biol. 22, 197. - PMC - PubMed

Publication types

LinkOut - more resources