. 2022 Feb 1;34(2):256-268.e5.
doi: 10.1016/j.cmet.2021.12.021.

Heterogenous impairment of α cell function in type 2 diabetes is linked to cell maturation state

Affiliations

Heterogenous impairment of α cell function in type 2 diabetes is linked to cell maturation state

Xiao-Qing Dai et al. Cell Metab. .

Abstract

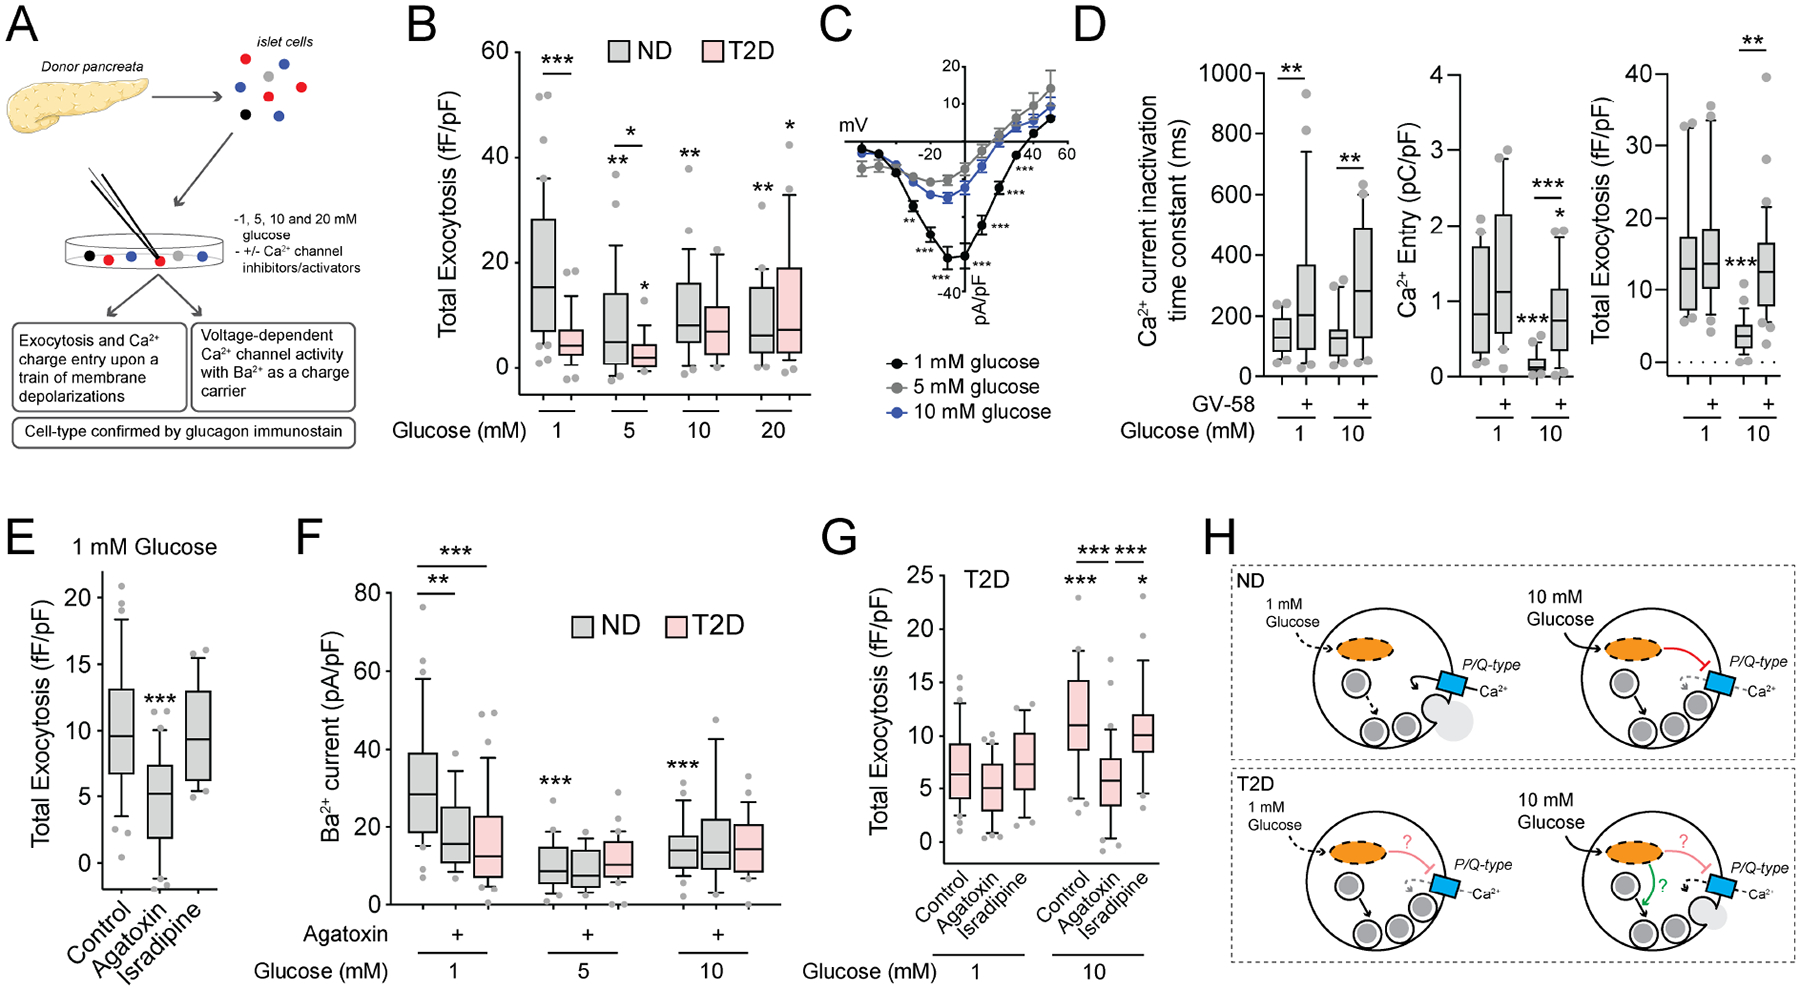
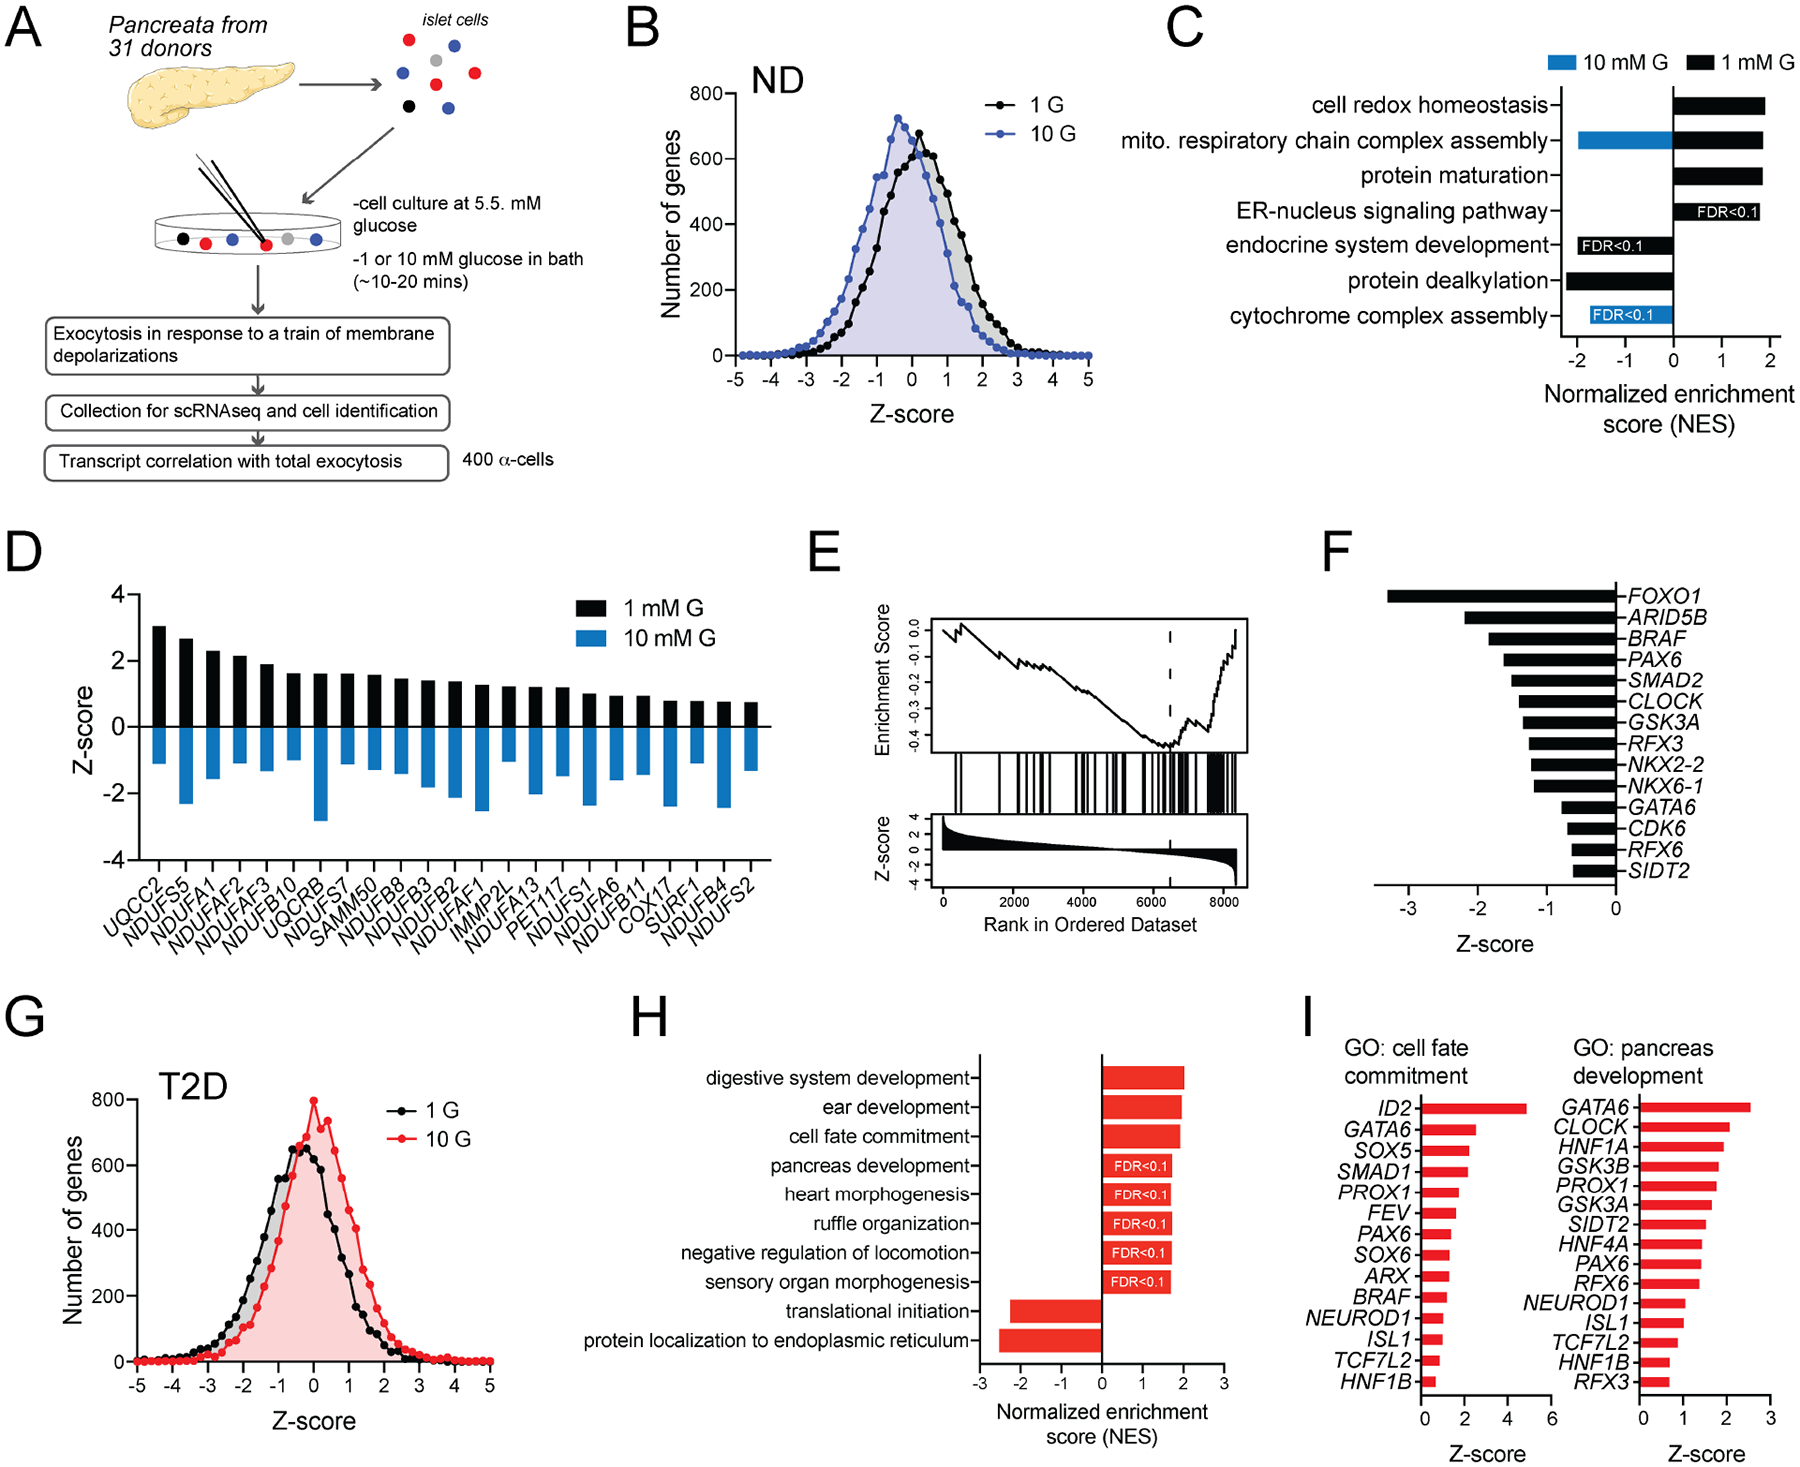
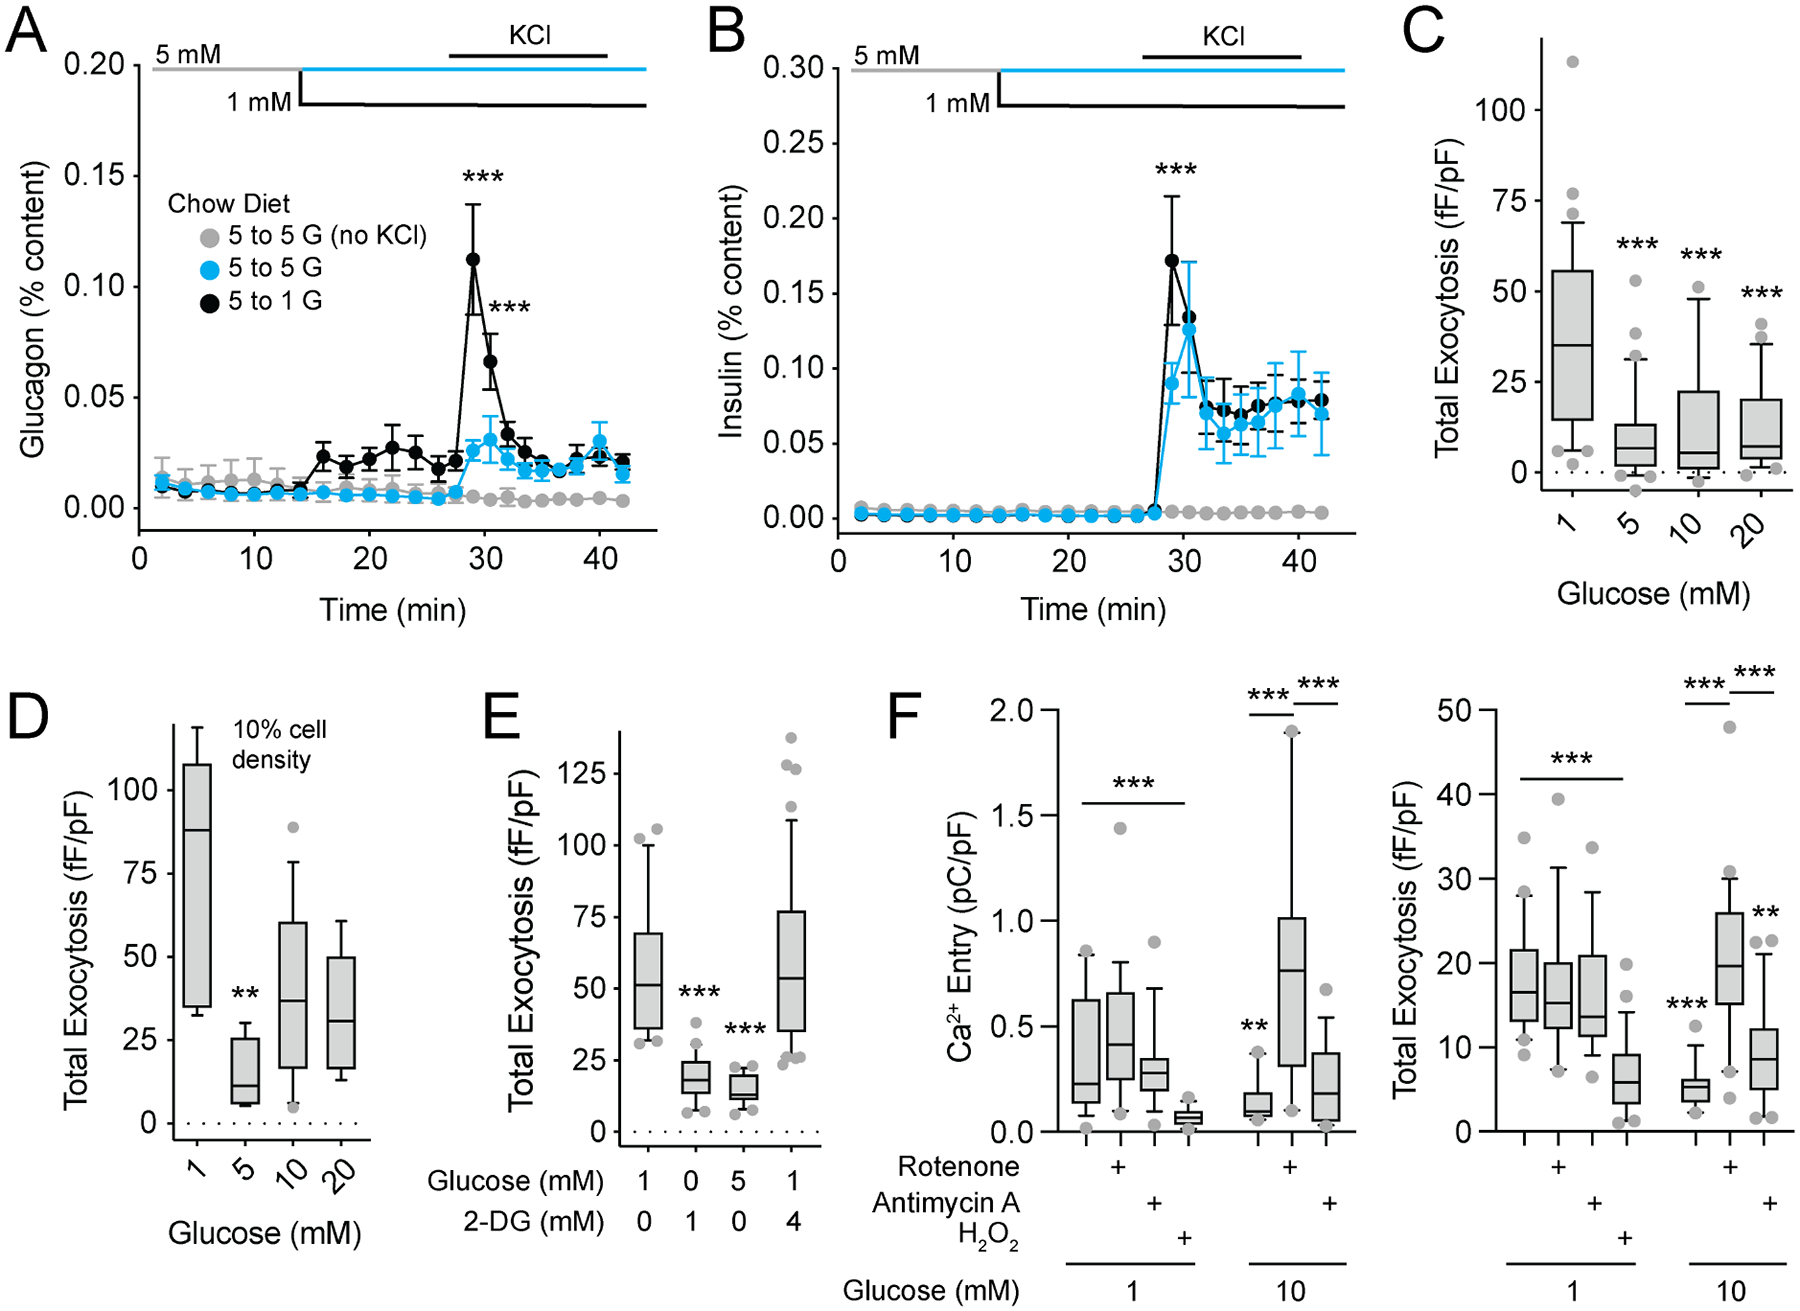
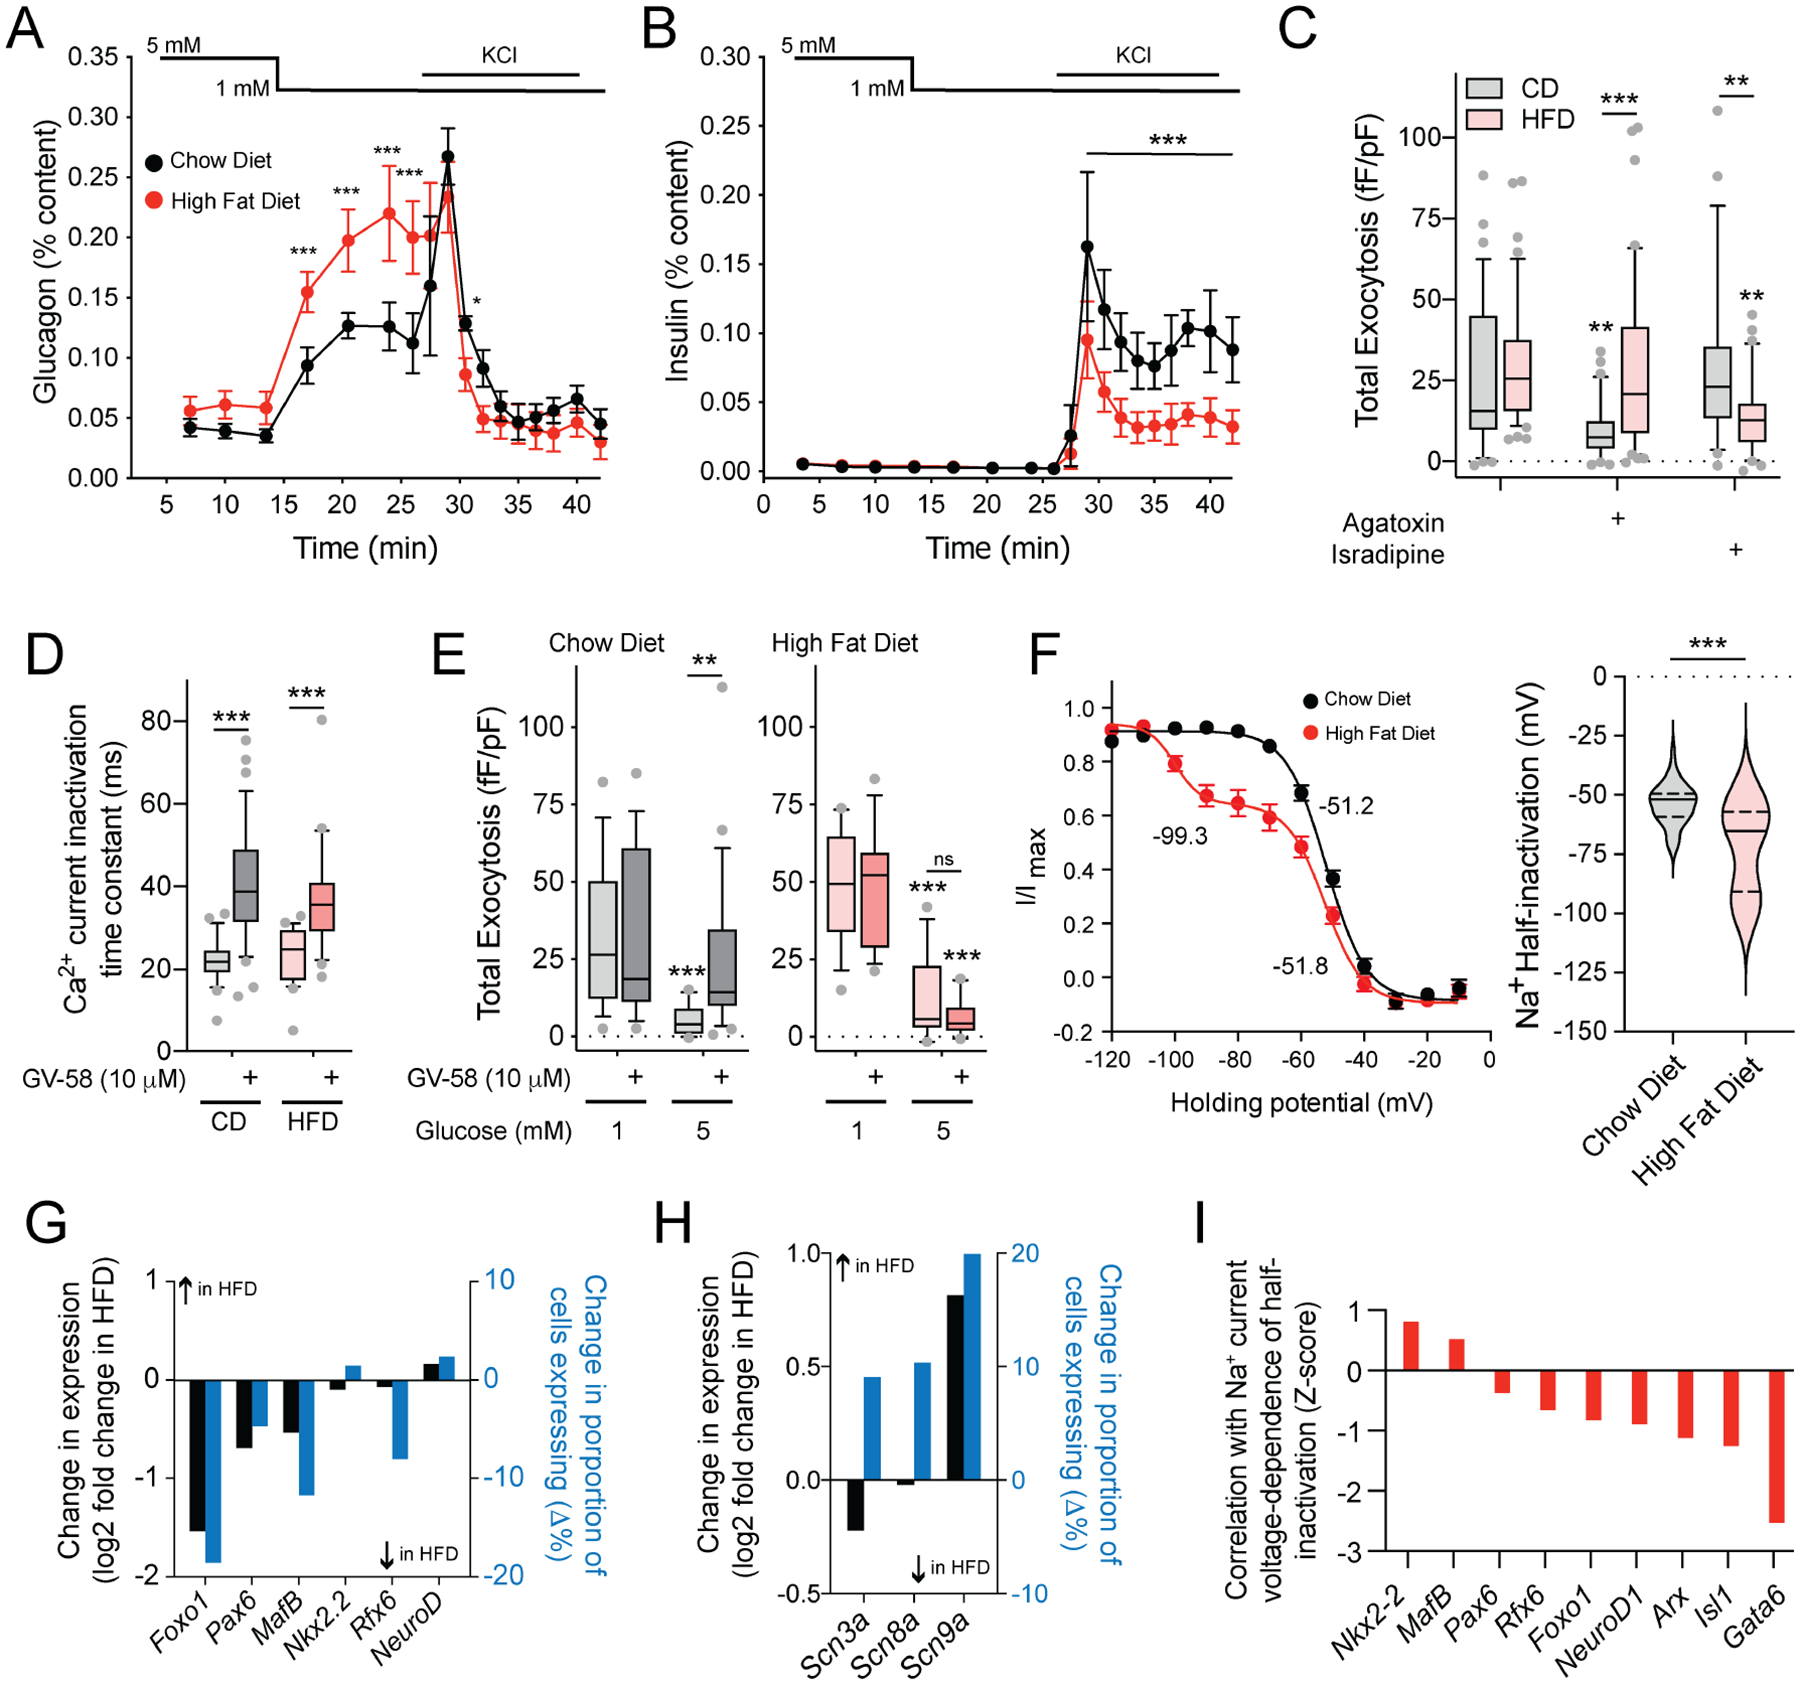
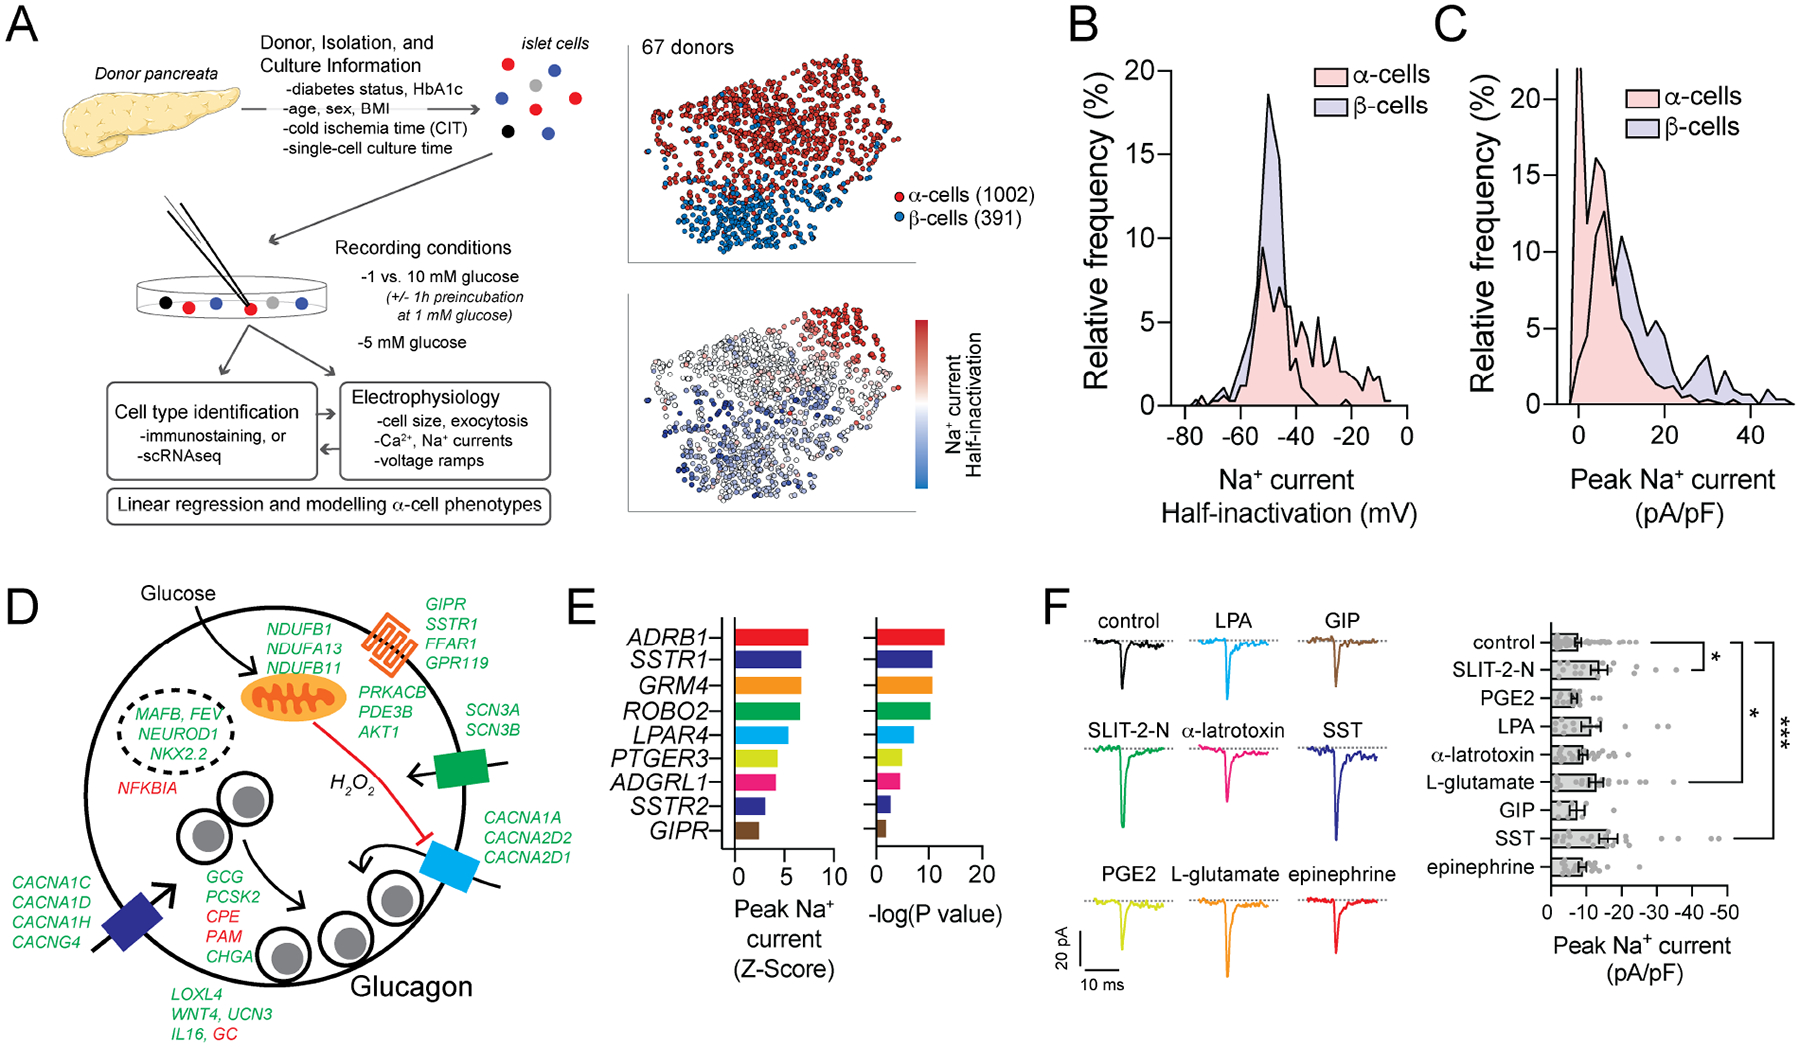
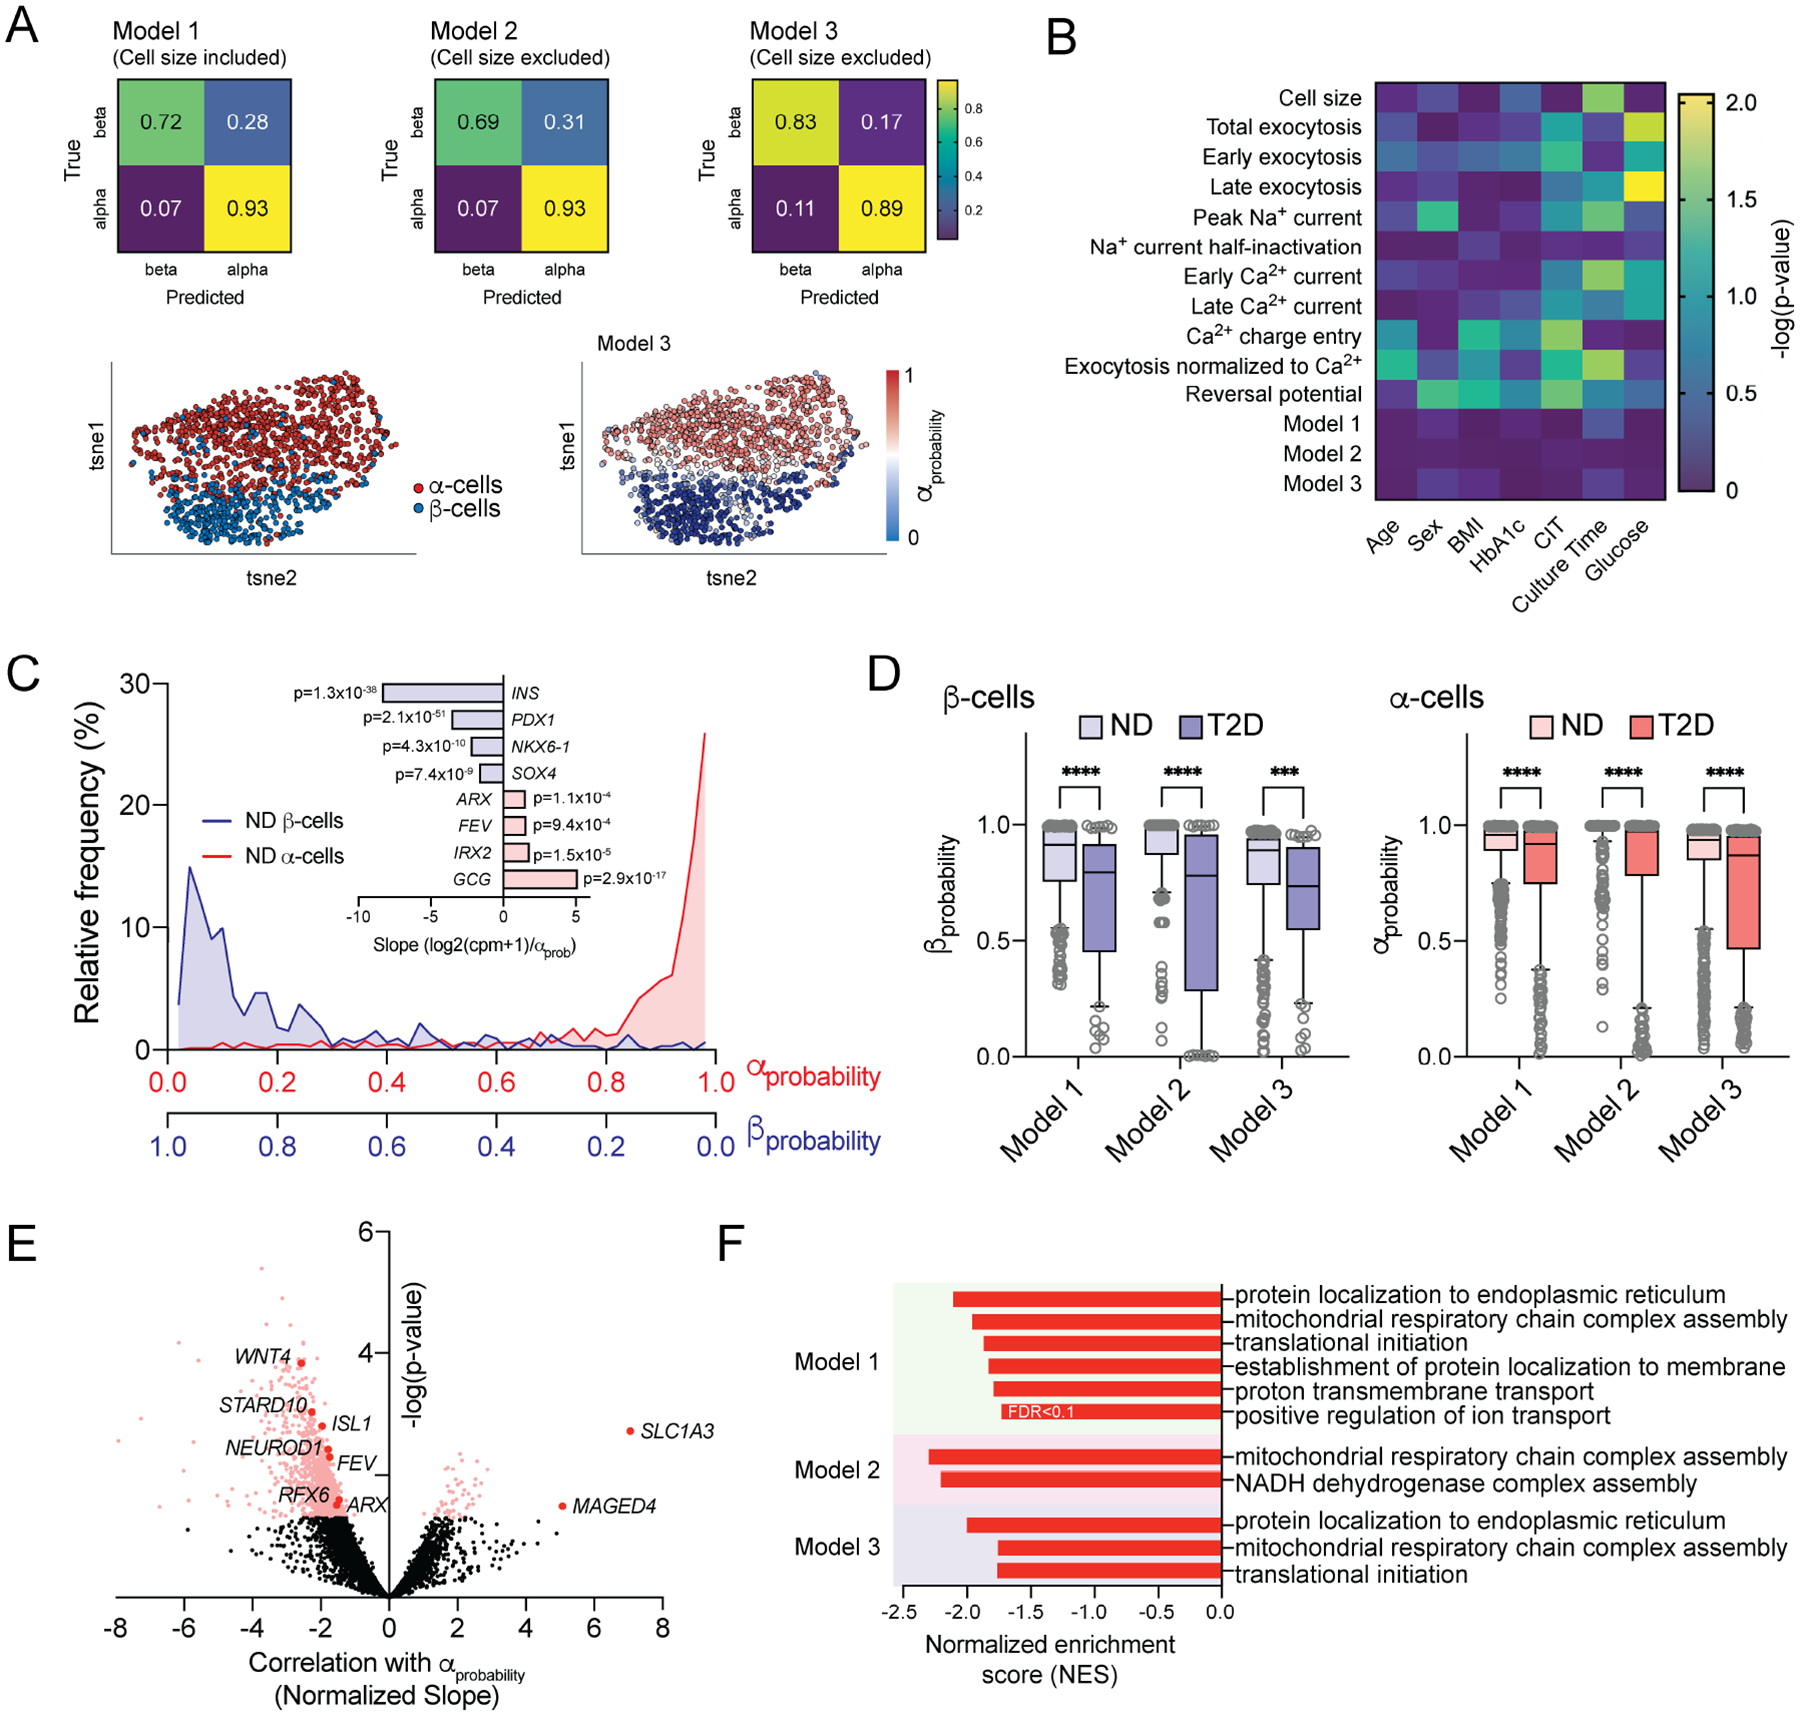
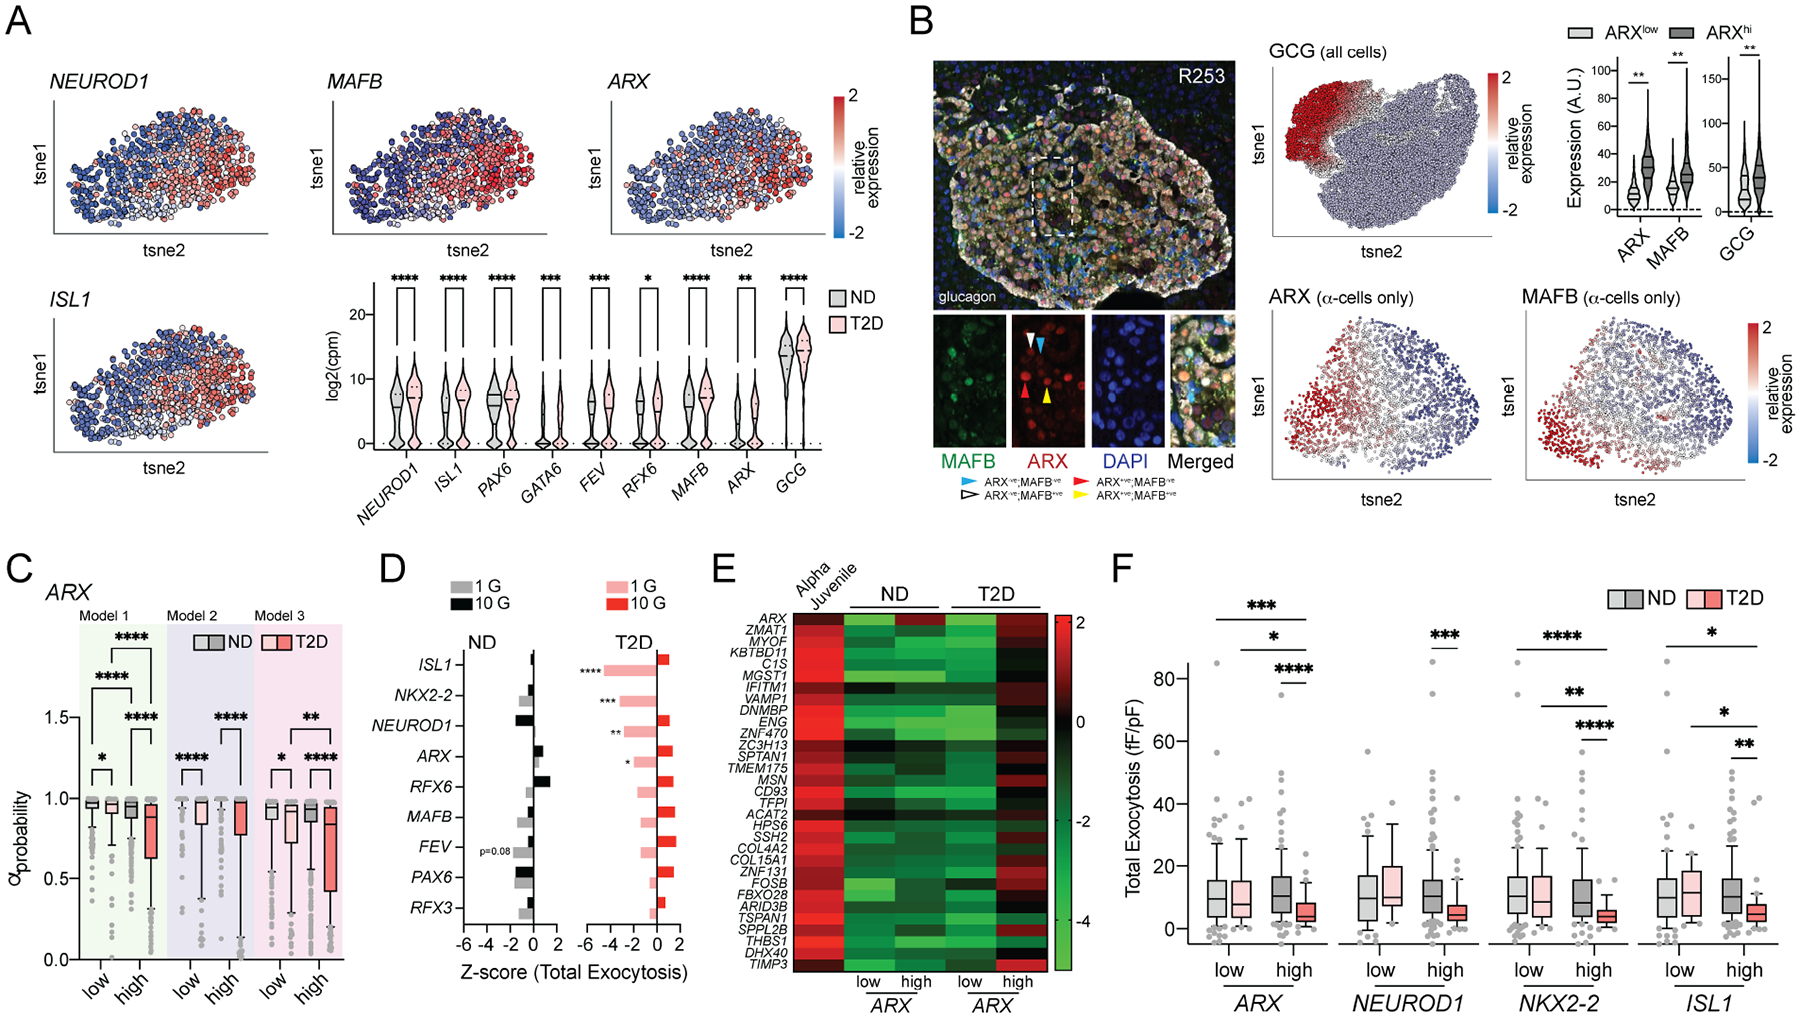
In diabetes, glucagon secretion from pancreatic α cells is dysregulated. The underlying mechanisms, and whether dysfunction occurs uniformly among cells, remain unclear. We examined α cells from human donors and mice using electrophysiological, transcriptomic, and computational approaches. Rising glucose suppresses α cell exocytosis by reducing P/Q-type Ca2+ channel activity, and this is disrupted in type 2 diabetes (T2D). Upon high-fat feeding of mice, α cells shift toward a "β cell-like" electrophysiological profile in concert with indications of impaired identity. In human α cells we identified links between cell membrane properties and cell surface signaling receptors, mitochondrial respiratory chain complex assembly, and cell maturation. Cell-type classification using machine learning of electrophysiology data demonstrated a heterogenous loss of "electrophysiologic identity" in α cells from donors with type 2 diabetes. Indeed, a subset of α cells with impaired exocytosis is defined by an enrichment in progenitor and lineage markers and upregulation of an immature transcriptomic phenotype, suggesting important links between α cell maturation state and dysfunction.

Keywords: alpha cells; diabetes; exocytosis; glucagon; human; islets of Langerhans; modeling; patch-seq.


Conflict of interest statement

Declaration of interests The authors declare no competing interests.

Figures

Figure 1.
Figure 1.. Glucose suppresses human α-cell exocytosis in concert with P/Q-channel activity
A) Schematic diagram illustrating that human islets were isolated, dispersed and cultured for 1–2 days prior to whole-cell patch-clamp and subsequent α-cell identification by glucagon immunostaining. B) Total exocytosis upon a series of ten membrane depolarizations with increasing glucose in ND α-cells (grey; n = 42, 28, 24, 20 cells from 9 donors) and T2D α-cells (pink; n = 29, 16, 12, 27 cells from 6 donors). C) Voltage-dependent Ca2+ channel activity, with Ba2+ as a charge carrier, in ND α-cells with increasing glucose (n = 31, 24, 27 cells from 7 donors). D) Effect of the P/Q-type Ca2+ channel activator GV-58 (10 μM) on Ca2+ current inactivation (left; n = 24, 28, 22, 21 cells) and charge entry (middle; n = 22, 20, 20, 23 cells) during a 500 ms depolarization from 70 to 0 mV, and total exocytosis (right; n = 23, 22, 28, 34 cells) at 1 and 10 mM glucose (3 donors). E) Effect of the P/Q-type Ca2+ channel blocker agatoxin (100 nM) and the L-type Ca2+ channel blocker isradipine (10 μM) on ND α-cells exocytosis at 1 mM glucose (n = 34, 30, 21 cells from 5 donors). F) Voltage-dependent Ca2+ channel activity at 0 mV (Ba2+ as a charge carrier) with increasing glucose in ND α-cells, with agatoxin (100 nM), and in T2D α-cells (n = 31, 16, 24, 15, 27, 18 cells from 7 ND donors, and 34, 31, 27 cells from 5 T2D donors). G) Effect of agatoxin (100 nM) and the L-type Ca2+ channel blocker isradipine (10 μM) on total exocytosis in T2D α-cells at 1 and 10 mM glucose (n = 30, 31, 29, 32, 31, 29 cells from 5 T2D donors). H) Putative scheme for glucose-regulation of depolarization-induced exocytosis in α-cells, and the dysfunction seen in T2D. *P < 0.05; **P < 0.01; and ***P < 0.001 by one-way ANOVA (D,E,G) or two-way ANOVA (B,C,F) and Tukey post test compared with 1 mM glucose control, versus the ND control (C) or as indicated.
Figure 2.
Figure 2.. Patch-seq suggests roles for the mitochondrial respiratory complex in α-cell function, and endocrine development and cell fate in α-cell dysfunction
A) Schematic diagram illustrating the isolation of 400 α-cells from 24 donors without diabetes (ND) and 7 donors with T2D assessed by patch-seq, some of which have been partly published previously (Camunas-Soler et al., 2020). B) The distribution of exocytosis - transcript correlations from α-cells of ND donors at 1 and 10 mM glucose (see also Suppl Table 2). C) Gene set enrichment analysis (GSEA) Gene ontology (GO): Biological Pathways using Z-scores as weighting across the transcriptome (using genes expressed in >20% of α-cells), separately at 1 and 10 mM glucose, reveals pathways linked to facilitation (positive values) or suppression (negative values) of exocytosis. FDR < 0.05 unless indicated otherwise, and absence of bars indicates no significant enrichment. D) Leading-edge transcripts for mitochondrial respiratory chain complex assembly that flip correlation with exocytosis from positive to negative in α-cells of ND donors as glucose increases from 1 to 10 mM. E) An endocrine system development pathway is enriched in ND α-cells with low exocytotic responses at 1 mM glucose. F) Leading-edge genes underlying the signal in panel E, which includes transcripts involved in islet cell lineage and α-cell identity. G) The distribution of exocytosis - transcript correlations α-cells from donors with T2D at 1 and 10 mM glucose (see also Suppl Table 3). H) GSEA GO: Biological Pathways with Z-scores as weighting (using genes expressed in >20% of α-cells) reveals development and cell fate pathways linked to increased exocytosis in T2D α-cells at 10 mM glucose (FDR < 0.05 unless indicated otherwise). I) Selected leading-edge transcripts that underlie the cell fate commitment (left) and pancreas development (right) pathways, including islet lineage and α-cell identity markers. False discovery rate (FDR) for pathways identified by GSEA were < 0.05 unless indicated otherwise.
Figure 3.
Figure 3.. Glucose-suppression of mouse α-cell exocytosis requires glucose metabolism and the mitochondrial respiratory chain
A-B) Glucagon (A) and insulin (B) secretion from islets of 10–12 week old male C57bl6 mice as glucose remains at 5 mM (blue) or drops from 5 to 1 mM (black), and upon subsequent stimulation with 20 mM KCl. A control (grey) was maintained at 5 mM glucose (n = 3, 3, 3 mice). C-D) Mouse α-cell exocytosis with increasing glucose (n = 32, 30, 14, 27 cells from 4 mice), and at very low (10% of normal) density (D; n = 6, 6, 13, 9 cells from 2 mice). E) Effect of 2-Deoxy-D-glucose (2-DG) on glucose-regulation of α-cell exocytosis (n = 20, 20, 21, 46 cells from 4 mice). F) Effect of the complex I inhibitor rotenone (0.5 μM) and the complex III inhibitor antimycin A (0.5 μM) on α-cell Ca2+ charge entry during a 500 ms depolarization from −70 to 0 mV, and exocytosis, at 1 and 10 mM glucose. Also the effect of direct intracellular dialysis of H2O2 (10 μM) via the patch pipette at 1 mM glucose (left n = 19, 15, 18, 17, 11, 19, 16 cells; and right n = 20, 19, 16, 26, 16, 26, 22 cells from 3 mice). **- P < 0.01; and ***- P < 0.001 by one-way ANOVA (C,D,E) or two-way ANOVA (A,B,F), followed by Tukey post-test to compare points or groups with the 5 mM glucose points (A, B) or with the 1 mM glucose control group.
Figure 4.
Figure 4.. ‘β-cell like’ properties of α-cells from HFD-fed mice
A-B) Glucagon (A) and insulin (B) secretion from islets of male C57/bl6N mice fed HFD for 10–12 weeks starting from 8 weeks of age (red) compared with age matched (18–20 week) chow fed controls (black). (n = 3, 3 mice). C) Effect of the P/Q-type Ca2+ channel blocker agatoxin (100 nM) and the L-type Ca2+ channel blocker isradipine (10 μM) on total exocytosis from chow diet (CD) and HFD α-cells at 1 mM glucose (n = 34, 42, 34, 40, 29, 39 cells from 8 HFD and 8 CD mice). D-E) Effect of the P/Q-channel activator GV-58 (10 μM) to delay Ca2+ current inactivation in both CD and HFD α-cells (D, n = 23, 36, 24, 23 cells from 3 CD and 3 HFD-fed mice) and on exocytosis (E) from CD (grey) and HFD (pink) α-cells at 1 and 5 mM glucose (n = 15, 16, 16, 21 cells from 3 CD mice; n = 14, 13, 15, 14 cells from 3 HFD-fed mice). F) Steady-state voltage-dependent Na+ current inactivation curves (left) and individual half-inactivation voltages (right) from α-cells of chow fed and HFD mice (n = 36, 44 cells from 9 CD and 9 HFD mice, measured at 1 mM glucose). Half-inactivation voltages from fit curves are indicated. G) From a separate set of CD and HFD α-cells assessed by patch-seq (Suppl Fig 4), mean expression (black) and % of cells expressing (blue) some α-cell identity transcription factors in CD and HFD α-cells. H) Mean expression (black) and % of cells expressing (blue) the β-cell Na+ channel isoform, Scn9a, in HFD α-cells. I) Correlation Z-scores of the negative shift in Na+ channel steady-state inactivation (at 1 mM glucose) in HFD α-cells with transcripts involved in α-cell lineage and identity. *- P < 0.05; **- P < 0.01; and ***- P < 0.001 by the Student’s t-test (F), or by one-way ANOVA (D,E) or two-way ANOVA (A,B,C) followed by Tukey post-test to compare points or groups with the 5 mM glucose points (A,B), with the 1 mM glucose control group, or as indicated.
Figure 5.
Figure 5.. Na+ current properties correlate with transcriptomic markers of α-cell function
A) Schematic diagram illustrating an expanded dataset of electrically profiled human islet cells, and tSNE representations of α- and β-cells identified by immunostaining or sequencing along with the relative distribution of Na+ current half-inactivation values. B-C) The distribution of Na+ current amplitudes (B) and voltage-dependence of half-inactivation values (C) of β-cells (light blue) and α-cells (pink) (see also Suppl Fig 4C). D) Selected significant positive (green) and negative (red) transcript correlates of peak Na+ current from α-cells of ND donors mapped to a proposed scheme of glucose-regulation of glucagon exocytosis (see also Suppl Table 6). E) Correlation of α-cell peak Na+ current and selected transmembrane signaling receptor transcripts (see also Suppl Fig 5). F) In α-cells of 6 donors with no diabetes (ND), Na+ currents measured with receptor agonists (colors matching receptors shown in panel E) upon depolarization from −70 to −10 mV. Peak current is shown at right: control (n = 53 cells); 0.5 μg/ml SLIT-2-N (n = 17 cells); 10 μM prostaglandin E2 (PGE2, n = 17 cells); 0.5 μM lysophosphatidic acid (LPA, n = 14 cells); 0.2 μg/ml α-latratoxin (n = 24 cells); 10 mM L-glutamic acid (n = 21 cells); 100 nM glucose-dependent insulinotropic polypeptide (GIP, n = 7 cells); 200 nM somatostatin (SST, n = 24 cells); 5 μM epinephrine (n = 22 cells). *- P < 0.05 and ***- P < 0.001 by one-way ANOVA, followed by the Benjamini and Hochburg post-test to method to compare groups controlling for false discovery rate.
Figure 6.
Figure 6.. Electrophysiological fingerprints define a loss of ‘functional identity’ in T2D α-cells
A) Classifier models trained on islet cell electrical properties of α- and β-cells from donors with no diabetes (ND) using Optimizable Ensemble or Extreme Gradient Boosting (XGBoost) approaches, identify cell types with high accuracy regardless of the inclusion or exclusion of cell size from training data. 80% of data was used for training. 20% of data was reserved for validation and generation of confusion matrices. tSNE plots show cell types determined by immunostaining or sequencing (left) and assigned αprobability scores (right). B) Ordinary least squares multiple regression of electrophysiological properties of α-cells from ND donors, Model scoring, and donor/isolation variables. C) Calculated αprobability (and βprobability) values from Model 3 applied to cells collected for patch-seq, without a priori knowledge of cell type and correlation with canonical β-cell (light blue) and α-cell (pink) markers. D) βprobability and αprobability values derived from all three models, of all β- and α-cells from ND or T2D donors. E) Volcano plot of transcript correlations with Model 3 αprobability values (slope/standard deviation) in α-cells from donors with T2D. A negative correlation indicates transcripts associated with reduced αprobability. F) Significantly enriched GO: Biological Pathways from Gene Set Enrichment Analysis (GSEA) performed using αprobability - transcript correlation slopes of α-cells from donors with T2D in all three Models as weighting. ***- P < 0.001 and **** P < 0.0001 as indicated within models using non-parametric Kruskal-Wallis test (D) followed by Dunn’s post-test to correct for multiple comparisons. Pink/red points in E indicate significance at P < 0.05. False discovery rate (FDR) for pathways identified by GSEA in F were <0.05 unless indicated otherwise.
Figure 7.
Figure 7.. A role for maturation state in α-cell dysfunction in T2D
A) Heterogenous expression of transcript makers for islet cell lineage and α-cell maturity in 980 patch-seq α-cells. B) ARX and MAFB protein expression in α-cells at the protein level in situ by immunostaining. Violin plots show the relative levels of GCG, ARX and MAFB expressed in ARXlow and ARXhi α-cells. C) αprobability values from the three separate classifier models in ND and T2D α-cells separated by high and low expression of ARX (see also Suppl Fig 6). D) Correlation of exocytosis in ND and T2D α-cells with α-cell lineage and identity markers. Bars to the left of the centerline indicate correlation with low exocytosis at the given glucose concentration. E) In a separate human islet single-cell dataset (Avrahami et al., 2020), expression of a juvenile α-cell gene-set in ND and T2D α-cells separated by low and high ARX expression. The heatmap displays relative expression levels as median log2 FPKM values. F) Total exocytosis in ND and T2D α-cells at 1 mM glucose separated by low and high expression of ISL1, NEUROD1, NKX2-2, and ARX. *- P < 0.05, **- P < 0.01, ***- P < 0.001 and **** P < 0.0001 two-way ANOVA followed by two-stage step-up method for estimation of FDR (C,D,F) or Tukey post-test (B).

Comment in

References

    1. Allister EM, Robson-Doucette CA, Prentice KJ, Hardy AB, Sultan S, Gaisano HY, Kong D, Gilon P, Herrera PL, Lowell BB, et al. (2013). UCP2 regulates the glucagon response to fasting and starvation. Diabetes 62, 1623–1633. - PMC - PubMed
    1. Anders S, Pyl PT, and Huber W (2015). HTSeq—a Python framework to work with high-throughput sequencing data. Bioinformatics 31, 166–169. - PMC - PubMed
    1. Arda HE, Li L, Tsai J, Torre EA, Rosli Y, Peiris H, Spitale RC, Dai C, Gu X, Qu K, et al. (2016). Age-dependent pancreatic gene regulation reveals mechanisms governing human β cell function. Cell Metabolism 23, 909–920. - PMC - PubMed
    1. Avrahami D, Wang YJ, Schug J, Feleke E, Gao L, Liu C, HPAP Consortium, Naji A, Glaser B, and Kaestner KH (2020). Single cell transcriptomics of human islet ontogeny defines the molecular basis of β cell dedifferentiation in T2D. Mol Metab 42, 101057. - PMC - PubMed
    1. Bahl V, May CL, Perez A, Glaser B, and Kaestner KH (2021). Genetic activation of α-cell glucokinase in mice causes enhanced glucose-suppression of glucagon secretion during normal and diabetic states. Mol Metab 49, 101193. - PMC - PubMed

Publication types