. 2022 Feb 1;34(2):269-284.e9.
doi: 10.1016/j.cmet.2021.12.023.

Hypothalamic pregnenolone mediates recognition memory in the context of metabolic disorders

Affiliations

Hypothalamic pregnenolone mediates recognition memory in the context of metabolic disorders

Sara Ramírez et al. Cell Metab. .

Abstract

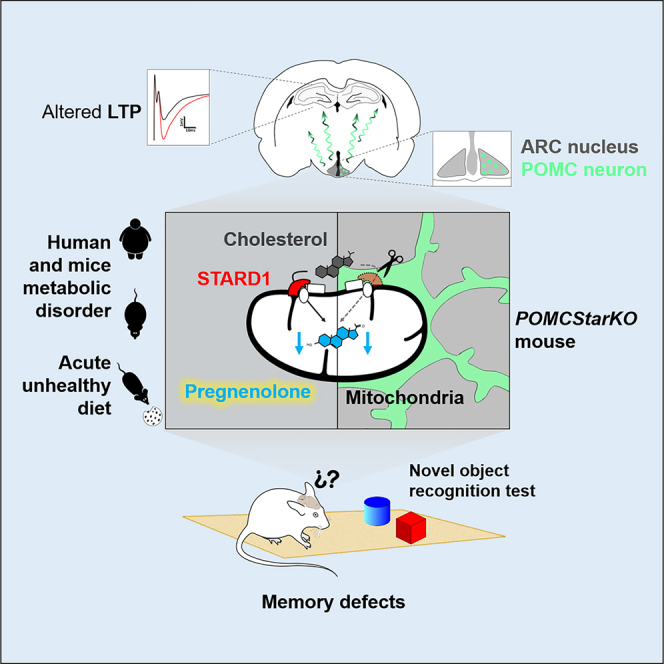
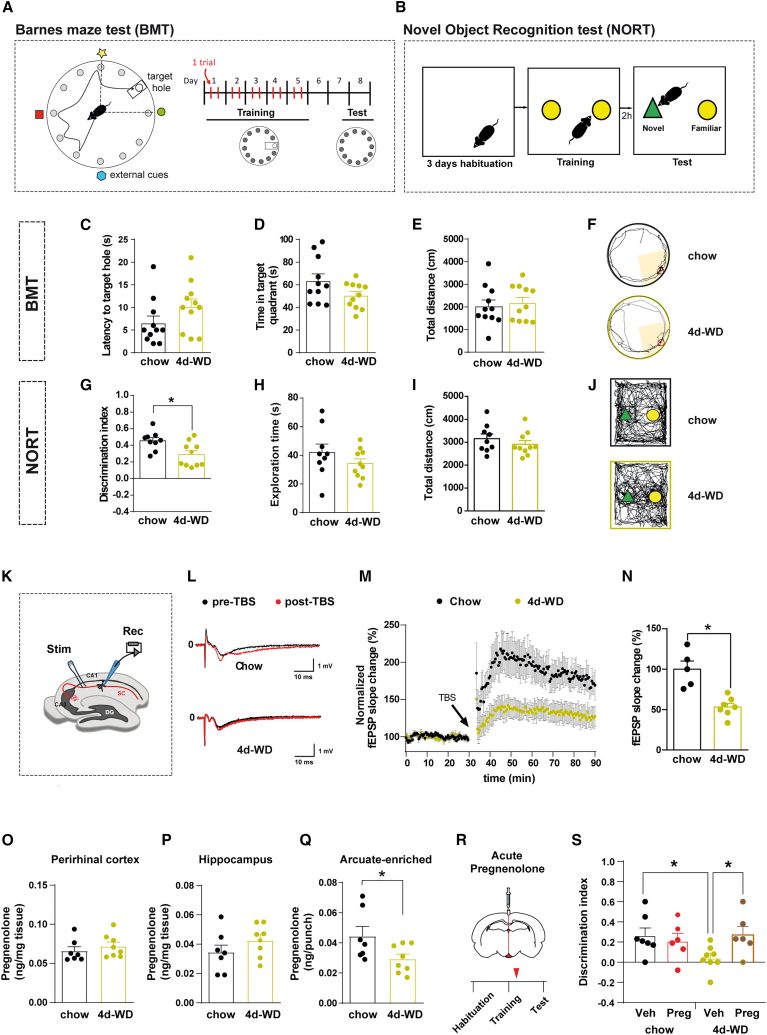
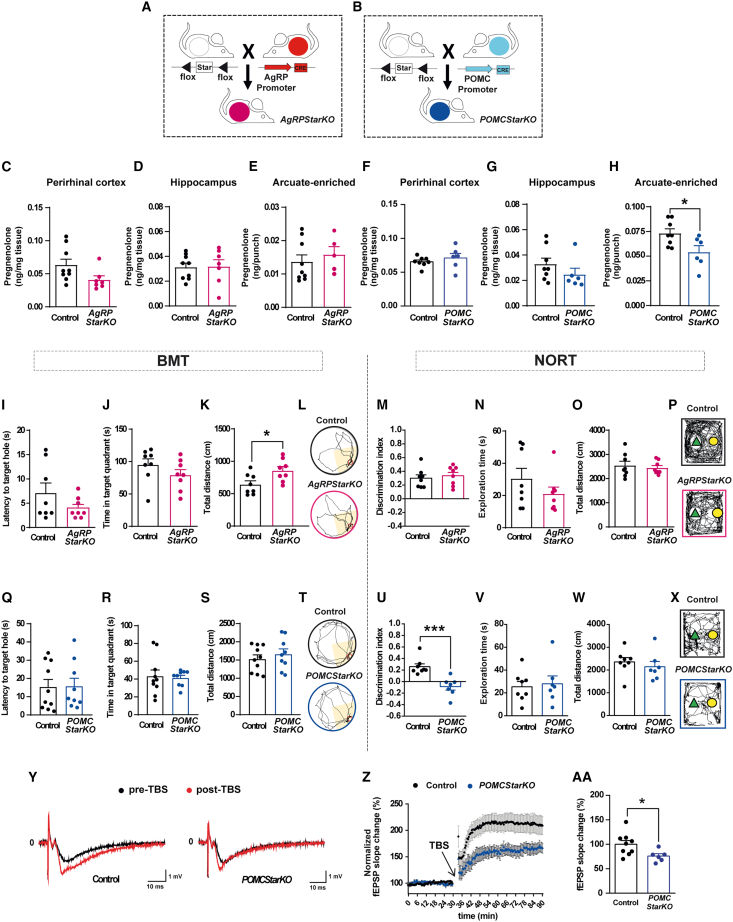
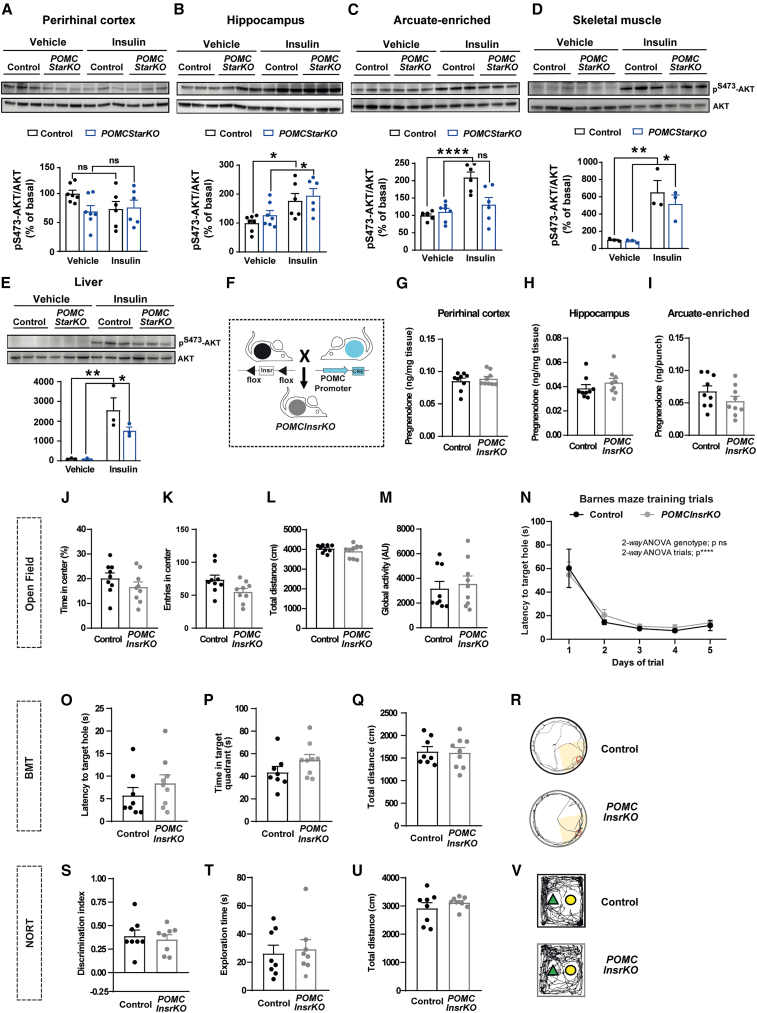
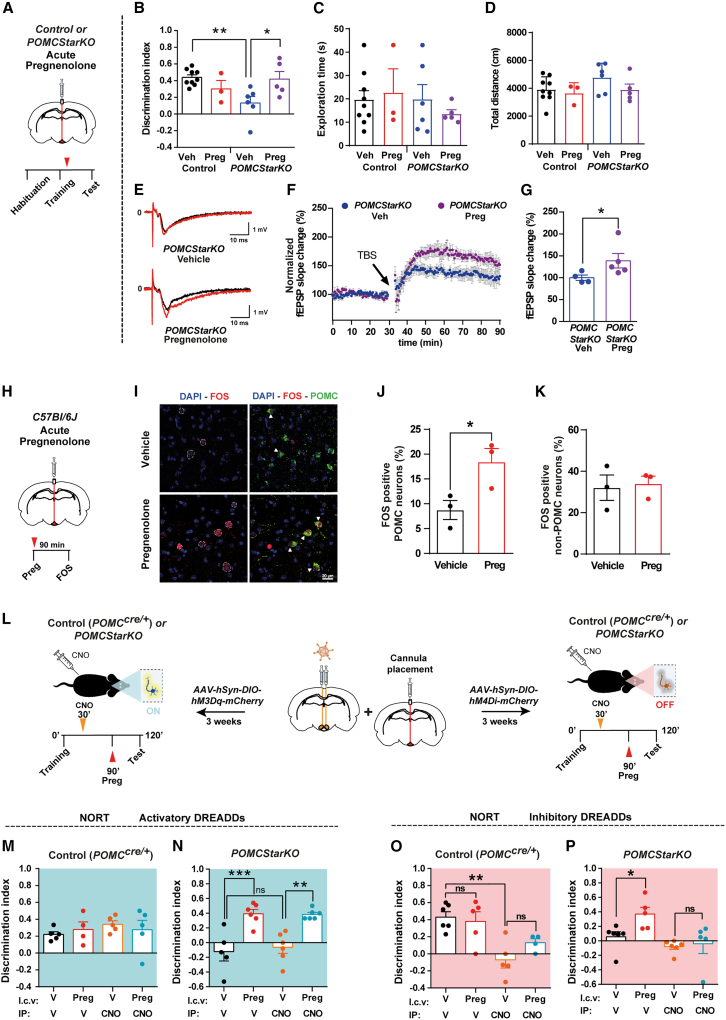
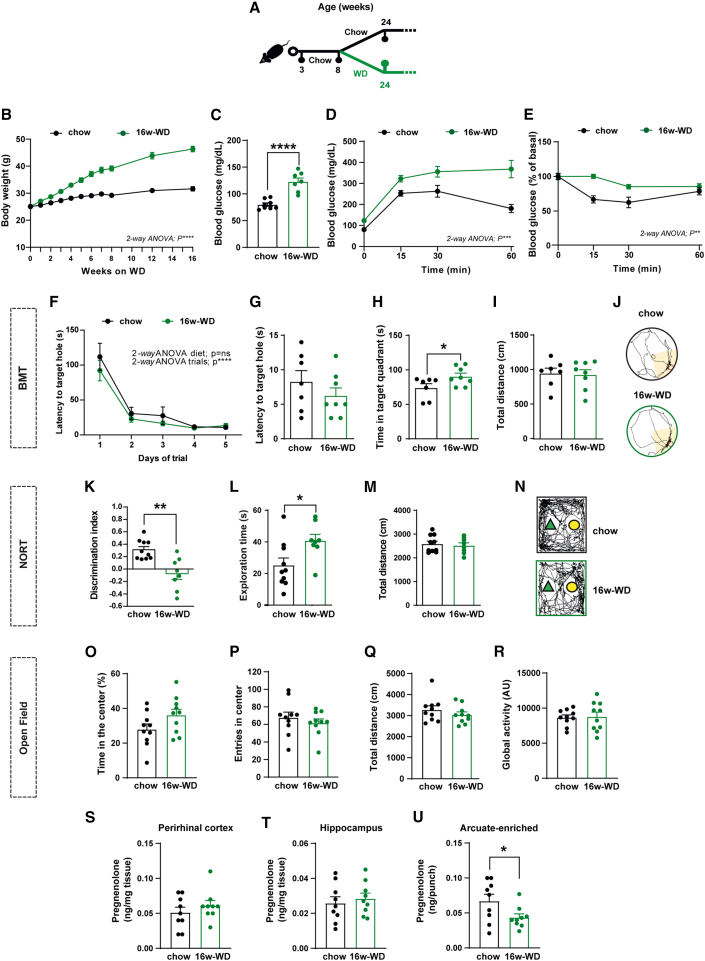
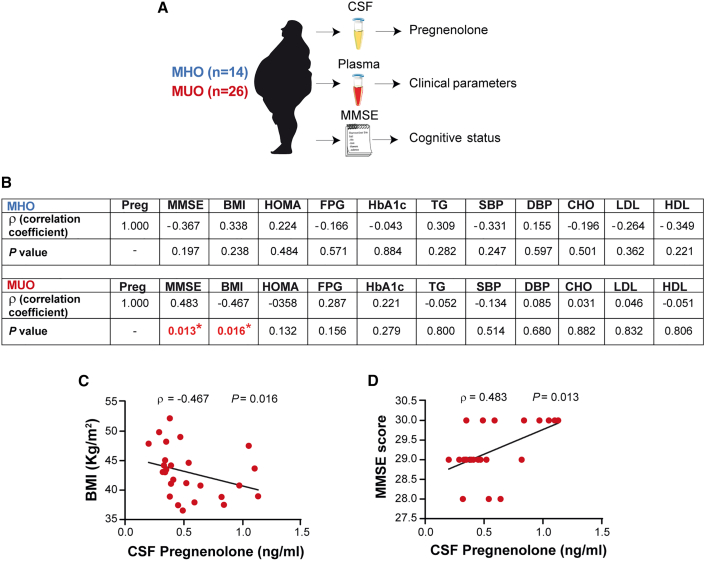
Obesity and type 2 diabetes are associated with cognitive dysfunction. Because the hypothalamus is implicated in energy balance control and memory disorders, we hypothesized that specific neurons in this brain region are at the interface of metabolism and cognition. Acute obesogenic diet administration in mice impaired recognition memory due to defective production of the neurosteroid precursor pregnenolone in the hypothalamus. Genetic interference with pregnenolone synthesis by Star deletion in hypothalamic POMC, but not AgRP neurons, deteriorated recognition memory independently of metabolic disturbances. Our data suggest that pregnenolone's effects on cognitive function were mediated via an autocrine mechanism on POMC neurons, influencing hippocampal long-term potentiation. The relevance of central pregnenolone on cognition was also confirmed in metabolically unhealthy patients with obesity. Our data reveal an unsuspected role for POMC neuron-derived neurosteroids in cognition. These results provide the basis for a framework to investigate new facets of POMC neuron biology with implications for cognitive disorders.

Keywords: POMC neurons; Stard1; cognitive function; diabetes; hypothalamus; mitochondria; neurosteroids; obesity; pregnenolone; recognition memory.


Conflict of interest statement

Declaration of interests The authors declare no competing interests.

Figures

None
Graphical abstract
Figure 1
Figure 1
Cognitive impairment caused by short-term obesogenic diet is reversed by central pregnenolone administration. (A) Schematic illustration of Barnes maze test (BMT) and experimental timeline. The white circle and the rectangle represent the scape hole and scape chamber location, respectively. The position of the scape chamber remained constant on each trial. On the test day, the scape hole was closed and the chamber removed. (B) Schematic illustration of the novel object recognition test (NORT) and experimental chronology. (C–F) Recorded parameters to assess BMT performance in mice fed with either chow or western diet for 4 days (4d-WD) during the test phase: (C) latency to target hole, (D) time spent in target quadrant, (E) total distance traveled, and (F) representative traces of mouse movement trajectories (n = 11/diet). (G–J) Recorded parameters to assess NORT performance in mice fed with either chow or 4d-WD during the test phase: (G) discrimination index (time exploring novel object − time exploring familiar object)/(time exploring novel object + time exploring familiar object), (H) exploration time (time exploring novel object + time exploring familiar object), (I) total distance traveled, and (J) representative traces of mouse movement trajectories (n = 9–10/diet). (K–N) Hippocampal long-term potentiation (LTP) study in mice fed with chow or 4d-WD. (K) Schematic illustration of the experimental strategy. The Schaffer collateral pathway (SC, red) was stimulated (Stim), and field potentials were recorded (Rec) in the CA1 region of the hippocampus. LTP was induced by theta-burst stimulation (TBS). DG, dentate gyrus; CA, cornu ammonis. (L) Representative traces of individual recordings showing baseline fEPSPs before (black traces) and after (red traces) LTP induction. (M) Time course of fEPSP recordings demonstrating robust changes in fEPSP slope in chow-fed animals after TBS (arrow) (n = 5 recordings from 4 animals). In 4d-WD animals, LTP induction was markedly impaired (n = 7 recordings from 4 animals). (N) Quantification of fEPSP slope change over the last 45 min of recording period shown in (M). (O–Q) Quantification of pregnenolone concentration in the (O) perirhinal cortex, (P) hippocampus, and (Q) arcuate-enriched mediobasal hypothalamus in mice fed with either chow or 4d-WD (n = 7–8/diet). (R) Schematic illustration of central acute delivery of pregnenolone and subsequent NORT. Red arrow shows injection phase. (S) Discrimination index during the test phase of NORT in mice fed with either chow or 4d-WD treated with vehicle (Veh) or pregnenolone (Preg) (n = 6–8/group). All studies were performed on male mice at 8–9 weeks of age. Dots in panels represent individual samples. Data are presented as mean ± SEM. p < 0.05.
Figure 2
Figure 2
Genetic deletion of Star exclusively in POMC neurons impairs recognition memory (A and B) Schematic illustration of the generation of transgenic mice: (A) AgRPStarKO and (B) POMCStarKO mice. (C–E) Pregnenolone concentration in the (C) perirhinal cortex, (D) hippocampus, and (E) arcuate-enriched mediobasal hypothalamus from control and AgRPStarKO mice (n = 5–9/genotype). (F–H) Pregnenolone concentration in (F) perirhinal cortex, (G) hippocampus, and (H) arcuate-enriched mediobasal hypothalamus from control and POMCStarKO mice (n = 8–6/genotype). (I–L) Recorded parameters to assess Barnes maze performance in AgRPStarKO mice during the test phase: (I) latency to target hole, (J) time spent in target quadrant, (K) total distance traveled, and (L) representative traces of mouse movement trajectories (n = 8/genotype). (M–P) Recorded parameters to assess NORT performance in AgRPStarKO mice during the test phase: (M) discrimination index (time exploring novel object − time exploring familiar object)/(time exploring novel object + time exploring familiar object), (N) exploration time (time exploring novel object + time exploring familiar object), (O) total distance traveled, and (P) representative traces of mouse movement trajectories (n = 8/genotype). (Q–T) Recorded parameters to assess Barnes maze performance in POMCStarKO mice during the test phase: (Q) latency to target hole, (R) time spent in target quadrant, (S) total distance traveled, and (T) representative traces of mouse movement trajectories (n = 9–10/genotype). (U–X) Recorded parameters to assess NORT performance in POMCStarKO mice during the test phase: (U) discrimination index (time exploring novel object − time exploring familiar object)/(time exploring novel object + time exploring familiar object), (V) exploration time (time exploring novel object + time exploring familiar object), (W) total distance traveled, and (X) representative traces of mouse movement trajectories (n = 7–8/genotype). (Y–AA) Hippocampal long-term potentiation (LTP) study comparing control and POMCStarKO mice. (Y) Representative traces of individual recordings showing baseline fEPSPs before (black traces) and after (red traces) LTP induction. Slope and peak amplitude of fEPSPs increased after theta-burst stimulation (TBS) in control mice but was attenuated in POMCStarKO animals. (Z) Time course of fEPSP recordings demonstrating that LTP induction was markedly impaired in POMCStarKO animals (n = 6 recordings from 5 animals) when compared with controls (n = 9 recordings from 6 animals). (AA) Quantification of the fEPSP slope change over the last 45 min of recording period shown in (Z). All studies were performed in male mice between 10 and 16 weeks of age. Dots in panels represent individual samples. Data are presented as mean ± SEM. p < 0.05; ∗∗∗p < 0.001.
Figure 3
Figure 3
Insulin signaling in POMC neurons does not mediate memory performance (A–E) Assessment of insulin signaling via AKT phosphorylation (pS473-AKT) in the (A) perirhinal cortex, (B) hippocampus, (C) arcuate-enriched mediobasal hypothalamus, (D) skeletal muscle, and (E) liver from control and POMCStarKO mice. Representative blots and quantification (normalized to total AKT) are shown (n = 3–7/genotype). (F) Schematic illustration of the generation of POMCInsrKO mice. (G–I) Pregnenolone content in the (G) perirhinal cortex, (H) hippocampus, and (I) arcuate nucleus-enriched mediobasal hypothalamus from control and POMCInsrKO mice (n = 9/genotype). (J–M) Locomotor and exploratory activity of control and POMCInsrKO mice in an open-field paradigm: (J) time spent in the center, (K) entries in the center, (L) total distance traveled, and (M) global activity (n = 9/genotype). (N) Task learning curve for the latency to reach the scape hole during the training phase of the Barnes maze test (BMT). Results show the average of 2 trials per day during 5 consecutive days (n = 8–9/genotype). (O–R) Recorded parameters to assess Barnes maze performance in control and POMCInsrKO mice during the test phase: (O) latency to target hole, (P) time spent in target quadrant, (Q) total distance traveled, and (R) representative traces of mouse movement trajectories (n = 8–9/genotype). (S–V) Recorded parameters to assess NORT performance in control and POMCInsrKO mice during the test phase: (S) discrimination index (time exploring novel object − time exploring familiar object)/(time exploring novel object + time exploring familiar object), (T) exploration time (time exploring novel object + time exploring familiar object), (U) total distance traveled, and (V) representative traces of mouse movement trajectories (n = 8/genotype). All studies were performed in male mice between 10 and 16 weeks of age. Dots in panels represent individual samples. Data are presented as mean ± SEM. p < 0.05; ∗∗p < 0.01; ∗∗∗∗p < 0.0001; ns, not significant.
Figure 4
Figure 4
Central pregnenolone administration recovers cognitive function in POMCStarKO mice (A) Schematic illustration of central acute delivery of pregnenolone and subsequent NORT in POMCStarKO mice. Red arrow shows the injection phase. (B–D) Recorded parameters to assess NORT performance in POMCStarKO mice, after central administration of vehicle (Veh) or pregnenolone (Preg), during the test phase: (B) discrimination index (time exploring novel object − time exploring familiar object)/(time exploring novel object + time exploring familiar object), (C) exploration time (time exploring novel object + time exploring familiar object), and (D) total distance traveled (n = 3–9/genotype). (E–G) Hippocampal long-term potentiation (LTP) study after central administration of either vehicle (Veh) or pregnenolone (Preg) in POMCStarKO mice. (E) Representative traces of individual recordings showing baseline fEPSPs before (black traces) and after (red traces) LTP induction. Slope and peak amplitude of fEPSPs improved after pregnenolone treatment. (F) Time course of the fEPSP slope change in vehicle-treated (n = 4 recordings from 4 animals) and pregnenolone-treated POMCStarKO mice (n = 5 recordings from 3 animals) after theta-burst stimulation (TBS; arrow). (G) Quantification of the fEPSP slope change over the last 45 min of recording period shown in (F). (H) Schematic illustration of central acute delivery of pregnenolone and subsequent analysis of FOS expression in control C57Bl/6J mice. Red arrow shows the injection phase. (I) Representative confocal images of FOS and POMC colocalization after central administration of vehicle or pregnenolone in control C57Bl/6J mice. White arrows show colocalization staining. Scale bar, 20 μm. (J) Quantification of FOS-positive POMC neurons in arcuate nucleus sections from control C57Bl/6J mice after central administration of vehicle or pregnenolone (n = 3/genotype). (K) Quantification of FOS positivity in non-POMC cells in arcuate nucleus sections from control C57Bl/6J mice after central administration of vehicle or pregnenolone (n = 3/genotype). (L) Schematic illustration of the activatory and inhibitory chemogenetic strategy, coupled with central pregnenolone administration, in POMCcre/+ and POMCStarKO mice. Orange and red arrows show CNO and pregnenolone (Preg) injection, respectively. (M and N) Recorded parameters to assess NORT performance in mice after chemogenetic activation of POMC neurons, combined with central administration of vehicle (V) or pregnenolone (Preg), during the test phase: (M) discrimination index of control POMCcre/+ mice (n = 4–5/genotype) and (N) POMCStarKO mice (n = 4–6/genotype). (O and P) Recorded parameters to assess NORT performance in mice after chemogenetic repression of POMC neuron activity, combined with central administration of vehicle (V) or pregnenolone (Preg), during the test phase: (O) discrimination index of control POMCcre/+ mice (n = 4–6/genotype) and (P) POMCStarKO mice (n = 5–6/genotype). All studies were performed in male mice between 10 and 16 weeks of age. Dots in panels represent individual samples. Data are presented as mean ± SEM. p < 0.05; ∗∗p < 0.01; ∗∗∗p < 0.001; ns, not significant.
Figure 5
Figure 5
Obesity-related metabolic complications associate with impaired cognitive function and reduced hypothalamic neurosteroid concentration in mice (A) Schematic illustration of the experimental strategy. Eight-week-old C57Bl/6J mice were fed with either chow or western diet for 16 consecutive weeks (16w-WD). (B) Body weight profile (n = 10/genotype). (C) Basal blood glucose concentration and (D) glucose tolerance test (n = 7/genotype). (E) Insulin sensitivity test (n=10/genotype). (F) Task learning curve for the latency to reach the scape hole during the training phase of the Barnes maze test (BMT) in mice fed with either chow or 16w-WD. Results show the average of 2 trials per day during 5 consecutive days (n = 7–8/diet). (G–J) Parameters recorded to assess Barnes maze performance in mice, fed with either chow or 16w-WD, during the test phase: (G) latency to target hole, (H) time spent in target quadrant, (I) total distance traveled, and (J) representative traces of mouse movement trajectories (n = 7–8/genotype). (K–N) Parameters recorded to assess NORT performance in mice, fed with either chow or 16w-WD, during the test phase: (K) discrimination index (time exploring novel object − time exploring familiar object)/(time exploring novel object + time exploring familiar object), (L) exploration time (time exploring novel object + time exploring familiar object), (M) total distance traveled, and (N) representative traces of mouse movement trajectories (n = 8–10/genotype). (O–R) Recorded parameters to assess open-field performance in mice fed with either chow or 16w-WD: (O) time spent in the center, (P) number of entries in the center, (Q) total distance traveled, and (R) global activity (n = 10/genotype). (S–U) Quantification of pregnenolone concentration in the (S) perirhinal cortex, (T) hippocampus, and (U) arcuate-enriched mediobasal hypothalamus in mice fed with either chow or 16w-WD (n = 9/genotype). All studies were performed on male mice at 24–26 weeks of age. Dots in panels represent individual samples. Data are presented as mean ± SEM. p < 0.01; ∗∗p < 0.01; ∗∗∗p < 0.001; ∗∗∗∗p < 0.0001; ns, not significant.
Figure 6
Figure 6
Pregnenolone concentration in the cerebrospinal fluid of metabolically unhealthy patients with obesity positively correlates with cognitive score (A) Schematic illustration of sample processing from the cohort of patients. (B) Analysis of Spearman’s rank correlation between cerebrospinal fluid (CSF) pregnenolone concentrations and diverse anthropometric, clinical, and cognitive parameters in a cohort of metabolically healthy (MHO) and unhealthy obese (MUO) patients. Preg, pregnenolone; MMSE, mini-mental state examination; BMI, body mass index; HOMA, homeostatic model assessment-insulin resistance; FPG, fasting plasma glucose; HbA1c, glycated hemoglobin; TG, triglyceride; SBP, systolic blood pressure; DBP, diastolic blood pressure; CHO, cholesterol; LDL, low-density lipoprotein; HDL, high-density lipoprotein. (C and D) Correlation between CSF pregnenolone concentrations and BMI (C) or MMSE (D) in MUO patients. Dots in panels represent individual samples.

Comment in

References

    1. Aguilar-Salinas C.A., García E.G., Robles L., Riaño D., Ruiz-Gomez D.G., García-Ulloa A.C., Melgarejo M.A., Zamora M., Guillen-Pineda L.E., Mehta R., et al. High adiponectin concentrations are associated with the metabolically healthy obese phenotype. J. Clin. Endocrinol. Metab. 2008;93:4075–4079. - PubMed
    1. Arenas F., Garcia-Ruiz C., Fernandez-Checa J.C. Intracellular cholesterol trafficking and impact in neurodegeneration. Front. Mol. Neurosci. 2017;10:382. - PMC - PubMed
    1. Antunes M., Biala G. The novel object recognition memory: neurobiology, test procedure, and its modifications. Cogn. Process. 2012;13:93–110. - PMC - PubMed
    1. Arenas F., Castro F., Nuñez S., Gay G., Garcia-Ruiz C., Fernandez-Checa J.C. STARD1 and NPC1 expression as pathological markers associated with astrogliosis in post-mortem brains from patients with Alzheimer’s disease and Down syndrome. Aging (Albany, NY) 2020;12:571–592. - PMC - PubMed
    1. Bach M.E., Hawkins R.D., Osman M., Kandel E.R., Mayford M. Impairment of spatial but not contextual memory in CaMKII mutant mice with a selective loss of hippocampal LTP in the range of the theta frequency. Cell. 1995;81:905–915. - PubMed

Publication types