. 2022 Feb 1;38(5):110307.
doi: 10.1016/j.celrep.2022.110307.

Fat3 acts through independent cytoskeletal effectors to coordinate asymmetric cell behaviors during polarized circuit assembly

Affiliations

Fat3 acts through independent cytoskeletal effectors to coordinate asymmetric cell behaviors during polarized circuit assembly

Evelyn C Avilés et al. Cell Rep. .

Abstract

The polarized flow of information through neural circuits depends on the orderly arrangement of neurons, their processes, and their synapses. This polarity emerges sequentially in development, starting with the directed migration of neuronal precursors, which subsequently elaborate neurites that form synapses in specific locations. In other organs, Fat cadherins sense the position and then polarize individual cells by inducing localized changes in the cytoskeleton that are coordinated across the tissue. Here, we show that the Fat-related protein Fat3 plays an analogous role during the assembly of polarized circuits in the murine retina. We find that the Fat3 intracellular domain (ICD) binds to cytoskeletal regulators and synaptic proteins, with discrete motifs required for amacrine cell migration and neurite retraction. Moreover, upon ICD deletion, extra neurites form but do not make ectopic synapses, suggesting that Fat3 independently regulates synapse localization. Thus, Fat3 serves as a molecular node to coordinate asymmetric cell behaviors across development.

Keywords: fat cadherins; neurite retraction; neuronal migration; retinal development; synapse localization.


Conflict of interest statement

Declaration of interests The authors declare no competing interests.

Figures

Figure 1.
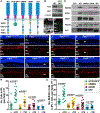
Figure 1.. The Fat3-ICD interacts with multiple cytoskeletal effectors
(A) Summary of Fat3’s effects on mouse retinal development. Wild-type (WT) ACs (green) migrate smoothly through the neuroblast layer (NBL) toward the inner nuclear layer (INL). In Fat3Δ™/Δ™ mutants, (1) neuronal migration is affected with more ACs that halt in the inner plexiform layer (IPL) or that migrate into the ganglion cell layer (GCL), (2) neurite retraction is unreliable, and (3) ectopic synapses form in the INL and below the GCL. ONL, outer nuclear layer; OPL, outer plexiform layer. (B) Known and predicted binding sites in the Fat3-ICD, with newly defined sites marked with dotted lines. Solid lines represent fragments tiling the ICD that were used for GST pull-downs. (C) Western blots after GST pull-down from brain lysate using GST fusions to the fragments in (B) (NS, NL, C, ICD, 1–7) or GST-only controls. All binding partners were present in brain lysate before pull down (input), with reduced levels detected in the ICD supernatant (ICD Sup) after pull down, consistent with efficient depletion. See also Figure S1 and Tables S1 and S2.
Figure 2.
Figure 2.. Differential expression of two Fat3-ICD isoforms in the developing retina
(A) Diagram of the Fat3 gene structure illustrating alternative splicing events. (B) Three different isoforms of Fat3 can be produced in the P0 retina. (C) Diagram of Fat3 mRNA illustrating where Basescope in situ probes bind splice junctions to distinguish alternative splice isoforms. (D–K′) Basescope in situ hybridization on retinal sections at E14.5, P0, P6, and P11 using isoformspecific probes to track Fat3-ICD isoform expression during retinal development. Scale bar: 20 μm. See also Figure S2 and Tables S3 and S4.
Figure 3.
Figure 3.. A subset of motifs in the Fat3-ICD are required for AC migration
(A) Schematic representations of Fat3-ICD mutants used in this study (not to scale). (B) Western blot using antibodies to the Fat3-ICD and GFP confirms that Fat3ΔICD−GFP mice produce a Fat3-GFP fusion protein that lacks the ICD. β-actin was used as a loading control. (C and D) Anti-Fat3 staining of Fat3ΔICD−GFP/+ (C) and Fat3ΔICD−GFP/ΔICD−GFP (D) retinas. The antibody recognizes the Fat3-ICD. (E) GST pull-down from brain lysates shows selective loss of predicted binding partners for each mutant protein, with retention of PSD95 binding in all cases. (F–K′) DAPI and anti-Bhlhb5 staining of P11 retinal sections reveal AC migration defects in Fat3ΔICD−GFP/ΔICD−GFP (N = 3, n = 17), Fat3ΔWIRS/Δ™ (N = 4, n = 19), and Fat3ΔDDN/Δ™ mutants (N = 4, n = 21) compared with in Fat3ΔICD−GFP/+ (N = 3, n = 14), Fat3ΔWIRS/+ (N = 4, n = 18), and Fat3ΔDDN/+ (N = 4, n = 13) controls, respectively. Arrows point to mislocalized AC somas in the IPL. (L–M′) By contrast, migration is unaffected in Fat3ΔEV/Δ™ mice (N = 3, n = 17) compared with in Fat3ΔEV/+ controls (N = 3, n = 14). (N and O) Quantification of DAPI-stained nuclei in the IPL (N) and Bhlhb5+ nuclei in the IPL and GCL (O). t test was used for all comparisons except Fat3ΔICD−GFP/+ versus Fat3ΔICD−GFP/ΔICD−GFP in (N) and (O) and Fat3ΔEV/+ vs Fat3ΔEV/Δ™ in (N), which were by Mann–Whitney test. Scale bars: 20 μm. Each field is 291.2 μm long. Data are represented as mean ± SEM. See also Figure S3.
Figure 4.
Figure 4.. The WIRS, Kif5-ID, and Evh1 motifs are required for proper synapse localization
(A–H) Anti-VGAT staining of Fat3Δ™/+ (A), Fat3Δ™/Δ™ (B), Fat3ΔWIRS/+ (C), Fat3ΔWIRS/Δ™ (D), Fat3ΔDDN/+ (E), Fat3ΔDDN/Δ™ (F), Fat3ΔEV/+ (G), and Fat3ΔEV/Δ™ (H) mutant retinal sections at P6. Arrows point to the OMPL. (I) Quantification of ectopic synapse scores in Fat3Δ™/+ (N = 7, n = 34) versus Fat3Δ™/Δ™ (N = 7, n = 28), Fat3ΔWIRS/+ (N = 4, n = 16), Fat3ΔWIRS/Δ™ (N = 4, n = 16), Fat3ΔDDN/+ (N = 4, n = 23), Fat3ΔDDN/Δ™ (N = 6, n = 30), Fat3ΔEV/+ (N = 5, n = 18), and Fat3ΔEV/Δ™ (N = 4, n = 21) mutants. Mann–Whitney test was used. Scale bar: 20 μm. Data are represented as mean ± SEM. See also Figures S4 and S5.
Figure 5.
Figure 5.. Independent effects of Fat3 on neurite retraction and synapse formation
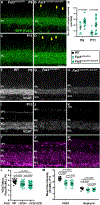
(A–E) Anti-GFP staining of retinal sections at P6 (A and B) and P11 (C and D) reveals Fat3-GFP in the IPL of Fat3ΔICD−GFP heterozygotes (A and C) and homozygotes (B and D), where Fat3 is known to localize (Deans et al., 2011). In addition, Fat3ΔICD−GFP localizes to the tips of unretracted AC neurites in the INL (arrows, B and D) of Fat3ΔICD−GFP/ΔICD−GFP mutants, quantified in (E). Fat3ΔICD−GFP/+ (P6: N = 4, n = 12; P11: N = 3, n = 18) and Fat3ΔICD−GFP/ΔICD−GFP (P6: N = 4, n = 13; P11: N = 3, n = 19) retinas. t test was applied to P6 data, and Mann-Whitney test was applied to P11 data. (F–K) Anti-VGAT (F–K) and anti-Gephyrin (I′–K′) staining of WT (F and I), Fat3ΔICD−GFP/+ (G and J), and Fat3ΔICD−GFP/ΔICD−GFP (H and K) retinas at P6 (F–H) and P11 (I–K) shows that no ectopic synapses form in Fat3ΔICD−GFP/ΔICD−GFP mutants despite the presence of many GFP+ ectopic neurites (E). However, VGAT intensity in the IPL is significantly reduced in P6 and P11 heterozygotes (G and J) and homozygotes (H and K). At P11, Gephyrin intensity (I′, J′, and K′) is also decreased. (L) Quantification of mean VGAT fluorescence intensity in IPL normalized to upper INL at P6 for WT (N = 4, n = 21), Fat3ΔICD−GFP/+ (N = 8, n = 38), and Fat3ΔICD−GFP/ΔICD−GFP (N = 9, n = 44) retinas. Mann–Whitney test was used. (M) Quantification of VGAT and Gephyrin intensity in the IPL of WT (N = 3, n = 15), Fat3ΔICD−GFP/+ (N = 3, n = 15), and Fat3ΔICD−GFP/ΔICD−GFP (N = 3, n = 17) at P11. t test was used for VGAT intensity, and Mann Whitney test was used for Gephyrin intensity. Scale bars: 20 μm. Each field is 291.2 μm long. Data are represented as mean ± SEM. See also Figure S6.
Figure 6.
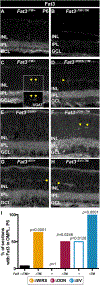
Figure 6.. Mutant Fat3 proteins mislocalize to the INL
(A–C) Anti-Fat3 staining of P6 Fat3Δ™/+ (A and C) retinal sections shows that WT Fat3 is localized to the IPL, even in regions where ectopic VGAT+ neurites form a patch of OMPL (arrows, bottom inset, C). No signal is detected in Fat3Δ™/Δ™ homozygotes (B), confirming that the signal corresponds to Fat3. (D–H) Anti-Fat3 staining of P6 Fat3ΔWIRS/Δ™ (D), Fat3ΔDDN/+ (E), Fat3ΔDDN/Δ™(F), Fat3ΔEV/+ (G), and Fat3ΔEV/Δ™ (H) retinal sections, with arrows indicating mislocalization to the OMPL (D and F–H). (I) Quantification of Fat3 mislocalization. The bars represent the percentage of retinal sections with evidence of Fat3 in the OMPL. Fisher’s exact test was used. Scale bar: 20 μm.
Figure 7.
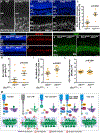
Figure 7.. Fat3 localizes WRC components that are essential for AC migration
(A and B) Anti-Abi1/2 immunostaining of E16.5 WT (A) and Fat3Δ™/Δ™ (B) retinas shows a change in Abi1/2 localization in the absence of Fat3. (C–E) In P0 Fat3Δ™/+ retinas (C′), Abi1/2 is enriched in the nascent IPL. By contrast, significantly more Abi1/2+ processes point away from the IPL in Fat3Δ™/Δ™ retinas (D′) (7.50 ± 0.86 processes per field, N = 3, n = 8) than in Fat3Δ™/+ controls (2.33 ± 0.66 processes per field, N = 3, n = 9, p = 0.0002, t test), quantified in (E). (F–G′) Anti-Bhlhb5 and DAPI staining of retinal sections from P11 control (F) and Abi1 cKO homozygotes (G) reveals AC migration defects. (H) Quantification of nuclei in the IPL for Six3CRE/+; Abi1fl/+ (N = 3,n = 12) and Six3CRE/+;Abi1fl/fl (N= 3, n = 12). Mann–Whitney test was used. (I) Quantification of Bhlhb5+ cells in the IPL and GCL. t test was used. (J and K) Deletion of Abi1 from the retina does not induce ectopic synapses, as seen by anti-VGAT staining of P6 control (Six3CRE/+;Abi1fl/+) and mutant (Six3CRE/+;Abi1fl/fl) retinal sections. (L) Quantification of mean VGAT fluorescence intensity in IPL normalized to upper INL for Six3CRE/+; Abi1fl/+ (N = 3,n = 14) and Six3CRE/+;Abi1fl/fl (N= 4, n = 18) retinas. Mann–Whitney test was used. Scale bars: 20 μm. Each field is 291.2 μm long. (M) Diagrams summarizing the key findings of this study. Data are represented as mean ± SEM. See also Figure S7.

References

    1. Avilés EC, and Goodrich LV (2017). Configuring a robust nervous system with Fat cadherins. Semin. Cell Dev. Biol 69, 91–101. - PMC - PubMed
    1. Avilés EC, Krol A, Henle SJ, Burroughs-Garcia J, Deans MR, and Goodrich LV (2022a). Mass Spectrometry data for: Fat3 acts through independent cytoskeletal effectors to coordinate asymmetric cell behaviors during polarized circuit assembly. Harvard Dataverse, V1. 10.7910/DVN/TXMJYK. - DOI - PMC - PubMed
    1. Avilés EC, Krol A, Henle SJ, Burroughs-Garcia J, Deans MR, and Goodrich LV (2022b). “Source data for: Fat3 acts through independent cytoskeletal effectors to coordinate asymmetric cell behaviors during polarized circuit assembly”. Harvard Dataverse, V1. 10.7910/DVN/AYEGN7. - DOI - PMC - PubMed
    1. Badouel C, Zander M, Liscio N, Bagherie-Lachidan M, Sopko R, Coyaud E, Raught B, Miller F, and McNeill H (2015). Fat1 interacts with Fat4 to regulate neural tube closure, neural progenitor proliferation and apical constriction during mouse brain development. Development 142, 2781–2791. - PMC - PubMed
    1. Barlan K, Cetera M, and Horne-Badovinac S (2017). Fat2 and lar define a basally localized planar signaling system controlling collective cell migration. Dev. Cell 40, 467–477. - PMC - PubMed

Publication types