

Association of CSF, Plasma, and Imaging Markers of Neurodegeneration With Clinical Progression in People With Subjective Cognitive Decline
- PMID: 35110378
- PMCID: PMC8967429
- DOI: 10.1212/WNL.0000000000200035
Association of CSF, Plasma, and Imaging Markers of Neurodegeneration With Clinical Progression in People With Subjective Cognitive Decline
Erratum in
-
Association of CSF, Plasma, and Imaging Markers of Neurodegeneration With Clinical Progression in People With Subjective Cognitive Decline.Neurology. 2022 Jul 12;99(2):86. doi: 10.1212/WNL.0000000000200734. Epub 2022 Apr 6. Neurology. 2022. PMID: 35387857 Free PMC article. No abstract available.
Abstract
Background and objectives: Multiple biomarkers have been suggested to measure neurodegeneration (N) in the AT(N) framework, leading to inconsistencies between studies. We investigated the association of 5 N biomarkers with clinical progression and cognitive decline in individuals with subjective cognitive decline (SCD).
Methods: We included individuals with SCD from the Amsterdam Dementia Cohort and SCIENCe project, a longitudinal cohort study (follow-up 4±3 years). We used the following N biomarkers: CSF total tau (t-tau), medial temporal atrophy visual rating on MRI, hippocampal volume (HV), serum neurofilament light (NfL), and serum glial fibrillary acidic protein (GFAP). We determined correlations between biomarkers. We assessed associations between N biomarkers and clinical progression to mild cognitive impairment or dementia (Cox regression) and Mini-Mental State Examination (MMSE) over time (linear mixed models). Models included age, sex, CSF β-amyloid (Aβ) (A), and CSF p-tau (T) as covariates, in addition to the N biomarker.
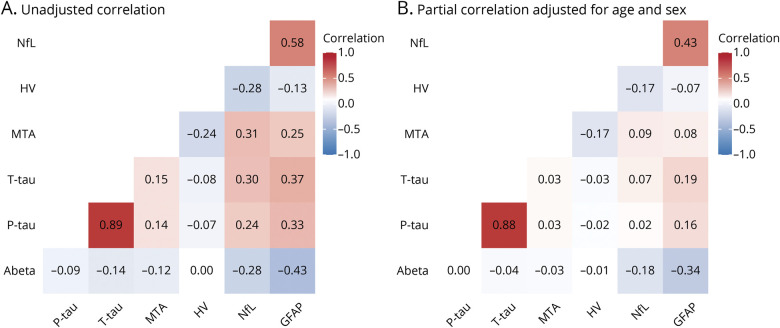
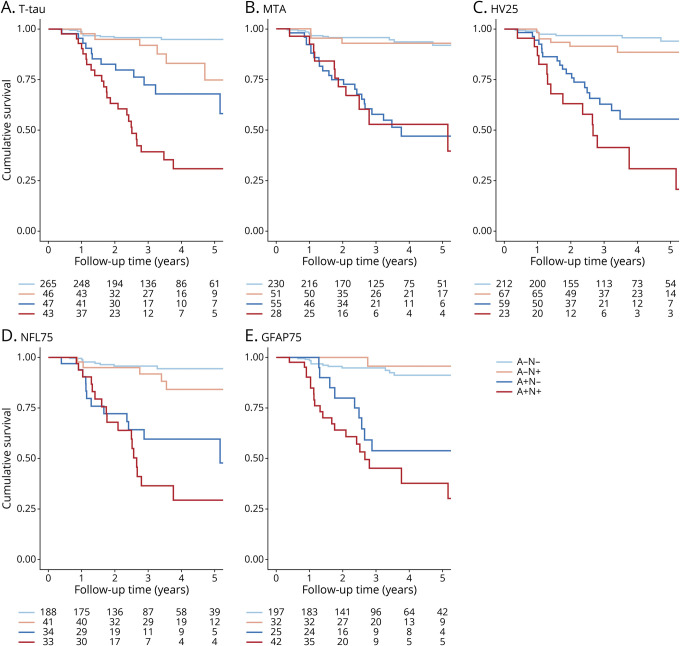
Result: We included 401 individuals (61±9 years, 42% female, MMSE 28 ± 2, vascular comorbidities 8%-19%). N biomarkers were modestly to moderately correlated (range r -0.28 - 0.58). Serum NfL and GFAP correlated most strongly (r 0.58, p < 0.01). T-tau was strongly correlated with p-tau (r 0.89, p < 0.01), although these biomarkers supposedly represent separate biomarker groups. All N biomarkers individually predicted clinical progression, but only HV, NfL, and GFAP added predictive value beyond Aβ and p-tau (hazard ratio 1.52 [95% CI 1.11-2.09]; 1.51 [1.05-2.17]; 1.50 [1.04-2.15]). T-tau, HV, and GFAP individually predicted MMSE slope (range β -0.17 to -0.11, p < 0.05), but only HV remained associated beyond Aβ and p-tau (β -0.13 [SE 0.04]; p < 0.05).
Discussion: In cognitively unimpaired older adults, correlations between different N biomarkers were only moderate, indicating they reflect different aspects of neurodegeneration and should not be used interchangeably. T-tau was strongly associated with p-tau (T), which makes it less desirable to use as a measure for N. HV, NfL, and GFAP predicted clinical progression beyond A and T. Our results do not allow to choose one most suitable biomarker for N, but illustrate the added prognostic value of N beyond A and T.
Classification of evidence: This study provides Class II evidence that HV, NfL, and GFAP predicted clinical progression beyond A and T in individuals with SCD.
Copyright © 2022 The Author(s). Published by Wolters Kluwer Health, Inc. on behalf of the American Academy of Neurology.
Figures
References
-
- Verberk IMW, Laarhuis MB, van den Bosch KA, et al. Serum markers glial fibrillary acidic protein and neurofilament light for prognosis and monitoring in cognitively normal older people: a prospective memory clinic-based cohort study. Lancet Healthy Longevity. 2021;2(2):E87-E95. - PubMed
MeSH terms
Substances
LinkOut - more resources
Full Text Sources
Medical
Research Materials
Miscellaneous