. 2022 Feb 8;119(6):e2117767119.
doi: 10.1073/pnas.2117767119.

In vivo imaging of the GnRH pulse generator reveals a temporal order of neuronal activation and synchronization during each pulse

Affiliations

In vivo imaging of the GnRH pulse generator reveals a temporal order of neuronal activation and synchronization during each pulse

Aleisha M Moore et al. Proc Natl Acad Sci U S A. .

Abstract

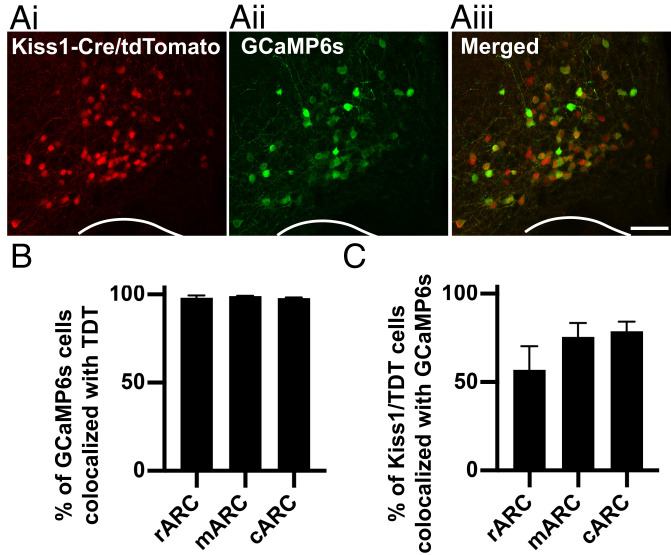
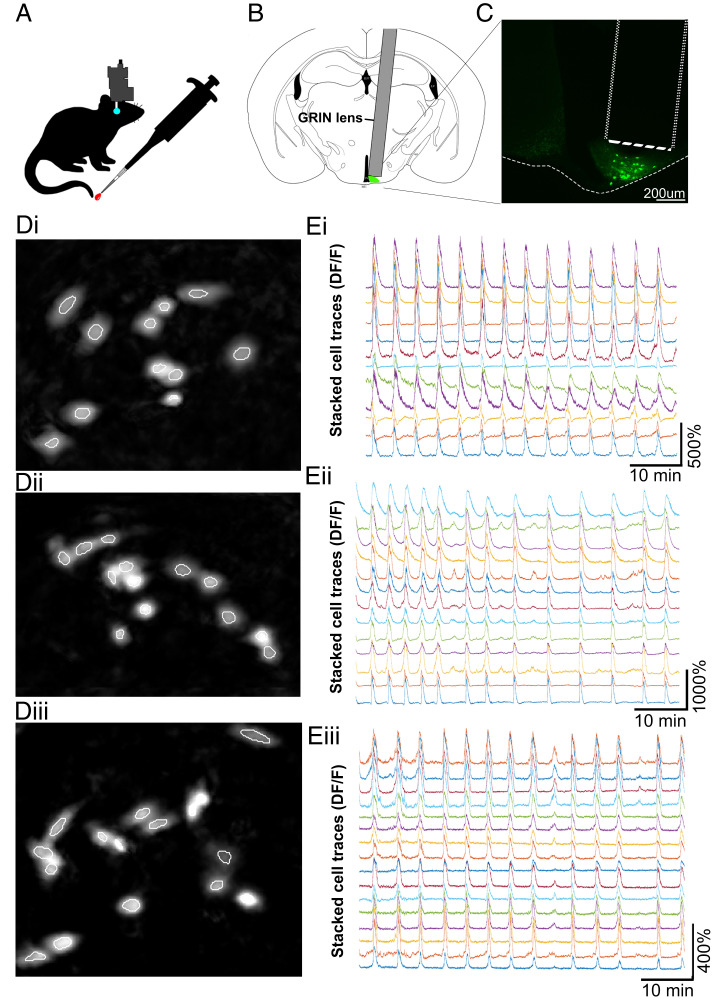
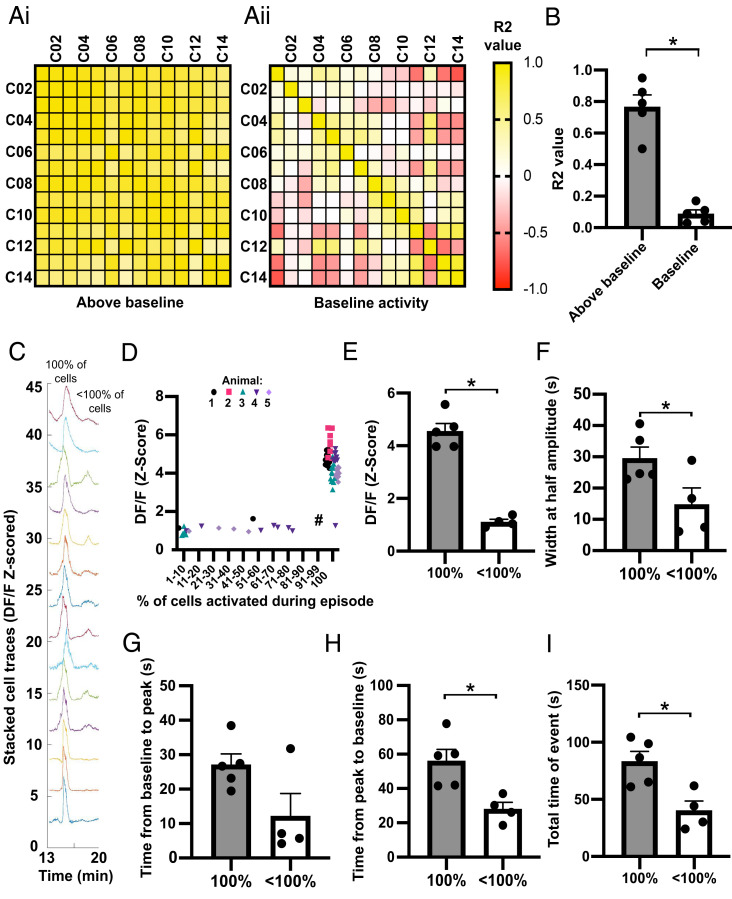
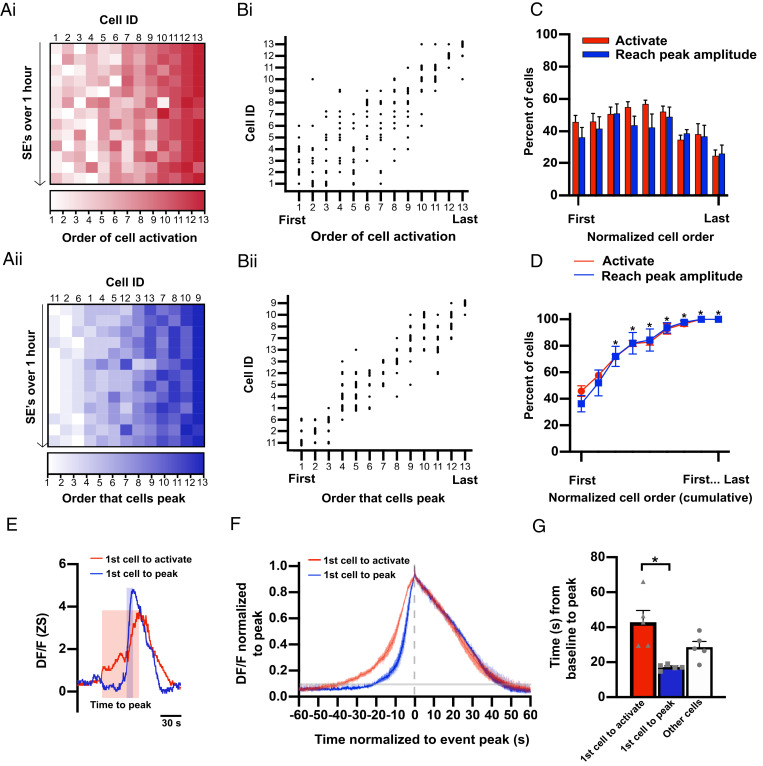
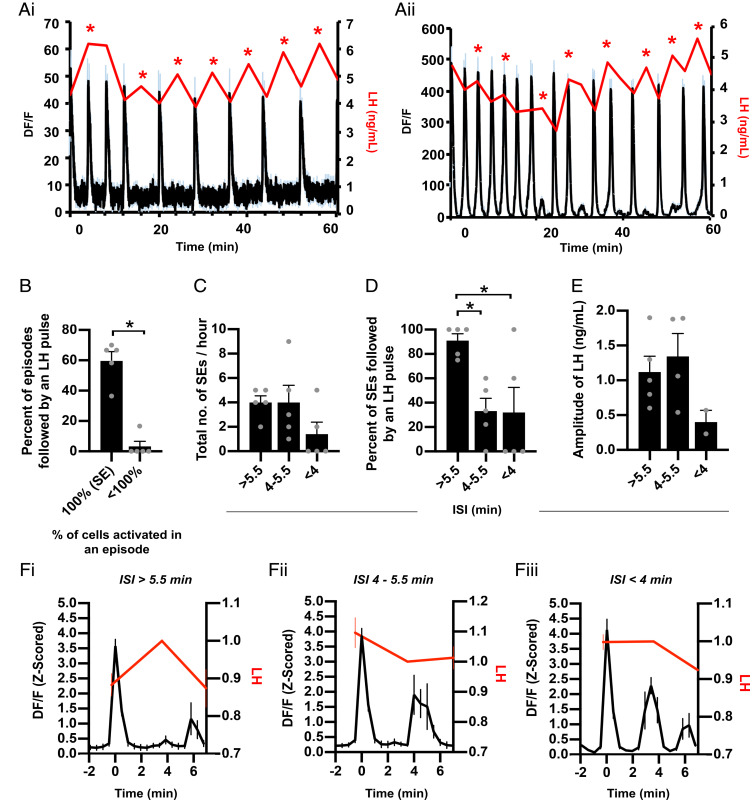
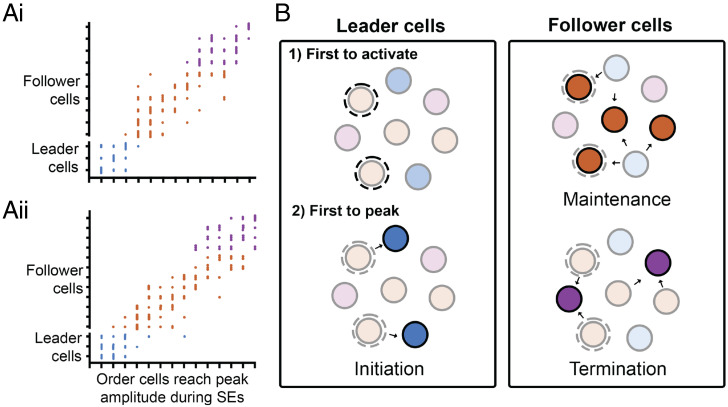
A hypothalamic pulse generator located in the arcuate nucleus controls episodic release of gonadotropin-releasing hormone (GnRH) and luteinizing hormone (LH) and is essential for reproduction. Recent evidence suggests this generator is composed of arcuate "KNDy" cells, the abbreviation based on coexpression of kisspeptin, neurokinin B, and dynorphin. However, direct visual evidence of KNDy neuron activity at a single-cell level during a pulse is lacking. Here, we use in vivo calcium imaging in freely moving female mice to show that individual KNDy neurons are synchronously activated in an episodic manner, and these synchronized episodes always precede LH pulses. Furthermore, synchronization among KNDy cells occurs in a temporal order, with some subsets of KNDy cells serving as "leaders" and others as "followers" during each synchronized episode. These results reveal an unsuspected temporal organization of activation and synchronization within the GnRH pulse generator, suggesting that different subsets of KNDy neurons are activated at pulse onset than afterward during maintenance and eventual termination of each pulse. Further studies to distinguish KNDy "leader" from "follower" cells is likely to have important clinical significance, since regulation of pulsatile GnRH secretion is essential for normal reproduction and disrupted in pathological conditions such as polycystic ovary syndrome and hypothalamic amenorrhea.

Keywords: KNDy; fertility; kisspeptin; luteinizing hormone; pulses.


Conflict of interest statement

The authors declare no competing interest.

Figures

Fig. 1.
Fig. 1.
Viral delivery of the calcium indicator GCaMP6s is highly specific to arcuate kisspeptin neurons. (A) Representative projected confocal images of the middle arcuate nucleus containing Kiss1-Cre cells expressing the tdTomato fluorophore (i, red), cells transfected with a Cre-dependent viral vector containing the calcium indicator GCaMP6s (ii, green), and merged images illustrating the high degree of colocalization between kisspeptin cells and GCaMP6s (iii). (B and C) Histograms depicting the percentage of GCaMP6-positive cells that are colocalized with Kiss1-Cre/tdTomato throughout the rostrocaudal extent of the ARC: in the rostral (r), middle (m), and caudal (c) portions (B) and the percentage of tdTomato-expressing kisspeptin cells that express GCaMP6s. (Scale bar, 100 µm.)
Fig. 2.
Fig. 2.
In vivo calcium imaging of KNDy cells in awake and freely moving mice reveals highly synchronized episodic activity at the single-cell level. (A) Ovariectomized female Kiss1-Cre mice with GCaMP6s expressed by ARC kisspeptin (KNDy) cells underwent 60 min of in vivo imaging of calcium activity in the arcuate nucleus using a microendoscope (Inscopix Inc.). Regular blood samples were collected from the tail tip for LH pulse analysis. Schematic representation (B) and fluorescent image (C) of GRIN lens placement above GCaMP6s-expressing KNDy cells. (D, iiii) Images of KNDy cells from representative animals generated following segmentation by the PCA-ICA algorithm (white outlines). (E, iiii) Representative traces of calcium activity extracted from individual KNDy cells identified using PCA-ICA in D, iiii revealing synchronized and episodic changes in fluorescence (DF/F) in awake and freely moving mice.
Fig. 3.
Fig. 3.
The KNDy neuron population displays either large SEs of activation by all cells or smaller episodes of activation by subgroups of cells. (A) Matrices for a representative mouse showing the correlation of activity (R2) between individual cells (C01–C14) when the average calcium activity for the population is above (i) or at (ii) baseline. (B) The mean ± SEM. R2 based on all animals (n = 5) is significantly higher when activity is elevated above baseline. (C) Representative fluorescent traces from individual cells during an SE in which 100% of cells are robustly activated, followed by lower amplitude activity by less than 100% of cells. (D) Graph demonstrating the amplitude of episodes (Z-scored DF/F) remains low unless 100% of cells are activated. Each data point represents an episode in each of the animals (74 episodes from five animals). (EI) Graphs demonstrating the mean ± SEM (n = 5) amplitude of episodes per animal (E) and the mean ± SEM width of an episode at half amplitude (F) is significantly higher when 100% of cells are activated compared to less than 100% of cells. The mean ± SEM time from baseline to peak is not significantly dependent on the percentage of cells activated (G); however, the time from peak to baseline (H) and the total time above baseline (I) is significantly higher when 100% of cells are activated in an episode compared to less than 100%. *P < 0.05.
Fig. 4.
Fig. 4.
KNDy cells activate and peak in a predictable temporal order during an SE. (A) Heat map from a representative animal depicting the order that fluorescence in individual cells (Cell ID, x axis) elevates above baseline (i, activation) and reaches peak amplitude (ii) during SEs (y axis, 13 SEs in 60 min). The cell IDs in i correspond with the cell IDs in ii. (B) Scatterplot mapping the order in which individual cells activate (i) and reach peak amplitude (ii) from the animal in A. (C and D) Graphs demonstrating the mean ± SEM percentage (C) and the mean ± SEM cumulative percentage (D) of KNDy cells per animal (n = 5) that activate or peak in order of first to last over multiple SEs in a 60-min recording. The asterisk in D indicates a significant increase compared to the percent of cells that activate or peak first. (E) Calcium traces from representative cells that activate first (red) and peak first (blue) during a single SE. The shaded boxes depict the time from baseline to peak for the cell that activates first (red box) and the cell that peak first (blue box). (F) The mean ± SEM calcium fluorescence (normalized to peak) per animal (n = 5) of cells that activate first versus cells that peak first, graphed with time 0 as the peak of fluorescent traces (gray dotted line). The shaded line on the y axis depicts the average point at which cell activity is above baseline. (G) Graph illustrating the mean ± SEM time from baseline to peak amplitude per animal (n = 5) for cells that activate first in an SE is significantly longer compared to cells that reach peak amplitude first. *P < 0.05.
Fig. 5.
Fig. 5.
LH pulses are generated by synchronized KNDy population activity with an interval of over 5 min. (A, i and ii) Representative examples from two animals of the mean (black line) ± SEM (blue error bars) change in fluorescence (DF/F) within the KNDy neuron population over a 60-min recording coupled with LH pulsatile release (red line). The asterisk depicts an LH pulse. (B) The percentage of episodes with KNDy cell activity followed by an LH pulse reveal episodes with less than 100% of cells recruited rarely elicit an LH pulse. (C) The number of SEs over a 60-min recording period that have an interval of over 5.5 min, 4 to 5.5 min, and under 4 min. (D) Graph summarizing that SEs with an ISI of over 5.5 min are followed by an LH pulse, whereas an ISI of under 5.5 min significantly reduces LH pulsatile release. (E) Graph illustrating that the amplitude of LH release is lower when a pulse is generated following a KNDy SE with an ISI of less than 4 min. (F) Fluorescent traces (peak at time 0) with an ISI of over 5.5 min (i), between 4 and 5.5 min (ii), and under 4 min (iii) plotted against LH that has normalized to the sample collected after the KNDy SE peak. Data in BF are depicted as averages per animal and expressed as mean ± SEM; n = 5; *P < 0.05.
Fig. 6.
Fig. 6.
Predicted model for the temporal ordering of KNDy neuron activation during SEs. (A) Scatterplots mapping the order of cell activity during SEs from 60-min recordings from two representative animals. Each dot represents the order in which a cell reached peak amplitude during an SE. KNDy neurons have been divided into “leader” and “follower cells” depending on their order of activation across multiple SEs and color-coded into the categories shown in B. (B) Schematic depicting the predicted temporal activation of KNDy neurons that drives LH pulsatile release. First, a population of leader cells first initiate an LH pulse (1) by exhibiting an increase in activity toward threshold and driving activation of a subpopulation of leader cells that peak first (2, blue cells), which activates reciprocally connected follower cells. Follower cells are further divided into cells that peak during the maintenance (orange cells) and termination (purple cells) phase of the KNDy/GnRH/LH pulse.

References

    1. Nakai Y., Plant T. M., Hess D. L., Keogh E. J., Knobil E., On the sites of the negative and positive feedback actions of estradiol in the control of gonadotropin secretion in the rhesus monkey. Endocrinology 102, 1008–1014 (1978). - PubMed
    1. Belchetz P. E., Plant T. M., Nakai Y., Keogh E. J., Knobil E., Hypophysial responses to continuous and intermittent delivery of hypopthalamic gonadotropin-releasing hormone. Science 202, 631–633 (1978). - PubMed
    1. de Roux N., et al. , Hypogonadotropic hypogonadism due to loss of function of the KiSS1-derived peptide receptor GPR54. Proc. Natl. Acad. Sci. U.S.A. 100, 10972–10976 (2003). - PMC - PubMed
    1. Seminara S. B., et al. , The GPR54 gene as a regulator of puberty. N. Engl. J. Med. 349, 1614–1627 (2003). - PubMed
    1. Irwig M. S., et al. , Kisspeptin activation of gonadotropin releasing hormone neurons and regulation of KiSS-1 mRNA in the male rat. Neuroendocrinology 80, 264–272 (2004). - PubMed

Publication types

LinkOut - more resources