. 2022 Mar 1;208(5):1232-1247.
doi: 10.4049/jimmunol.2101078. Epub 2022 Feb 2.

Group B Streptococcus Surface Protein β: Structural Characterization of a Complement Factor H-Binding Motif and Its Contribution to Immune Evasion

Affiliations

Group B Streptococcus Surface Protein β: Structural Characterization of a Complement Factor H-Binding Motif and Its Contribution to Immune Evasion

Xin Xu et al. J Immunol. .

Abstract

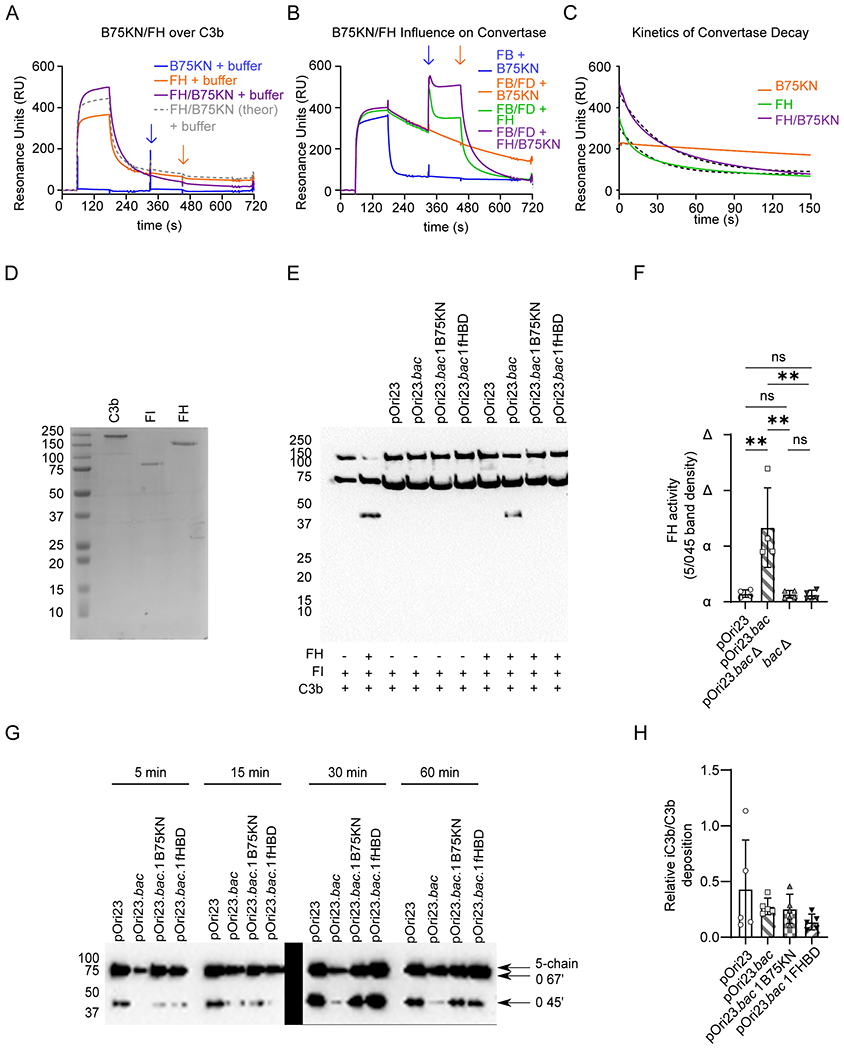
The β protein from group B Streptococcus (GBS) is a ∼132-kDa, cell-surface exposed molecule that binds to multiple host-derived ligands, including complement factor H (FH). Many details regarding this interaction and its significance to immune evasion by GBS remain unclear. In this study, we identified a three-helix bundle domain within the C-terminal half of the B75KN region of β as the major FH-binding determinant and determined its crystal structure at 2.5 Å resolution. Analysis of this structure suggested a role in FH binding for a loop region connecting helices α1 and α2, which we confirmed by mutagenesis and direct binding studies. Using a combination of protein cross-linking and mass spectrometry, we observed that B75KN bound to complement control protein (CCP)3 and CCP4 domains of FH. Although this binding site lies within a complement regulatory region of FH, we determined that FH bound by β retained its decay acceleration and cofactor activities. Heterologous expression of β by Lactococcus lactis resulted in recruitment of FH to the bacterial surface and a significant reduction of C3b deposition following exposure to human serum. Surprisingly, we found that FH binding by β was not required for bacterial resistance to phagocytosis by neutrophils or killing of bacteria by whole human blood. However, loss of the B75KN region significantly diminished bacterial survival in both assays. Although our results show that FH recruited to the bacterial surface through a high-affinity interaction maintains key complement-regulatory functions, they raise questions about the importance of FH binding to immune evasion by GBS as a whole.


Figures

Figure 1.
Figure 1.. A Protease-Stable Domain within the B75KN Region of GBS β Harbors a Binding Site for Factor H.
(A) Schematic representation of the β protein showing location of key domains. The shaded area indicates the minimal binding site of human factor H (FH) located in the C-terminal region of B75KN. The arrow indicates the location of the putative FH binding loop of the sequence QHLQKKN. (B) Reference-corrected SPR series for binding of the B6C-IgI3-B75KN fragment to immobilized FH showing both the experimental data (black traces) and the fit to a ligand heterogeneity model (red traces). (C) Reference-corrected SPR series for binding of the B6C fragment to immobilized FH showing both the experimental data (black traces) and the fit to a ligand heterogeneity model (red traces). (D) Reference-corrected SPR series for binding of the B75KN fragment to immobilized FH showing both the experimental data (black traces) and the fit to a ligand heterogeneity model (red traces). (E) Limiting proteolysis of B75KN by trypsin. A fixed concentration of the purified B75KN fragment (ctrl) was incubated with increasing concentrations of trypsin for 30 min prior to separating the reaction products by SDS-PAGE. The polypeptide species at ~25 kDa indicated by the arrow was characterized by tryptic-peptide mass fingerprinting. Molecular size standards (M) are shown at the left of the gel image. (F) Reference-corrected SPR series for binding of the B75KN-NTD fragment to immobilized FH showing both the experimental data (black traces) and the fit to a ligand heterogeneity model (red traces). (G) Reference-corrected SPR series for binding of the B75KN-CTD fragment to immobilized FH showing both the experimental data (black traces) and the fit to a ligand heterogeneity model (red traces). The parameters derived from analysis of various SPR series are found in Table 1.
Figure 2.
Figure 2.. Structural Analysis of B75KN-CTD and Identification of its FH-binding Site.
(A) Representation of the asymmetric unit for the B75KN-CTD crystal structure determined at 2.5 Å limiting resolution and refined to an Rfree value of 29.1% showing the correlation of the final 2Fo-Fc electron density map contoured at 1.3σ (blue mesh) with the model containing two copies of the B75KN-CTD protein (colored wire). Individual polypeptides are depicted with their N-terminus in blue and their C-terminus in red. Note the location of the disordered loop in each copy that could not be modelled due to weak electron density in that region. (B) Representation of B75KN-CTD as a cartoon diagram with its N-terminus in blue and its C-terminus in red. The locations of the secondary structure elements and the disordered loop are labelled. This image was drawn from Chain A of the final model. (C) Sequence/structure alignment comparing the N- through C-terminus of the B75KN-CTD model (top) with the B75KN-CTD-ΔG4 loop deletion mutant (bottom). Residues matching wild-type are highlighted purple in the bottom sequence, while the residues changed as highlighted pink. The location of secondary structure elements is presented at the top of the panel. (D) Structural superposition of the wild-type B75KN-CTD protein (grey cartoon) with an energy minimized model of the B75KN-CTD-ΔG4 mutant (purple cartoon). The glycine residues introduced in the mutant protein are colored pink. (E) Reference-corrected SPR series for binding of the B75KN-ΔG4 mutant to immobilized factor H (FH) showing both the experimental data (black traces) and the fit to a ligand heterogeneity model (red traces). An equivalent reference-corrected SPR series for binding of wild-type B75KN is shown for comparison (dotted grey traces). (F) Reference-corrected SPR series for binding of the B75KN-CTD-ΔG4 mutant to immobilized FH showing both the experimental data (black traces) and the fit to a ligand heterogeneity model (red traces). An equivalent reference-corrected SPR series for binding of wild-type B75KN-CTD is shown for comparison (dotted grey traces).
Figure 3.
Figure 3.. The B75KN Region of β Protein Binds FH in the CCP3 and CCP4 Modules.
(A) High-mass MALDI-TOF spectrum of a sample of B75KN following treatment with the bifunctional amine-reactive crosslinker DSS. (B) High-mass MALDI-TOF spectrum of a sample of FH following treatment with the bifunctional amine-reactive crosslinker DSS. The peak corresponding to a doubly charged species is labeled. (C) Comparison of high-mass MALDI-TOF spectra for a sample of either crosslinked B75KN plus factor H (FH; green) with that of either B75KN (blue) or FH (orange) alone. The peak corresponding to the B75KN/FH complex is labelled. (D) Representation of the site of B75KN crosslinks within FH. The structure of FH(1-4) is shown as a cartoon diagram (orange) with the locations of B75KN-crosslinked peptides highlighted (blue). A model of the lariat-like structure for full-length FH adsorbed to a sialic acid (grey) bearing surface (orange) is shown at the bottom left. The individual domains are numbered highlighting domains 1-4 as a complement regulatory region and domains 7 and 19-20 as polyanion binding sites (15). (E) Representation of the site of B75KN crosslinks with FH in the context of the FH(1-4/)C3b complex (67). FH(1-4) (orange ribbon) and C3b (grey surface) are shown with the cross-linked peptides highlighted (blue). Note that the crosslinked peptides are solvent accessible in this complex. (F) A similar image to panel E, but within the context of the mini-FH/C3b/factor I (FI) complex (69). Mini-FH (orange ribbon), C3b (grey surface), and FI (green surface) are shown with the cross-linked peptides highlighted (blue). Note that the presence of FI does not appear to change the solvent accessibility of the crosslinked peptides.
Figure 4.
Figure 4.. β Protein Expression Suppresses C3b Deposition onto the Bacterial Surface.
(A) Expression of β protein by L. lactis strains measured by SDS-PAGE analysis. Lysates of stationary phase isogenic GBS strains or L. lactis strains carrying pOri23, pOri23.bac, pOri23.bacΔB75KN, and pOri23.bacΔFHBD vectors were boiled in sample buffer, separated by SDS-PAGE and stained. (B) Surface expression of β protein by L. lactis strains measured by flow cytometry analysis. Mid-log phase L. lactis strains were incubated with 0.1% (v/v) rabbit anti-β serum or normal rabbit serum, washed, stained with FITC-goat anti-rabbit IgG (1:1000) then fixed in 1% PFA. Representative flow cytometry plots of n=3 replicates are shown. (C) Binding of FITC-labelled FH to the surface of L. lactis strains measured by flow cytometry. Mean and standard deviation of n=3 replicates are shown. (D) Total C3b deposition on the surface of L. lactis strains after incubation in human serum. Stationary phase L. lactis strains were incubated in 3% (v/v) human active serum (AS) or heat-inactivated serum (HIS) at 37 °C for 30 min, washed, stained with goat anti-C3-FITC pAb (1:1,000), washed, and fixed in 1% PFA. Total C3b deposition of AS relative to HIS was quantified. Mean and standard deviation of n=6 replicates are shown. ANOVA was performed to determine statistical significance. (*p<0.05, **p<0.01).
Figure 5.
Figure 5.. FH Bound by β Protein Retains its Complement Regulatory Activities.
(A) Site-specifically biotinylated C3b was captured on a streptavidin-coated biosensor and used to assess ligand binding by SPR. Representative reference-corrected sensorgrams for injections of 500 nM B75KN (blue trace), factor H (FH; orange trace), or pre-formed B75KN/FH complex (purple trace) are shown. The theoretical response for the B75KN/FH complex based upon the mass increase of the analyte relative to FH alone is also presented (grey dashed trace). Blue and orange arrows mark the start and stop of the second injection phase, respectively. (B) Representative reference-corrected sensorgrams illustrating the formation (first injection phase) and decay (second injection phase) of the alternative pathway (AP) C3 convertase on immobilized C3b are shown. Injections of factor B (FB) alone followed by B75KN (blue trace) are presented along with injection of a FB/factor D (FD) mixture followed by B75KN (orange trace). Injection of FB/FD followed by FH (green trace) highlights the decay-acceleration activity of FH. Injection of FB/FD followed by the B75KN/FH complex (purple) yielded a greater increase in SPR response when compared to FH alone, but decay acceleration activity was still present. (C) Plot showing the rate of convertase decay for B75KN alone (orange trace; t1/2=287 sec), FH alone (green trace; t1/2=16.7 sec), or the B75KN/FH complex (purple trace; t1/2=24.2 sec) across the 150 sec time interval following second injection stop. Data were taken from the experiment shown in panel B. Dashed black lines represent the data fit to a single exponential decay function. The experiments shown in panels A-C are representative of n= 3 replicates. (D) Purity of C3b, factor I (FI) and FH assessed by SDS-PAGE analysis. (E) FH bound to β protein retains its co-factor activity for FI mediated inactivation of C3b. Stationary phase L. lactis strains were incubated with FH (10 μg/mL) or buffer control, vigorously washed, and resuspended in the presence of C3b (10 μg/mL) and FI (10 μg/mL) at 37 °C for 30 min. Proteins were boiled under reducing conditions, separated by SDS-PAGE, and analyzed by Western blot. The membrane was stained for total C3 using goat-anti-C3 mAb (1:5,000) and HRP-conjugated rabbit anti-goat-IgG (1:10,000). Image representative of n=4 replicates. (F) Densitometry analysis of data in panel E was performed using FIJI software to measure the intensity of β and α2 bands. (G) Total C3b deposition on L. lactis strains after incubation in human serum. Stationary phase L. lactis strains were incubated with 30% (v/v) human serum for indicated time periods, vigorously washed and boiled in sample buffer. Proteins were separated by SDS-PAGE, and analyzed by Western blot. The membrane was stained for total C3 using anti-C3.HRP polyclonal antibody (1:10,000). Data is representative of n=2 assays. (H) Deposition of iC3b and C3b on the surface of L. lactis strains measured by flow cytometry analysis. L. lactis strains were incubated with 3% (v/v) human serum, washed, stained with mouse polyclonal antibodies against the iC3b neoantigen (5 μg/mL), mouse isotype control (5 μg/mL), goat anti-C3b-FITC or buffer. PE-conjugated goat anti-mouse-IgG (1:1,000) was used for detection of mouse antibodies. All samples were fixed in 1% (v/v) PFA and analyzed by flow cytometry. The mean and standard deviation of n=5 replicates is shown. ANOVA was performed to assess levels of statistical significance. (*p<0.05, **p<0.01)
Figure 6.
Figure 6.. The B75KN Domain of β protein Suppresses Bacterial Phagocytic Killing Through a FH-Independent Mechanism.
(A) Survival of L. lactis strains in human active and heat-inactivated serum. Mid-logarithmic phase L. lactis strains were incubated with 10% (v/v) serum or buffer at 37 °C for 120 min. The number of colony forming units (CFU) was quantified by serial dilution, plating and growth on GM17 agar plates. The percentage of bacterial survival was determined by the CFU ratio of inoculum and samples. (B) Phagocytosis of FITC-labelled L. lactis strains by human neutrophils after opsonisation in human serum. FITC-labelled stationary phase L. lactis strains incubated with human neutrophils at MOI 10 for 30 min at 37 °C with shaking. Neutrophils were washed, and fluorescence measured by flow cytometry. Mean and standard deviation of n=5 replicates is shown. (C) Survival of L. lactis strains in human whole blood. Mid-log phase L. lactis strains were inoculated into human whole blood and incubated at 37 °C with gentle rotation. CFU count was measured and the percentage of bacterial survival was determined as in panel A. The mean and standard deviation of n=5 replicates is shown. ANOVA was performed to determine statistical significance. (*p<0.05, **p<0.01)

Similar articles

Cited by

References

    1. Thomas L, and Cook L. 2020. Two-component signal transduction systems in the human pathogen Streptococcus agalactiae. Infection and immunity 88. - PMC - PubMed
    1. Doran KS, and Nizet V. 2004. Molecular Pathogenesis of Neonatal Group B Streptococcal Infection: No Longer in its Infancy. Mol. Micro 54: 23–31. - PubMed
    1. Ruppen C, Notter J, Strahm C, Sonderegger B, and Sendi P. 2018. Osteoarticular and skin and soft-tissue infections caused by Streptococcus agalactiae in elderly patients are frequently associated with bacteremia. Diagnostic microbiology and infectious disease 90: 55–57. - PubMed
    1. Leclercq SY, Sullivan MJ, Ipe DS, Smith JP, Cripps AW, and Ulett GC. 2016. Pathogenesis of Streptococcus urinary tract infection depends on bacterial strain and β-hemolysin/cytolysin that mediates cytotoxicity, cytokine synthesis, inflammation and virulence. Scientific reports 6: 1–14. - PMC - PubMed
    1. Saad EJ, Baenas DF, Boisseau CS, García MJ, Núñez SA, Sanchez PE, Balderramo DC, Hernández D, and Caeiro JP. 2018. Streptococcus agalactiae bacteremia in non-pregnant adult patients at two teaching hospitals. Revista Argentina de microbiologia 50: 280–284. - PubMed

Publication types

MeSH terms