. 2022 Feb 2;13(2):96.
doi: 10.1038/s41419-022-04538-w.

BMI1 nuclear location is critical for RAD51-dependent response to replication stress and drives chemoresistance in breast cancer stem cells

Affiliations

BMI1 nuclear location is critical for RAD51-dependent response to replication stress and drives chemoresistance in breast cancer stem cells

Violette Azzoni et al. Cell Death Dis. .

Abstract

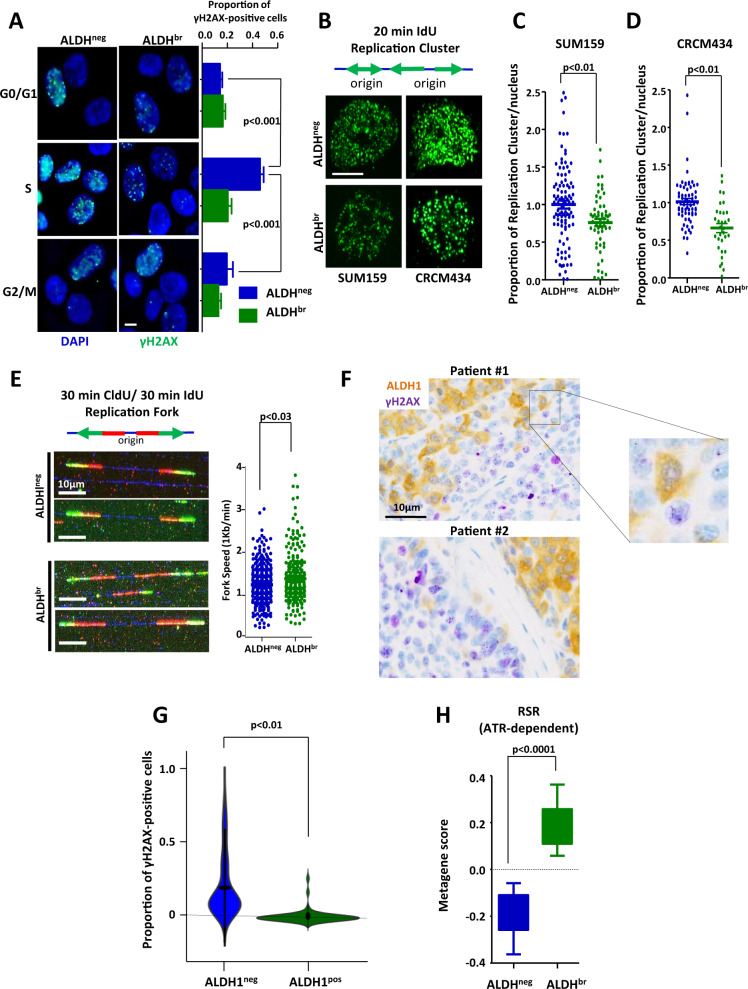
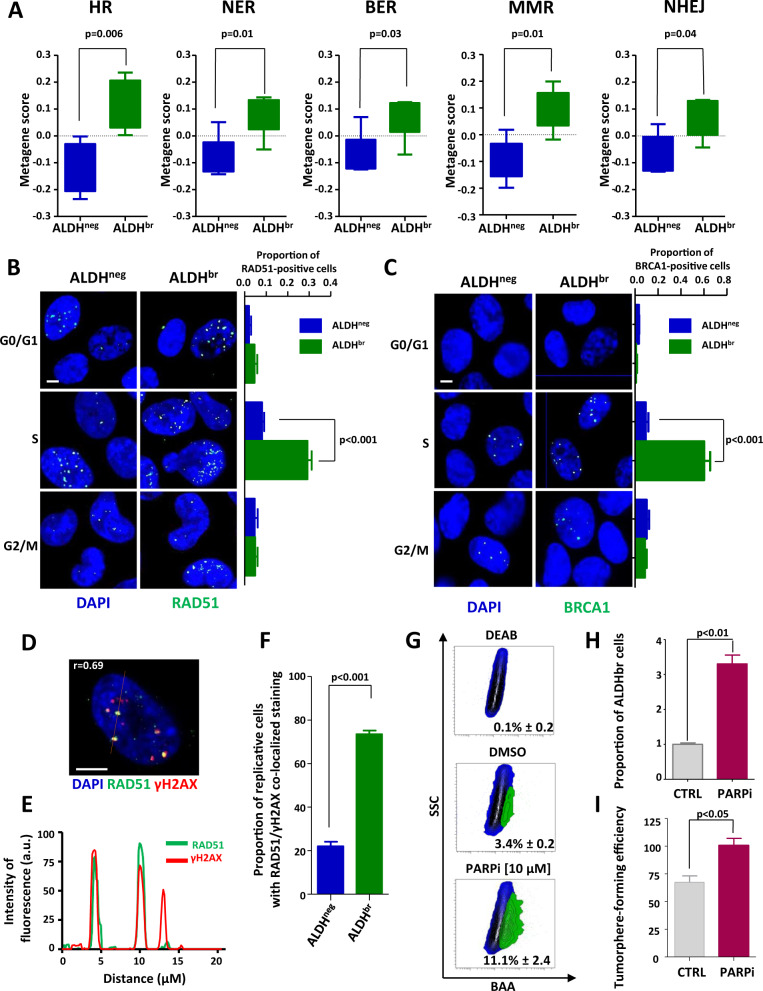
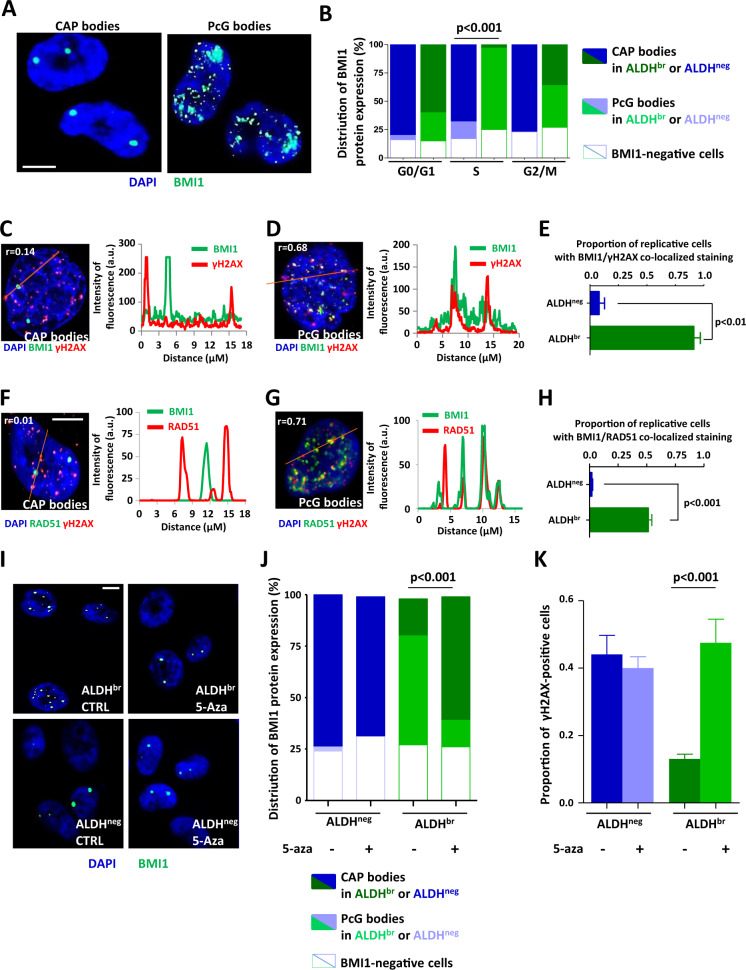
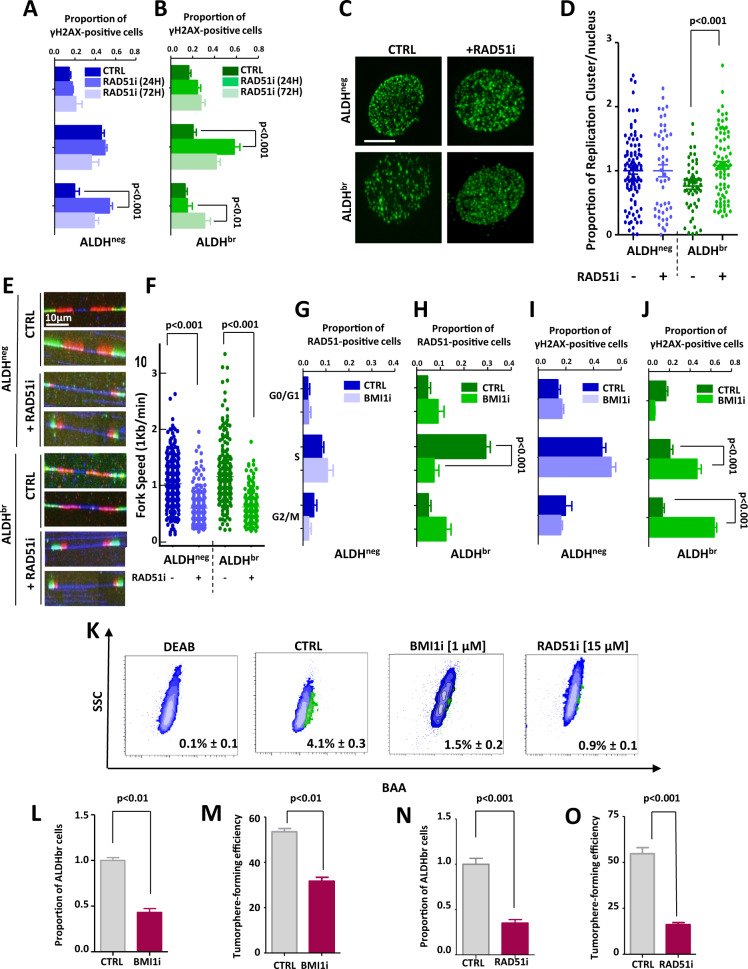
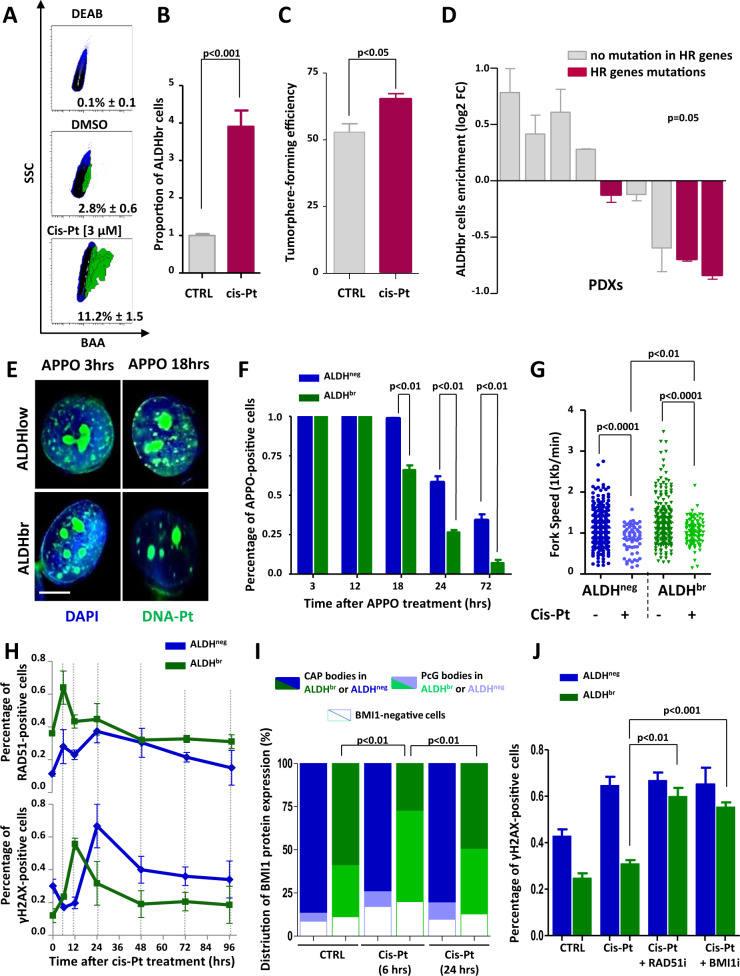
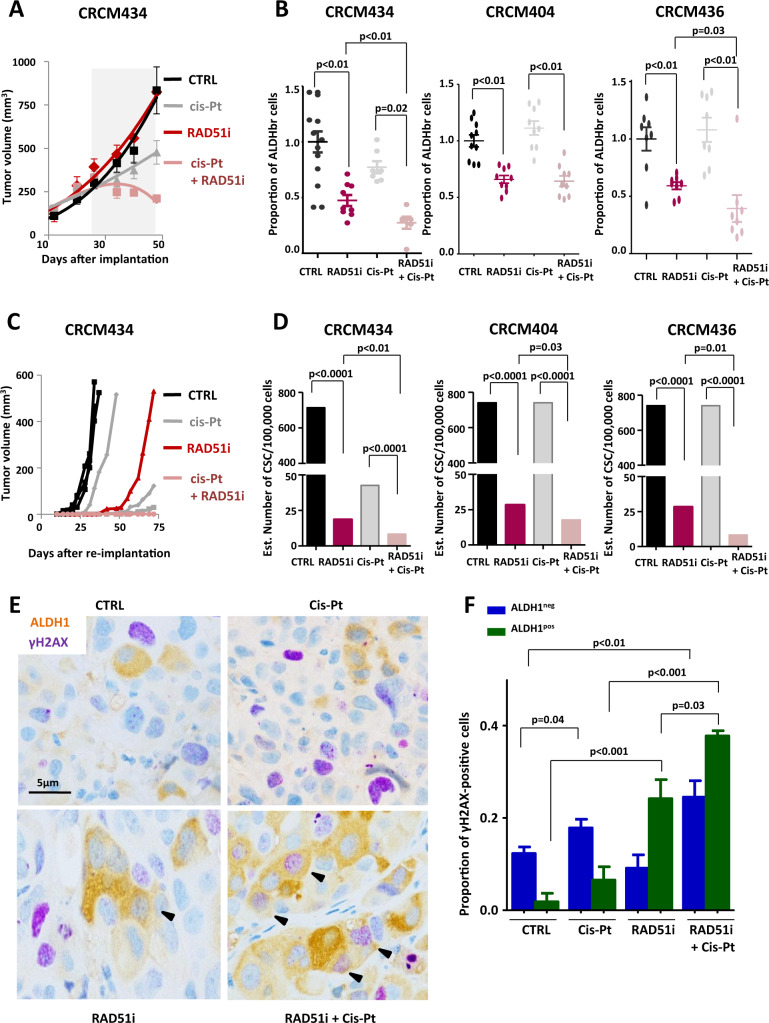
Replication stress (RS) has a pivotal role in tumor initiation, progression, or therapeutic resistance. In this study, we depicted the mechanism of breast cancer stem cells' (bCSCs) response to RS and its clinical implication. We demonstrated that bCSCs present a limited level of RS compared with non-bCSCs in patient samples. We described for the first time that the spatial nuclear location of BMI1 protein triggers RS response in breast cancers. Hence, in bCSCs, BMI1 is rapidly located to stalled replication forks to recruit RAD51 and activate homologous-recombination machinery, whereas in non-bCSCs BMI1 is trapped on demethylated 1q12 megasatellites precluding effective RS response. We further demonstrated that BMI1/RAD51 axis activation is necessary to prevent cisplatin-induced DNA damage and that treatment of patient-derived xenografts with a RAD51 inhibitor sensitizes tumor-initiating cells to cisplatin. The comprehensive view of replicative-stress response in bCSC has profound implications for understanding and improving therapeutic resistance.


Conflict of interest statement

The authors declare no competing interests.

Figures

Fig. 1
Fig. 1. ALDHbr breast CSCs presented reduced replication stress in vitro and in patient samples.
A Representative images of γH2AX staining (green foci) in ALDHbr and ALDHneg cells sorted according to their cell-cycle phase (G0/G1, S, and G2/M). Nuclei are counterstained with DAPI (blue staining). Scale bar: 5 μm. Bar plots represent the proportion of γH2AX-positive cells for each cell subpopulation. B SUM159 and CRCM434 cells were pulse-labeled with iododeoxyuridine (IdU) for 20 min and fixed. Active replication clusters were detected by immunostaining for IdU (green foci). Scale bar: 5 μm. C, D Bee-swarm plots representing the proportion of replication clusters per nucleus in each cell subpopulation (ALDHbr and ALDHneg) isolated from SUM159 (C) and CRCM434 (D). E Cells were sequentially labeled with chlorodeoxyuridine (CldU) and IdU for 30 min each. The replication forks progress in both directions at the same rate and integrate the analogs. Representative images of combed DNA molecules are shown. CldU (green staining) and IdU (red staining) were detected using specific antibodies and DNA is counterstained with DAPI (blue staining). Scale bar: 10 μm. Bee-swarm plots represent the distribution of fork speed in ALDHbr and ALDHneg cells. F Representative tumor-sample sections with γH2AX (purple staining) and ALDH (brown staining) immunostaining. G Violin plot representing the proportion of γH2AX-positive cells in ALDH1pos and ALDH1neg cell subpopulations detected on breast tumor samples. Scale bar: 10 μm. H Box plot representing the gene expression level of the replication-stress-response metagene in ALDHbr and ALDHneg cells isolated from PDXs. Statistical test used is Student’s t-test. Data represent mean ± SD.
Fig. 2
Fig. 2. Replicative ALDHbr bCSCs demonstrated enhanced DNA-repair activity.
A Box plots representing the gene-expression level of DNA-repair pathway metagenes in ALDHbr and ALDHneg cells isolated from PDXs. B, C Representative images of RAD51 foci (B) and BRCA1 foci (C) (green staining) in ALDHbr and ALDHneg cells sorted according to their cell cycle phase (G0/G1, S, and G2/M). Nuclei are counterstained with DAPI (blue staining). Scale bar: 5μm. Bar plots represent the proportion of RAD51-positive cells (B) or BRCA1-positive cells (C) for each cell subpopulation. D Representative images of RAD51 costaining (green foci) with γH2AX (red foci). Nuclei are counterstained with DAPI (blue staining). The red line corresponds to the line scan. Pearson’s coefficient evaluated the amount of colocalization. Scale bar: 5 μm. E Line-scan profile of the relative intensity of RAD51 and γH2AX fluorescent signals. F Bar plot representing the proportion of replicative cells with RAD51/γH2AX colocalized in ALDHbr and ALDHneg SUM159 cells. G Representative examples of flow chart for the ALDEFLUOR staining following PARPi treatment in SUM159 cells. DEAB is an ALDH inhibitor used as negative control. H Bar plot representing the proportion of ALDHbr cells following PARPi treatment compared with the untreated condition (CTRL). I Bar plot representing tumorsphere-forming efficiency (SFE) for SUM159 cells under PARPi-treated and -untreated conditions. Statistical test used is Student’s t-test. Data represent mean ± SD.
Fig. 3
Fig. 3. BMI1 nuclear location affects replicative stress response in breast cancer cells.
A Representative images of BMI1 staining (green bodies). Nuclei are counterstained with DAPi (blue staining). BMI1 protein can accumulate in CAP bodies (left panel) or has uniform punctate distribution (PcG bodies, right panel). Scale bar: 5 μm. B Stacked bar plot representing the proportion of CAP and PcG bodies in ALDHbr and ALDHneg SUM159 cells sorted according to their cell-cycle phase (G0/G1, S, and G2/M). C, D Representative images (left panels) of BMI1 costaining (green foci) with γH2AX (red foci) for cells harboring CAP bodies (C) or PcG bodies (D). Nuclei are counterstained with DAPi (blue staining). The red lines correspond to the line scans. Pearson’s coefficient evaluated the amount of colocalization. Scale bar: 5 μm. On the right panels, line-scan profiles of the relative intensity of BMI1 and γH2AX fluorescent signals. E Bar plots representing the proportion of replicative ALDHbr and ALDHneg SUM159 cells with BMI1/γH2AX colocalization. F, G Representative images (left panels) of BMI1 costaining (green foci) with RAD51 (red foci) for cells harboring CAP bodies (F) or PcG bodies (G). Nuclei are counterstained with DAPi (blue staining). The red lines correspond to the line scans. Pearson’s coefficient evaluated the amount of colocalization. Scale bar: 5 μm. On the right panels, line-scan profiles of the relative intensity of BMI1 and RAD51 fluorescent signals. H Bar plots representing the proportion of replicative ALDHbr and ALDHneg SUM159 cells with BMI1/RAD51 colocalization. I Representative images of BMI1 staining (green bodies) in ALDHbr and ALDHneg SUM159 cells treated with 5-aza or untreated (CTRL). Nuclei are counterstained with DAPi (blue staining). J Stacked bar plot representing the proportion of CAP and PcG bodies in replicative ALDHbr and ALDHneg SUM159 cells treated with 5-aza or untreated. K Bar plots representing the proportion of γH2AX-positive cells for each cell subpopulation (replicative ALDHbr and ALDHneg SUM159 cells) following 5-aza treatment or in untreated conditions (CTRL). Statistical test used is Student’s t-test. Data represent mean ± SD.
Fig. 4
Fig. 4. BMI1/RAD51 axis inhibition enhanced replication stress of ALDHbr bCSCs.
A, B Bar plots representing the proportion of γH2AX foci in ALDHneg (A) and ALDHbr (B) SUM159 cells sorted according to their cell-cycle phases, after 24 h/72 h of treatments with RAD51i or DMSO (CTRL). C–F Quantification of replication-stress markers in ALDHbr and ALDHneg SUM159 cells treated with RAD51i or DMSO (CTRL). C Representative images of active replication clusters (green staining). Scale bar: 5 μm. D Bee-swarm plots representing the proportion of replication clusters per nucleus in each SUM159 cell subpopulation. E Representative images of combed DNA molecules. CldU (green staining) and IdU (red staining) were detected using specific antibodies and DNA is counterstained with DAPI (blue staining). Scale bar: 10 μm. F Bee-swarm plots representing the distribution of fork speed in each cell subpopulation. G–J Bar plots representing the proportion of RAD51-positive (G, H) or γH2AX-positive cells (I, J) in ALDHneg (G, I) and ALDHbr (H, J) SUM159 cells sorted according to their cell-cycle phases, after treatment with BMI1i or DMSO (CTRL). K Representative examples of flowchart for the ALDEFLUOR staining following BMI1i or RAD51i treatment in SUM159 cells. DEAB is an ALDH inhibitor used as negative control. L, N Bar plot representing the proportion of ALDHbr cells following BMI1i (L) or RAD51i (N) treatment compared with the untreated condition (CTRL). M, O Bar plot representing tumorsphere-forming efficiency (SFE) for SUM159 cells under BMI1i (M) or RAD51i (O) treatment compared with untreated conditions (CTRL). Statistical test used is Student’s t-test. Data represent mean ± SD.
Fig. 5
Fig. 5. ALDHbr bCSCs resist to cisplatin in a BMI1/RAD51-dependent manner.
A Representative examples of flowchart for the ALDEFLUOR staining following cisplatin treatment in SUM159 cells. DEAB is an ALDH inhibitor used as negative control. B Bar plot representing the proportion of ALDHbr cells following cisplatin treatment compared with the untreated condition (CTRL). C Bar plot representing tumorsphere-forming efficiency (SFE) for SUM159 cells under cisplatin-treated and -untreated conditions. D Waterfall plot representing the range of change in ALDHbr bCSC proportion in PDXs treated with cisplatin. Positive changes represent enrichment in bCSCs and negative changes in reduction of bCSCs compared with the untreated conditions. A two-sided chi-square test evaluates the probability to predict bCSC response to cisplatin according to the presence of HR gene mutation in PDX. E Detection of labeled DNA–pt lesions (green staining) in ALDHbr and ALDHneg SUM159 cells using clickable cisplatin derivative APPO. Nuclei are counterstained with DAPI (blue staining). Scale bar: 5 μm. F Bar plot representing the proportion of ALDHbr and ALDHneg SUM159 cells with DNA-pt lesions at different time points following APPO treatment. G Bee swarm plots representing the distribution of forks speed in each cell subpopulations untreated or treated with cisplatin. H Kinetic curves tracing the proportion of RAD51-positive or γH2AX-positive cells following cisplatin treatment, in each cell subpopulations. I Stacked bar plot representing the proportion of CAP and PcG bodies in ALDHbr and ALDHneg SUM159 cells treated with 6 h/24 h of cisplatin compared with untreated condition (CTRL). J Bar plot representing the proportion of γH2AX-positive cells in ALDHbr and ALDHneg SUM159 cells treated with cisplatin alone or in combination with RAD51i or BMI1i. Statistical test used is Student’s t-test. Data represent mean ± SD.
Fig. 6
Fig. 6. Cisplatin/RAD51i combination decreases the bCSC population in PDXs through an enhanced replication stress.
A Effect of RAD51i and cisplatin treatment alone or in combination on the tumor growth of CRCM434, compared with the vehicle-treated condition. The gray area corresponds to the treatment period. B Bee-swarm plots representing the proportion of ALDHbr bCSCs in treated PDXs (CRCM434, CRCM404, and CRCM436) compared with the proportion of ALDHbr bCSCs in the vehicle‐treated tumors. C Reimplantation assay (CRCM434). Three-week treated PDXs were reimplanted, in serial dilutions, into new recipient mice, and tumor growth was monitored. Each curve represents the growth kinetics from one individual injection. D Bar plots representing bCSC frequency calculated using an extreme limiting dilution analysis (ELDA). The results are expressed as the estimated number of bCSCs for 100,000 tumor cells. Statistical test used is pairwise chi-square test. E Representative images of tumor section from PDX treated with RAD51i and cisplatin alone or in combination, compared with the vehicle-treated tumors (CTRL). Each section was co-immunostained with γH2AX (purple staining) and ALDH (brown staining). Arrowheads point out to costained cells. Scale bar: 5 μm. F Bar plot representing the proportion of γH2AX-positive cells in ALDH1pos and ALDH1neg cell subpopulations detected by co-immunostaining on PDX-treated tumor sections. Statistical test used is Student’s t-test. Data represent mean ± SD.

References

    1. Gaillard H, García-Muse T, Aguilera A. Replication stress and cancer. Nat Rev Cancer. 2015;15:276–89. - PubMed
    1. Macheret M, Halazonetis TD. DNA replication stress as a hallmark of cancer. Annu Rev Pathol. 2015;10:425–48. - PubMed
    1. Maley CC, Aktipis A, Graham TA, Sottoriva A, Boddy AM, Janiszewska M, et al. Classifying the evolutionary and ecological features of neoplasms. Nat Rev Cancer. 2017;17:605–19. - PMC - PubMed
    1. Kreso A, Dick JE. Evolution of the cancer stem cell model. Cell Stem Cell. 2014;14:275–91. - PubMed
    1. Greaves M. Evolutionary determinants of cancer. Cancer Disco. 2015;5:806–20. - PMC - PubMed

Publication types

MeSH terms