. 2022 Feb 2;13(1):626.
doi: 10.1038/s41467-022-28076-3.

Primary tumor associated macrophages activate programs of invasion and dormancy in disseminating tumor cells

Affiliations

Primary tumor associated macrophages activate programs of invasion and dormancy in disseminating tumor cells

Lucia Borriello et al. Nat Commun. .

Abstract

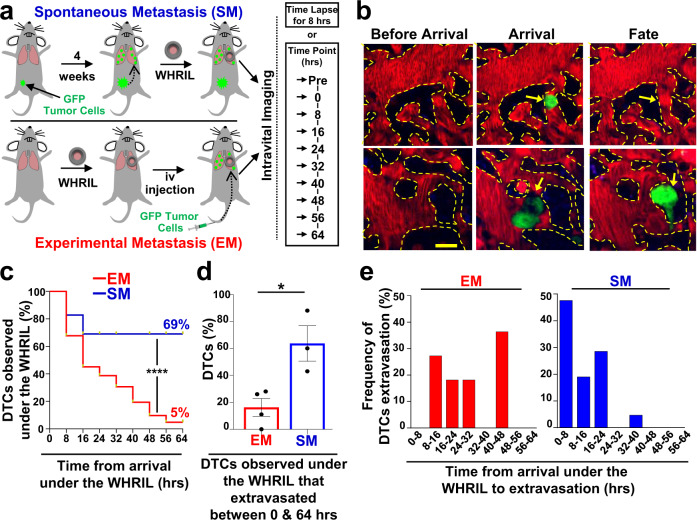
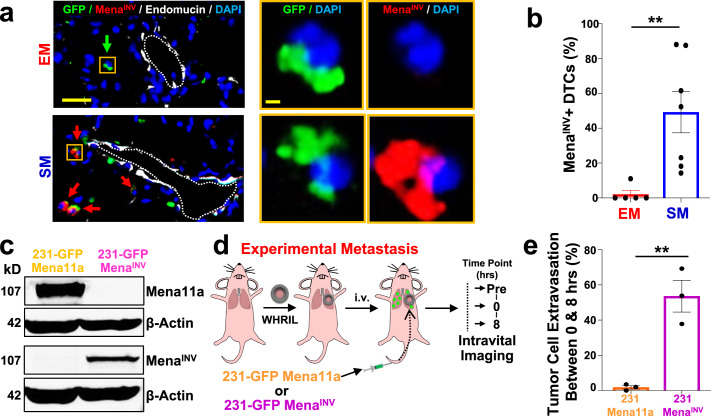
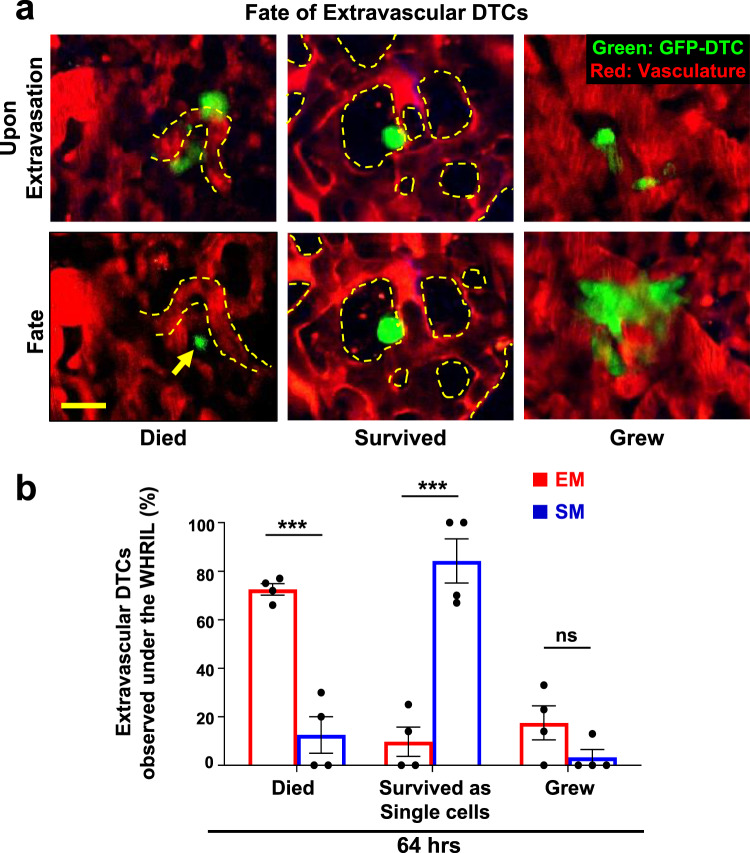
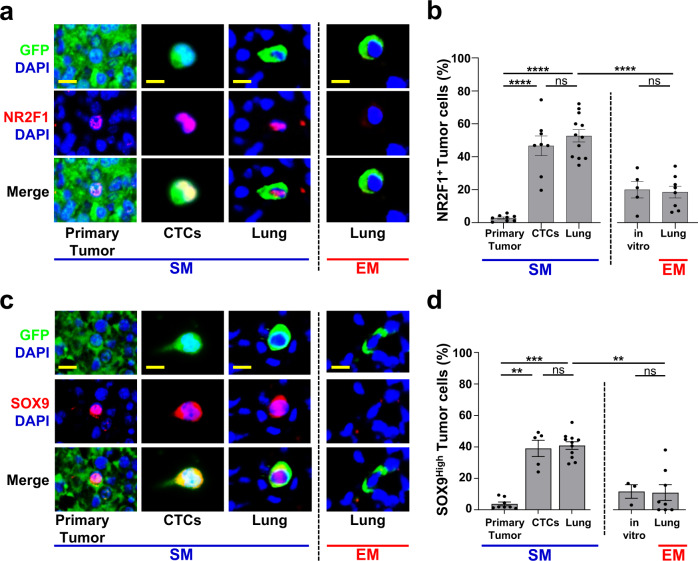
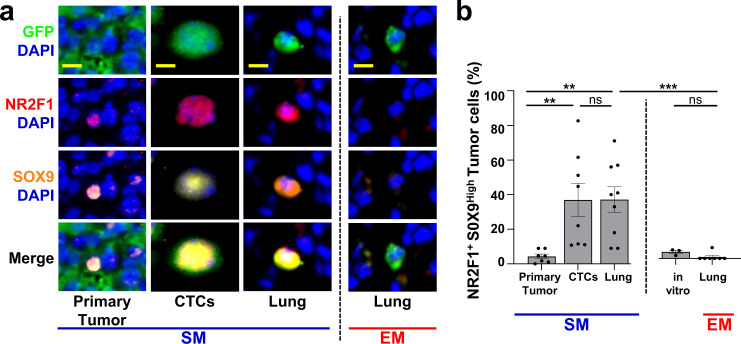
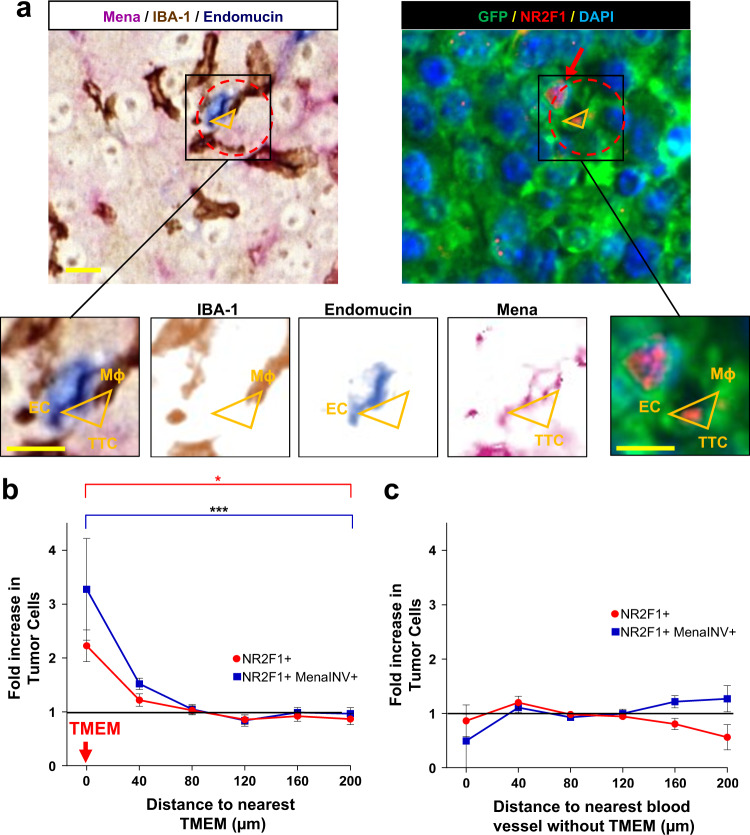
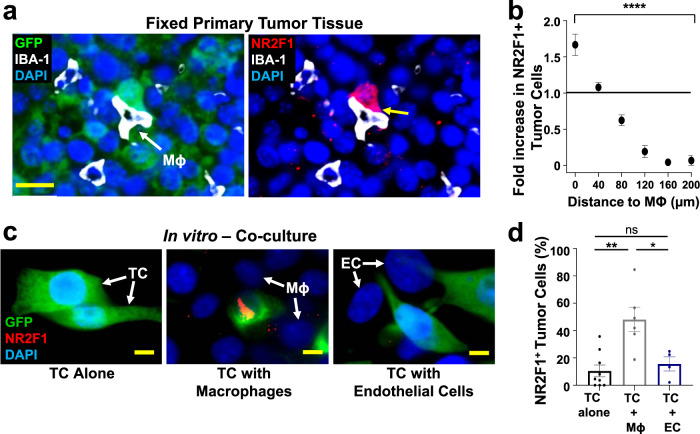
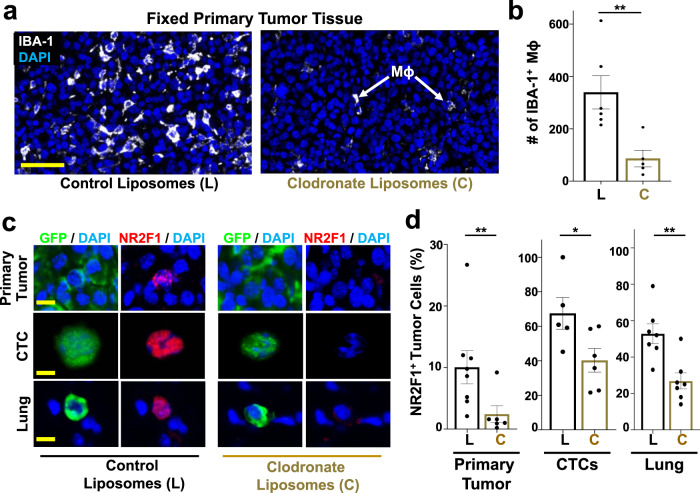
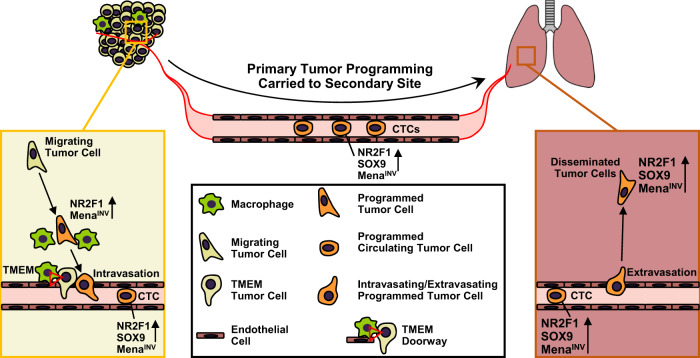
Metastases are initiated by disseminated tumor cells (DTCs) that colonize distant organs. Growing evidence suggests that the microenvironment of the primary tumor primes DTCs for dormant or proliferative fates. However, the manner in which this occurs remains poorly understood. Here, using the Window for High-Resolution Intravital Imaging of the Lung (WHRIL), we study the live lung longitudinally and follow the fate of individual DTCs that spontaneously disseminate from orthotopic breast tumors. We find that spontaneously DTCs have increased levels of retention, increased speed of extravasation, and greater survival after extravasation, compared to experimentally metastasized tumor cells. Detailed analysis reveals that a subset of macrophages within the primary tumor induces a pro-dissemination and pro-dormancy DTC phenotype. Our work provides insight into how specific primary tumor microenvironments prime a subpopulation of cells for expression of proteins associated with dissemination and dormancy.


Conflict of interest statement

Dr. Julio Aguirre-Ghiso is a scientific Co-Founder of, Scientific Advisory Board Member, and equity owner in the private company, HiberCell, LLC. In addition, Dr. Aguirre-Ghiso receives financial compensation as a consultant for HiberCell, LLC. HiberCell, LLC. is a Mount Sinai spin-out company focused on the research and development of therapeutics that prevent or delay the recurrence of cancer. The remaining authors declare no competing interests.

Figures

Fig. 1
Fig. 1. Tumor cells that spontaneously disseminate from the primary tumor to the lung have a drastically increased metastatic efficiency compared to intravenously injected tumor cells.
a Experimental design to track the fate of individual disseminated tumor cells using an Experimental Metastasis (EM) model (top) and a Spontaneous Metastasis (SM) model (bottom). b Serial imaging through the WHRIL allows tracking of the fate of disseminated tumor cells. Vasculature before arrival (left), upon arrival (middle) and after arrival of tumor cells (TCs). Fate of TCs (yellow arrows) could be either recirculation or apoptosis (right, top) or extravasation into the lung parenchyma (right, bottom). Red = tdTomato labeled endothelial cells and 155 kDa Tetramethylrhodamine dextran labeled blood serum, Green = GFP labeled tumor cells, Blue = second harmonic generation. Scale bar = 15 μm. c Kaplan-Meier survival curves showing the percentage of E0771-GFP tumor cells observed under the WHRIL at each 8 hr time point over a period of 64 hrs. EM: n = 62 tumor cells analyzed in 3 mice. SM: n = 29 tumor cells analyzed in 3 mice. Log-rank (Mantel-Cox) test (p < 0.0001). ****p < 0.0001. d Percentage of E0771-GFP EM and SM tumor cells observed under the WHRIL that extravasated between 0 and 64 hrs after arrival. EM: n = 89 tumor cells in 4 mice. SM: n = 29 tumor cells in 3 mice. Bar = mean. Error bars = ±SEM. Unpaired two-tailed t-test (p = 0.017). *p < 0.05. e Quantification of the time from arrival under the WHRIL to extravasation into the lung parenchyma for each E0771-GFP EM and SM tumor cell. Left: EM: n = 11 tumor cells in 3 mice. Right: SM: n = 21 tumor cells in 3 mice. Source data are provided as a Source Data file.
Fig. 2
Fig. 2. MenaINV expression in disseminated tumor cells regulates extravasation efficiency.
a Left: MenaINV expression in extravascular E0771-GFP tumor cells in the lung of an EM model (top) and an SM model (bottom). Green arrow: MenaINV negative tumor cell. Red arrows: MenaINV positive tumor cells. Scale bar = 50 μm. Right: Zoomed in view of a disseminated tumor cell (yellow box) in both models. Green = GFP, Red = MenaINV, White = endomucin, Blue = DAPI. Scale bar = 10 μm. b Quantification of extravascular MenaINV positive disseminated tumor cells in the lung of each group from Fig. 2a. EM: n = 41 cells in 5 animals. SM: n = 89 cells in 7 animals. Bar = mean. Error bars = ±SEM. Two-tailed Mann-Whitney test (p = 0.0025). **p < 0.01. c Western blot of 231-GFP-Mena11a and 231-GFP-MenaINV cells. β-Actin was used as a loading control. Full blot is presented in Supplementary Fig. 16. d Outline of experimental design to determine percentage of tumor cells able to extravasate between 0 and 8 h after iv-injection. Intravital imaging of the lung vasculature through the WHRIL was performed before (Timepoint = “Pre”), immediately after (Time point = 0 h), and then finally 8 h after tumor cell injection (Time point = 8 h). e Percentage of tumor cells that extravasated between 0 and 8 h after iv injection. 231-GFP-Mena11a: n = 90 cells in 3 mice. 231-GFP-MenaINV: n = 88 tumor cells in 3 mice. Bar = mean. Error bars = ±SEM. Two-tailed unpaired t-test (p = 0.0048). **p < 0.01. Source data are provided as a Source Data file.
Fig. 3
Fig. 3. Spontaneously metastasizing tumor cells survive significantly longer at the secondary site compared to intravenously injected tumor cells.
a Representative intravital microscopy images showing the possible fates of extravascular disseminated tumor cells in the lung parenchyma. Top: Images of disseminated tumor cells just after extravasation. Bottom left: Example of an extravascular tumor cell, which has died, as evidenced by small extravascular apoptotic bodies (yellow arrow). Bottom middle: Example of an extravascular tumor cell that survived as a single and solitary tumor cell over time. Bottom right: Example of an extravascular tumor cell that began to divide and grow into a micro-metastasis. Red = tdTomato labeled endothelial cells and 155 kDa Tetramethylrhodamine dextran labeled blood serum, Green = GFP labeled tumor cells. Yellow dashed lines delineate blood vessel boundaries. Scale bar = 15 μm. b Percentage of extravascular E0771-GFP disseminated tumor cells that died, survived, or grew after extravasation in EM and SM models 64 hrs after arrival to the lung vasculature. EM: n = 27 tumor cells in 4 mice. SM: n = 31 tumor cells in 4 mice. Bar = mean. Error bars = ±SEM. For Died and Survived columns, a two-tailed unpaired t-test was used (p = 0.0003 and 0.0005, respectively). For Grew columns, a two-tailed Mann-Whitney test was used (p = 0.14). ***p < 0.001. ns = not significant. Source data are provided as a Source Data file.
Fig. 4
Fig. 4. Spontaneously metastasizing tumor cells are more frequently positive for dormancy or stem-like markers compared to intravenously injected tumor cells.
a Representative immunofluorescence images of NR2F1 expression in primary tumors, circulating tumor cells (CTCs), and disseminated tumor cells (Lung) from an E0771-GFP SM model (Left) and in disseminated tumor cells (Lung) from an EM model (right). Green = GFP, Red = NR2F1, Blue = DAPI. Scale bar for Primary Tumor = 50 μm. Scale bar for CTCs and Lung = 15 μm. b Percentage of NR2F1-positive and negative tumor cells in each group in A. Primary Tumor: n = 2,041 cells in 115 fields of view (65 × 65 µm2) in 8 animals; CTCs: n = 550 cells in 8 animals; SM Lung: n = 237 cells in 12 animals; EM Lung: n = 199 cells in 8 animals. In vitro: n = 463 cells in 5 independent experiments. Bar = mean. Error bars = ±SEM. For all comparisons, a two-tailed one-way ANOVA test with Sidak’s multiple comparisons adjustment was used (PT vs. CTC: p < 0.0001; PT vs. Lung SM: p < 0.0001; CTC vs. Lung SM: p = 0.80; Lung SM vs. Lung EM: p < 0.0001; In vitro vs. Lung EM: p = 1.00). ****p < 0.0001. ns = not significant. c Representative immunofluorescence images of SOX9 expression in primary tumors, circulating tumor cells (CTCs), and disseminated tumor cells (Lung) from an E0771-GFP SM model (Left) and in disseminated tumor cells (Lung) from an EM model (right). Green = GFP, Red = SOX9, Blue = DAPI. Scale bar for Primary Tumor = 50 μm. Scale bar for CTCs and Lung = 15 μm. d Percentage of SOX9High tumor cells from each group in C. Primary Tumor: n = 4,633 cells in 150 fields of view (65 × 65 µm2) in 8 animals; CTCs: n = 558 cells in 5 animals, SM Lung: n = 341 cells in 11 animals; EM Lung: n = 182 cells in 8 animals. In vitro: n = 298 cells in 3 independent experiments. Bar = mean. Error bars = ±SEM. For CTC vs. Lung SM (p = 0.89) a two-tailed one-way ANOVA test with Sidak’s multiple comparisons adjustment was used. For PT vs. CTC: (p = 0.0027), PT vs. Lung SM (p = 0.0002), In vitro vs. Lung EM (p = 1.00), and Lung SM vs. Lung EM (p = 0.0011) a two-tailed Kruskal-Wallis test with Dunn’s multiple comparisons adjustment was used. **p < 0.01. ***p < 0.001. ns = not significant. Source data are provided as a Source Data file.
Fig. 5
Fig. 5. Spontaneously metastasizing tumor cells are more frequently doubly positive for dormancy and stem-like markers compared to intravenously injected tumor cells.
a Representative images of triple immunofluorescence staining for GFP, NR2F1, and SOX9 expression in primary tumors, circulating tumor cells (CTCs), and disseminated tumor cells (Lung) from an E0771-GFP SM model (Left) and in disseminated tumor cells (Lung) from an EM model (Right). Green = GFP; Red = NR2F1; Orange = SOX9; Blue = DAPI. Scale bar for Primary Tumor = 50 μm. Scale bar for CTCs and Lung = 15 μm. b Percentage of double-positive tumor cells NR2F1-positive SOX9High from each group in Fig. 5a. Primary Tumor: n = 2383 in 97 fields of view (65 × 65 µm2) in 7 animals; CTCs: n = 379 cells in 8 animals; SM Lung: n = 104 cells in 9 animals; In vitro: n = 413 cells in 3 independent experiments. EM Lung: n = 75 cells in 7 animals. Bar = mean. Error bars = ±SEM. For EM Lung vs. SM Lung (p = 0.0001) and EM Lung vs. in vitro (p = 0.69), a two-tailed Kruskal-Wallis test with Dunn’s multiple comparisons adjustment was used. For PT vs. CTC: (p = 0.0041), PT vs. Lung SM (p = 0.0030), and CTC vs. Lung SM (p = 1.00) a two-tailed ANOVA test with Sidak’s multiple comparisons adjustment was used. **p < 0.01. ***p < 0.001. ns = not significant. Source data are provided as a Source Data file.
Fig. 6
Fig. 6. Dormant tumor cells are preferentially associated with TMEM doorways in the primary tumor.
a Left: Representative image of triple immunohistochemical stain in E0771-GFP primary tumor for the cells composing TMEM doorway positioned at vertices of yellow triangle: Mena expressing tumor cells = pink; IBA-1 expressing macrophages = brown; endomucin expressing endothelial cells = blue. Red dashed circle encompasses the perimeter of TMEM doorway. Scale bar = 60 µm. Insets are zoom-in of boxed region (first panel on left). Other insets show color deconvolutions for each of the stains (Mena, Endomucin, IBA-1). TTC = TMEM Doorway Tumor Cell. EC = Endothelial Cell. Mϕ = Macrophage. Scale bar = 15 µm. Right Sequential slide of tissue in Left panel, immunofluorescently stained for NR2F1 expressing tumor cells: GFP = green; NR2F1 = red; DAPI = blue. Red dashed circle encompasses the perimeter of TMEM doorway. Vertices of the orange triangles point to each constitutive cell. Red arrow points to NR2F1-positive cells. b Quantification showing the frequency of distances between NR2F1 positive tumor cells (red dots) or NR2F1 and MenaINV double-positive tumor cells (blue dots) to the nearest TMEM doorway in the primary tumor. Data is normalized to the frequency of distances between all DAPI positive nuclei to the nearest TMEM doorway. Bar = mean. Error bars = ±SEM. n = 10 1–3 mm2 regions of interest area in four mice for NR2F1, and n = eight 1–3 mm2 regions of interest area in 4 mice for NR2F1 and MenaINV. For comparison between the 0 and 200 µm bins, a two-tailed unpaired t-test was used (MenaINV+: p = 0.0004; NR2F1+MenaINV+: p = 0.029). *p < 0.05. ***p < 0.001. c Quantification showing the frequency of distances between NR2F1+ tumor cells or NR2F1+ (red dots) and MenaINV+ tumor cells (blue dots) to the nearest blood vessel lacking TMEM in the primary tumor. Data is normalized to the frequency of distances between all DAPI positive nuclei to the nearest blood vessel lacking TMEM. Bar = mean. Error bars = ±SEM. n = nine 1–3 mm2 regions of interest area in four mice for NR2F1, and n = eight 1–3 mm2 regions of interest area in fourmice for NR2F1 and MenaINV. Source data are provided as a Source Data file.
Fig. 7
Fig. 7. Macrophages regulate dormancy in tumor cells.
a Representative image of triple immunofluorescently stained in E0771-GFP primary tumor tissue for tumor cells, macrophages, and NR2F1. Green = GFP; Red = NR2F1; White = IBA-1; Blue = DAPI. White arrow shows a macrophage. The yellow arrow shows the contact between an NR2F1-positive tumor cell and a macrophage. Mϕ=Macrophage. Scale bar=20 μm. b Quantification showing the frequency of distances between NR2F1+ tumor cells to the nearest macrophage in the primary tumor. Data is normalized to the frequency of distances between all DAPI+ nuclei to the nearest TMEM. Bar = mean. Error bars = ±SEM. n = 34 fields of view (551 × 316 µm2) in 4 animals. For comparison between the 0 and 200 µm bins a two-tailed Mann-Whitney test was used (p < 0.0001). ****p < 0.0001. c Representative immunofluorescence images of NR2F1 expression in E0771-GFP tumor cells cultured alone, in direct contact with BAC1.2F5 macrophages, or in direct contact with HUVEC endothelial cells. White arrows show macrophages or endothelial cells in direct contact with a tumor cell. Green = GFP; Red = NR2F1; Blue = DAPI. TC = Tumor Cell. Mϕ = Macrophage. EC = Endothelial Cell. Scale bar = 15 μm. d Percentage of NR2F1-positive tumor cells from each group in C. TC alone: n = 777 cells in 9 independent experiments; TC+Mϕ; n = 226 cells in 6 independent experiments, TC+EC = n = 359 cells in 4 independent experiments. Bar = mean. Error bars = ±SEM. For TC vs. TC+Mϕ (p = 0.0039), and for TC vs. TC+EC (p = 1), a two-tailed Kruskal-Wallis test with Dunn’s multiple comparisons adjustment was used. For TC+Mϕ vs. TC+EC (0.012), a two-tailed one-way ANOVA with Sidak’s multiple comparison adjustment was used. *p < 0.05. **p < 0.01; ns = not significant. Source data are provided as a Source Data file.
Fig. 8
Fig. 8. Macrophage depletion reduces dormancy in primary tumors, CTCs, and disseminating tumor cells in vivo.
a Representative immunofluorescence images of E0771-GFP primary tumor tissues treated with either control liposomes or clodronate liposomes and stained for macrophages: IBA-1 = White; DAPI = Blue. Scale bar for Primary Tumor = 100 μm. Mϕ = Macrophage. b Percentage of IBA-1 positive macrophages in 10 fields of view (1088 × 629 μm2) in each group from Fig. 8a. Control Liposomes: n = 60 HPFs in 6 animals. Clodronate liposomes: n = 50 HPFs in 5 animals. Bar = mean. Error bars = ±SEM. Unpaired t-test (p = 0.0087). **p < 0.01. c Representative immunofluorescence images of NR2F1 expression in primary tumors, circulating tumor cells (CTCs), and disseminated tumor cells (Lung) from an E0771-GFP SM model treated with control (Left) or clodronate liposomes (Right). Green = GFP, Red = NR2F1, Blue = DAPI. Scale bar for Primary Tumor = 50 μm. Scale bar for CTCs and Lung = 15 μm. d Percentage of NR2F1-positive tumor cells in each group from Fig. 8c. Control Liposomes - Primary Tumor: 3048 cells in 119 fields of view (65 × 65 µm2) in 8 animals; CTCs: n = 139 cells in 5 animals; Lung: n = 166 cells in 7 animals. Clodronate Liposomes - Primary Tumor: n = 2,298 cells in 79 fields of view (65 × 65 µm2) in 6 animals, CTCs: n = 293 cells in 6 animals; Lung: n = 190 cells in 7 animals. For primary tumor (p = 0.007), a Mann-Whitney test was used. For CTCs (p = 0.038) and Lungs (p = 0.0029), unpaired t-tests were used. *p < 0.05. **p < 0.01. Source data are provided as a Source Data file.
Fig. 9
Fig. 9. Model illustrating how the presence of a primary tumor programs disseminated tumor cells for stemness and dormancy at the secondary site. Left Panel: Within the primary tumor, migrating tumor cells are attracted to blood vessels.
As they approach TMEM doorways (red triangle) on the vasculature, these tumor cells interact with macrophages and programs of dormancy (NR2F1) and invasion (MenaINV) are activated. Dormant cells also adopt cancer stem cell properties (SOX9). These cells then intravasate through TMEM doorways into the vasculature and become circulating tumor cells (CTCs). Right Panel: CTCs retain these programs at the secondary site where the invasion program (MenaINV) facilitates extravasation. The dormancy program expressed by these disseminated tumor cells (DTCs) keeps them as single cells.

References

    1. Mehlen P, Puisieux A. Metastasis: a question of life or death. Nat. Rev. Cancer. 2006;6:449–458. - PubMed
    1. Lambert AW, Pattabiraman DR, Weinberg RA. Emerging Biological Principles of Metastasis. Cell. 2017;168:670–691. - PMC - PubMed
    1. Zijlstra A, et al. The importance of developing therapies targeting the biological spectrum of metastatic disease. Clin. Exp. Metastasis. 2019;36:305–309. - PMC - PubMed
    1. Levin I, Sittenfield MJ. On the Mechanism of the Formation of Metastases in Malignant Tumors: An Experimental Study. J. Exp. Med. 1911;14:148–158. - PMC - PubMed
    1. Spiegel A, et al. Neutrophils Suppress Intraluminal NK Cell-Mediated Tumor Cell Clearance and Enhance Extravasation of Disseminated Carcinoma Cells. Cancer Discov. 2016;6:630–649. - PMC - PubMed

Publication types

LinkOut - more resources