. 2022 Feb 2;12(1):1804.
doi: 10.1038/s41598-022-05256-1.

Neuropeptidergic regulation of compulsive ethanol seeking in C. elegans

Affiliations

Neuropeptidergic regulation of compulsive ethanol seeking in C. elegans

Chinnu Salim et al. Sci Rep. .

Abstract

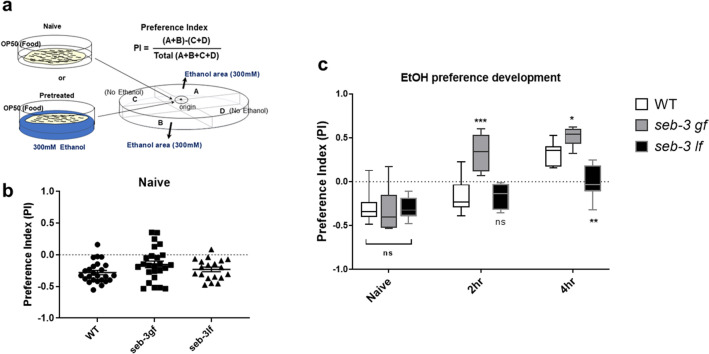
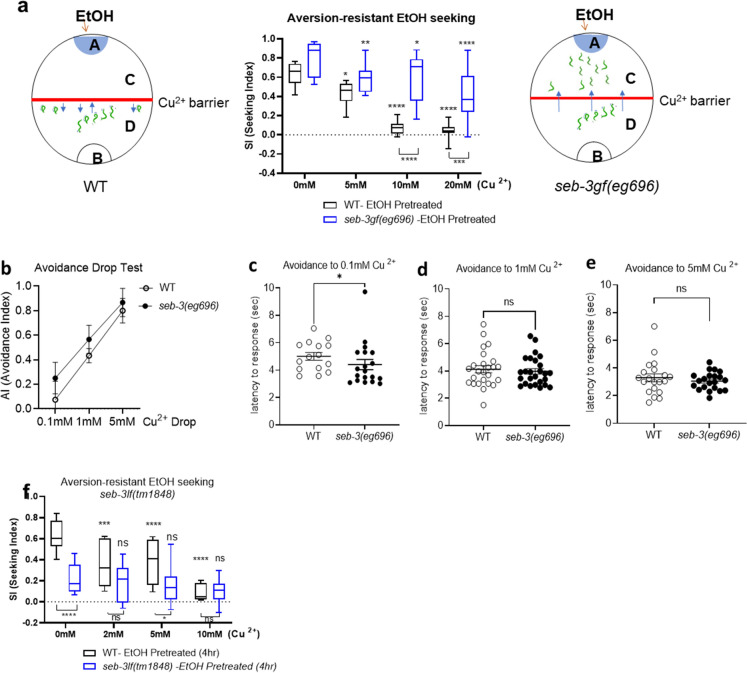
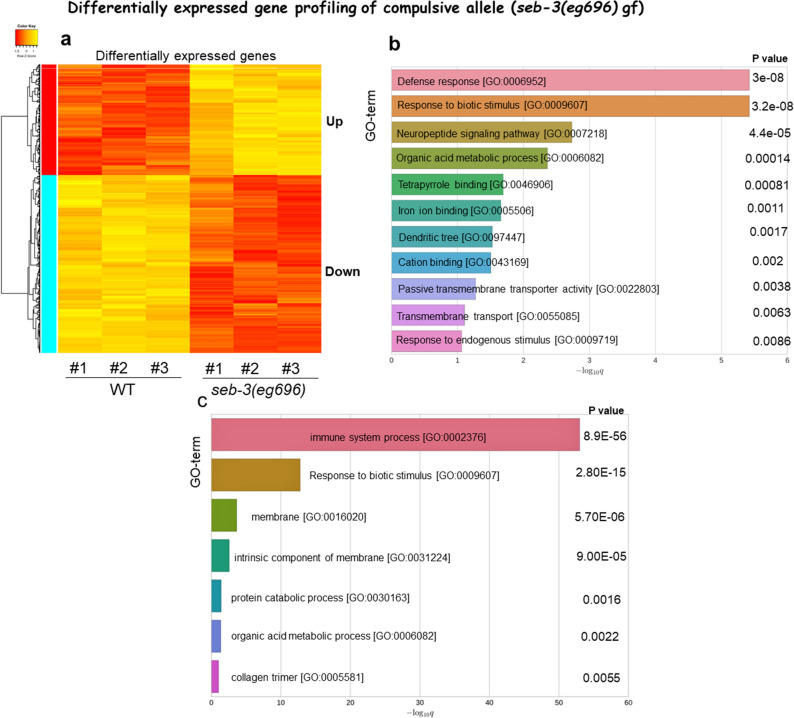
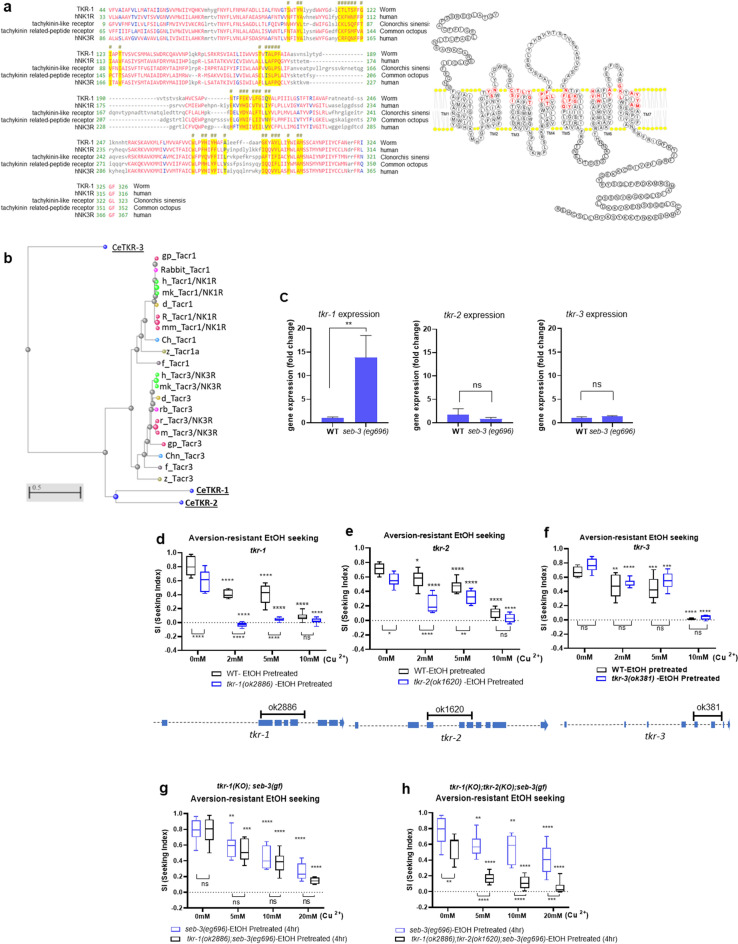
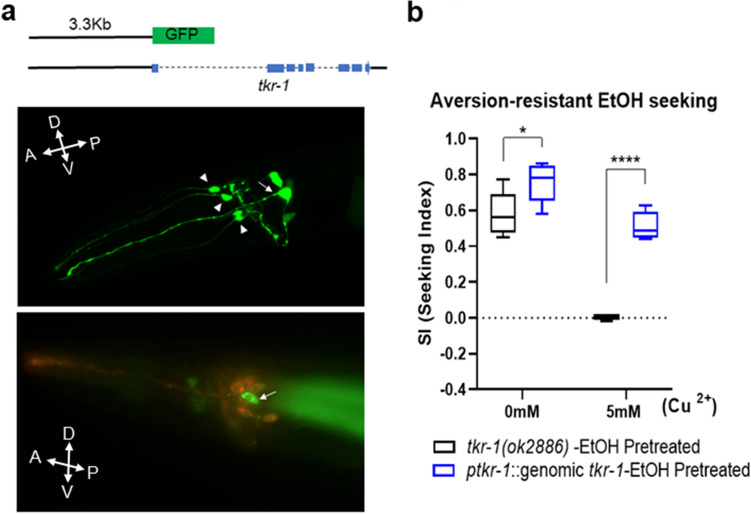
Despite the catastrophic consequences of alcohol abuse, alcohol use disorders (AUD) and comorbidities continue to strain the healthcare system, largely due to the effects of alcohol-seeking behavior. An improved understanding of the molecular basis of alcohol seeking will lead to enriched treatments for these disorders. Compulsive alcohol seeking is characterized by an imbalance between the superior drive to consume alcohol and the disruption or erosion in control of alcohol use. To model the development of compulsive engagement in alcohol seeking, we simultaneously exploited two distinct and conflicting Caenorhabditis elegans behavioral programs, ethanol preference and avoidance of aversive stimulus. We demonstrate that the C. elegans model recapitulated the pivotal features of compulsive alcohol seeking in mammals, specifically repeated attempts, endurance, and finally aversion-resistant alcohol seeking. We found that neuropeptide signaling via SEB-3, a CRF receptor-like GPCR, facilitates the development of ethanol preference and compels animals to seek ethanol compulsively. Furthermore, our functional genomic approach and behavioral elucidation suggest that the SEB-3 regulates another neuropeptidergic signaling, the neurokinin receptor orthologue TKR-1, to facilitate compulsive ethanol-seeking behavior.


Conflict of interest statement

The authors declare no competing interests.

Figures

Figure 1
Figure 1
Ethanol-pretreated WT animals headed straight to the ethanol area and remained stayed. (a,b) Trajectory of individual WT animal (Naïve or Ethanol pretreated). The naïve (a) or ethanol pretreated animals (b), respectively, were placed in the middle of assay plate that contains ethanol (300 mM) only in the left top well. All wells are marginally covered by media that allows free moving between the area. Ethanol-pretreated WT animals (4 h; 300 mM) headed straight to ethanol area and stayed, whereas naïve wild type animals explored around. The arrow indicates initial points, where a worm was placed, and the trajectory represents the locomotion analysis for 30 min. During the short process of preparing for recording after placing, naïve animals explore near the initial point thus, the tracking path starts from the vicinity of the initial point, whereas the ethanol-treated animals have already moved toward the ethanol area consequently, the beginning of the tracking path is away from the initial point. Additional trajectories for individual animals were shown in Sup. 1. Scale bar = 10 mm. (c,e) Behavioral quantification of individual animal (c; Naïve, d; 4 h-Ethanol pretreated) and average of total percentage time spent in the distinct area (e). The ethanol pretreated animals spent more time in ethanol area. The data were analyzed employing Chi-square test. chi-square test indicated; df 60.67, 1 z 7.789, ****p < 0.0001.
Figure 2
Figure 2
Ethanol pretreated animal is not defective in the locomotion. The locomotion trajectories of naïve (a) or ethanol-pretreated (b) animals on non-ethanol plate (with food, OP50) for 15 min are shown. (c) The stimulation of locomotion, increase of speed and travel distance, was observed in ethanol pretreated WT animals.
Figure 3
Figure 3
Behavioral quantification of compulsive ethanol seeking after exposure to ethanol against aversive chemical barrier. (a) Diagrammatic representation exhibited experimental design to quantify aversion-resistant ethanol seeking. The different concentrations of Cu2+ created aversive barrier without mechanical obstacles to quantify the motivational strength of seeking ethanol behavior in animals. (b) Cu2+ sensitivity of WT animals are not altered after ethanol exposure. (c) EtOH pretreated animals demonstrates more animals cross over the Cu barrier for ethanol (aversion-resistant seeking), in low concentration (2 and 5 mM), than does Naïve animals [FEtOH pretreated(1, 18) = 46.44, p < 0.0001; FConcentration(4,72) = 99.01, p < 0.0001; F pretreated×Concentration(4, 72) = 11.57, p < 0.001]. Moving to higher concentration of copper (10 mM), ethanol pretreated WT animals failed to overcome the aversive barrier. A two-way ANOVA comparison of the animal status over concentrations of barrier showed significant differences based on EtOH pretreated, concentrations, and the interaction of the two. Significant post hoc differences (Bonferroni’s test) between naïve and EtOH pretreated animals at no barrier, 2 mM, 5 mM, and 10 mM is shown. Comparison with 0 mM is also shown (p < 0.0001,****). Values are mean ± SEM. N = 10 in each conc. (d) EtOH pretreated animals demonstrates more animals cross over the Denatonium barrier for ethanol (aversion-resistant seeking), in low concentration, than does Naïve animals [FEtOH pretreated(1, 6) = 598.8, p < 0.0001; FConcentration(1.712, 10.27) = 119, p < 0.0001; F pretreated×Concentration(2, 12) = 45.81, p < 0.0001]. A two-way ANOVA comparison of the animal status over concentrations of barrier showed significant differences based on EtOH pretreated, concentrations, and the interaction of the two. Significant post hoc differences (Bonferroni’s test) between naïve and EtOH pretreated animals at no barrier, 5 mM, and 10 mM is shown (p < 0.01, **). Comparison between genotype is also shown (p < 0.0001, ****). Values are mean ± SEM. N = 4 in each conc.
Figure 4
Figure 4
SEB-3 facilitates the development of ethanol preference. (a) Diagrammatic representation of ethanol preference assay. Naïve or ethanol pretreated animals remain free to explore on the quadrants plate before counting. (b) Naïve animals accumulate primarily in the non-ethanol region. One-way ANOVA, p > 0.05, F (2, 66) = 2.539, ns compared to WT in post hoc multiple comparison test; Dunnett’s. (c) Ethanol preference developed more rapidly and greater in seb-3gf animals, whereas impaired in seb-3lf animals. [Fgenotype(2, 27) = 15.76, p < 0.0001; Ftime(1.871, 37.42) = 72.56, p < 0.0001; FGenotype × time(4, 40) = 9.982, p < 0.001]. A two-way ANOVA comparison showed significant differences based on genotype, time, and the interaction of the two. Significant post hoc differences (Bonferroni’s multiple comparison test) between the genotypes (WT vs. seb-3gf) or (WT vs. seb-3if) at naïve, 2 h, and 4 h are shown (p < 0.05,*; p < 0.01,**; p < 0.0001,****).
Figure 5
Figure 5
The ethanol pretreated seb-3gf animals for 4 h surmount a stronger aversive barrier to seek ethanol. (a) Strength of ethanol seeking is represented by the SI under different concentration of copper barrier (no barrier, 10 mM and 20 mM). A seb-3gf strain demonstrates more animals cross over the barrier for ethanol (aversion-resistant seeking), in overall concentrations, than does the WT strain [FGenotype(1, 18) = 35.78, p < 0.0001; FConcentration(3, 53) = 40.32, p < 0.0001; FGenotype×Concentration(3, 53) = 6.586, p < 0.001]. A two-way ANOVA comparison of the strains over concentrations of barrier showed significant differences based on genotype, concentrations, and the interaction of the two. Significant post hoc differences (Dunnett’s test) between no barrier versus 5 mM, 10 mM, or 20 mM in each genotype (WT and seb-3gf animals) is shown (p < 0.05,*; p < 0.01,**; p < 0.0001, ****). Comparison between genotype is also shown (p < 0.001,***; p < 0.0001, ****). Box and whisker represent minimum to maximum of 10 trials of population assay (N = 10). (be) Avoidance assay with drop test (0.1 mM, 1 mM, and 5 mM CuSO4). The avoidance index (AI) in (b) is the number of positive responses divided by the total number of trials. The latency to stop forward and initiate backward movement was measured. Data were obtained from 10 or more animals and mean values from 3 or more trials were analyzed by one-way ANOVA with a post-hoc Dunnett’s test; non-significant differences [p = 0.0820, Fgenotypes(1, 7) = 4.117, p = 0.7705; Fconcentration×geneotype(2, 7) = 0.2707] (b) or two-tailed t-test; p < 0.05, * (ce). (f) The development of aversion-resistant ethanol seeking is impaired in seb-3lf animals. A two-way ANOVA comparison [FGenotype(1, 17) = 24.64, p < 0.0001; FConcentration(3, 30) = 18.35, p < 0.0001; FGenotype×Concentration(3, 40) = 6.005, p = 0.0018]. Significant post hoc differences (Dunnett’s test) between no barrier versus 2 mM, 5 mM, or 10 mM in each genotype (p < 0.001,***; p < 0.0001,****). Comparison between genotype is also shown (p < 0.05,*; p < 0.0001,****).
Figure 6
Figure 6
Differentially expressed gene profiling of genetic variant vulnerable to compulsive seeking behavior. (a) Altered expression of transcripts in seb-3gf. Gene Ontology (GO) enrichment analysis revealed 11 GO terms that upregulated genes are enriched (b) and 7GO terms of downregulated genes (c).
Figure 7
Figure 7
Neurokinin receptors in C. elegans. (a) Sequence alignment of TKR-1 (NP_499064.2), humanTACR1/NK1R (2KS9_A), humanTACR3/NK3R (P29371), and tachykinin-like receptors of liver fluke (GAA51416) and octopus (BAD93354.1) revealed the consensus sequences of putative ligand binding pocket of TKR-1 (Yellow highlights). Red indicates highly conserved amino acids and blue indicates lower conservation. The diagram of full-length TKR-1 topology represents transmembrane helix domains and the consensus sequences of putative peptide ligand binding pocket (Red amino acids). (b) Phylogenetic analysis of the Tachykinin/Neurokinin Receptor family (minimum evolution method). (c) Upregulation of tkr-1 in seb-3(eg696) determined by qRT-PCR (n = 3 biological replication). RNA was extracted from 10 young adult worms in each biological replication. A paired-t test show significance (p < 0.01, **). (dh) Aversion-resistant ethanol seeking assay in tkr-1(ok2886) (d), tkr-2(ok1620) (e), tkr-3(ok381) (f), tkr-1(ok2886); seb-3(eg696) double (g), and tkr-1(ok2886); tkr-2(ok1620); seb-3(eg696) triple (h). A two-way ANOVA comparison shows the impaired development in tkr-1(ok2886) [FGenotype(1, 58) = 106.6, p < 0.0001; FConcentration(3, 58) = 140.7, p < 0.0001; FGenotype×Concentration(3, 58) = 9.495, p < 0.0001]. Significant post hoc differences (Dunnett’s test) between no barrier versus 2 mM, 5 mM, or 10 mM in each genotype (p < 0.0001, ****); tkr-2(1620) [FGenotype(1, 16) = 38.37, p < 0.0001; FConcentration(3, 34) = 76.82, p < 0.0001; FGenotype×Concentration(3, 34) = 6.030, p = 0.0021], tkr-1(ok2886); seb-3(eg696) [FGenotype(1, 18) = 2.031, p = 0.1712; FConcentration(3, 36) = 64.04, p < 0.0001; FGenotype×Concentration(3, 36) = 0.5236, p = 0.6688], and tkr-1(ok2886); tkr-2(ok1620); seb-3(eg696) [FGenotype(1, 18) = 63.25, p 0.0001; FConcentration(3, 35) = 33.21, p < 0.0001; FGenotype×Concentration(3, 35) = 2.358, p = 0.0084]. Significant post hoc differences (Dunnett’s test) between no barrier versus 2 mM, 5 mM, or 10 mM in each genotype (p < 0.05,*; p < 0.0001,****). Comparison between genotype is also shown (p < 0.001,***; p < 0.0001,****).
Figure 8
Figure 8
TKR-1 is required for compulsive ethanol seeking. (a) tkr-1 is expressed in the amphid neurons such as URA or CEP (arrowhead) and Amphid sheath glial cells (AMsh, arrow). Green fluorescent protein (GFP) is translationally fused with one amino acid of TKR-1 driven by 3.3 kb of 5′ promoter region. DiI lipophilic dye visualized the head sensory neurons (ASK, ADL, ASI, AWB, ASH, and ASJ). Using this as a marker, the amphid sheath cell was identified through its shape and location. Distinct expression in the amphid neurons such as URA or CEP (arrowhead) and Amphid sheath glial cells (AMsh, arrow) was observed. Faint expression is also observed in AIY-like and ASJ-like neurons. The double-headed arrows indicate A/P, D/V polarities. (b) The genomic DNA of tkr-1 containing 3.4 kb of promoter region (a) rescue the impaired development of compulsive ethanol seeking of tkr-1(ok2886) animals. A two-way ANOVA comparison shows [FGenotype(1, 8) = 63.44, p < 0.0001; FConcentration(1, 8) = 107.4, p < 0.0001; FGenotype×Concentration(1, 8) = 17.20, p = 0.0032]. Significant post hoc differences (Dunnett’s test) between strains are represented (p = 0.0143,*; p < 0.0001,****).

Similar articles

Cited by

References

    1. Kaplan HL, Sellers EM, Hamilton C, Naranjo CA, Dorian P. Is there acute tolerance to alcohol at steady state? J. Stud. Alcohol. 1985;46:253–256. doi: 10.15288/jsa.1985.46.253. - DOI - PubMed
    1. Korpi ER, et al. Mechanisms of action and persistent neuroplasticity by drugs of abuse. Pharmacol. Rev. 2015;67:872–1004. doi: 10.1124/pr.115.010967. - DOI - PubMed
    1. Wallace MJ, et al. Acute functional tolerance to ethanol mediated by protein kinase Cepsilon. Neuropsychopharmacol. Off. Publ. Am. Coll. Neuropsychopharmacol. 2007;32:127–136. doi: 10.1038/sj.npp.1301059. - DOI - PubMed
    1. Rohsenow DJ, Monti PM. Does urge to drink predict relapse after treatment? Alcohol Res. Health. 1999;23:225–232. - PMC - PubMed
    1. Koob GF. Animal models of craving for ethanol. Addiction. 2000;95(Suppl 2):S73–81. doi: 10.1080/09652140050111663. - DOI - PubMed

Publication types

MeSH terms

Substances