. 2022 Feb 2;13(1):620.
doi: 10.1038/s41467-022-28251-6.

Engineered bacterial voltage-gated sodium channel platform for cardiac gene therapy

Affiliations

Engineered bacterial voltage-gated sodium channel platform for cardiac gene therapy

Hung X Nguyen et al. Nat Commun. .

Erratum in

Abstract

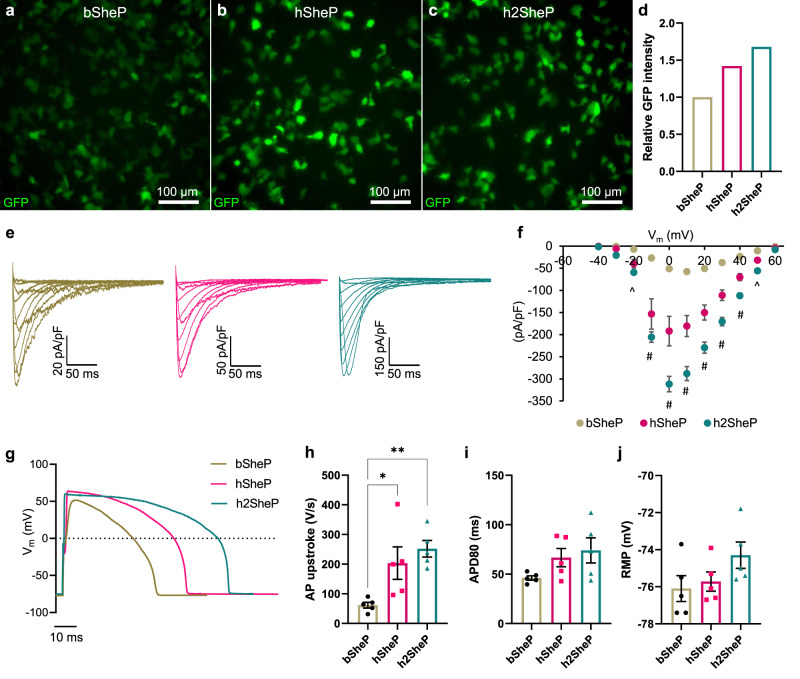
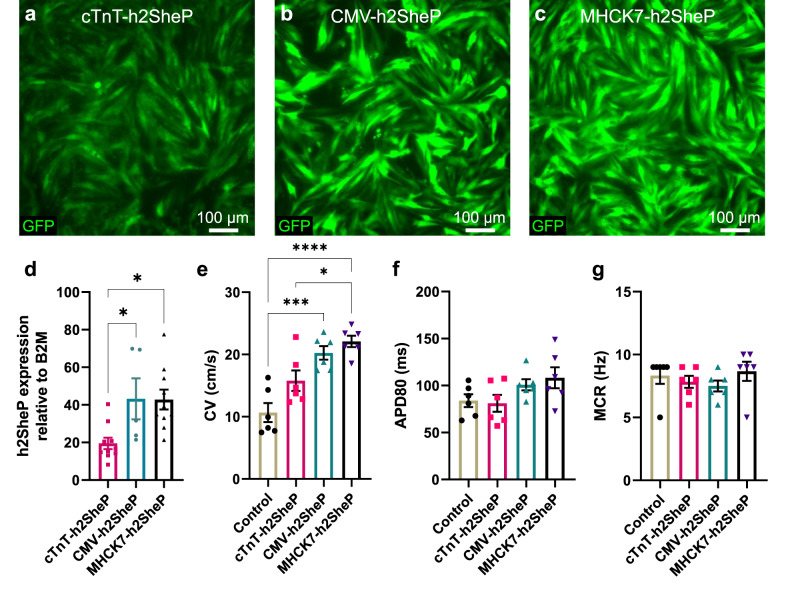
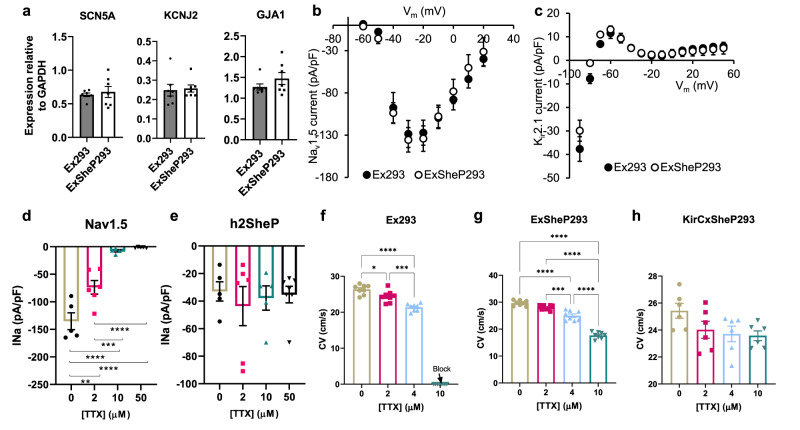
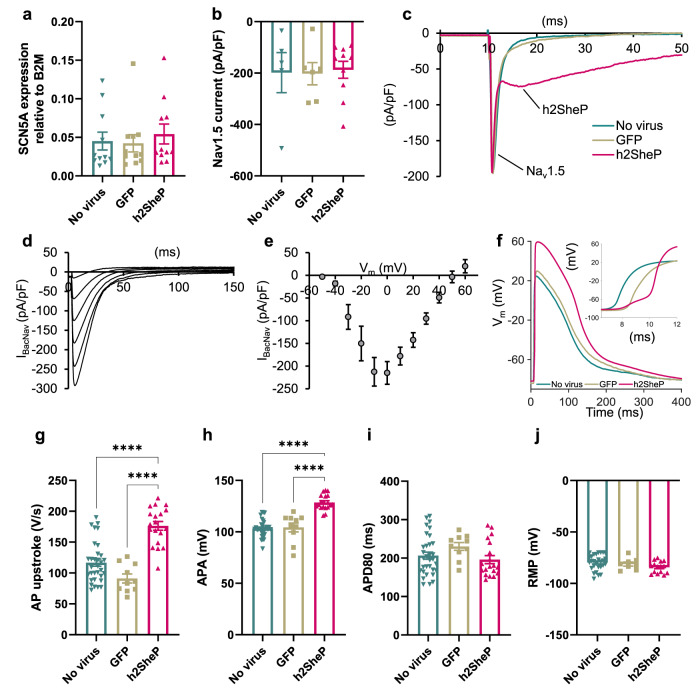
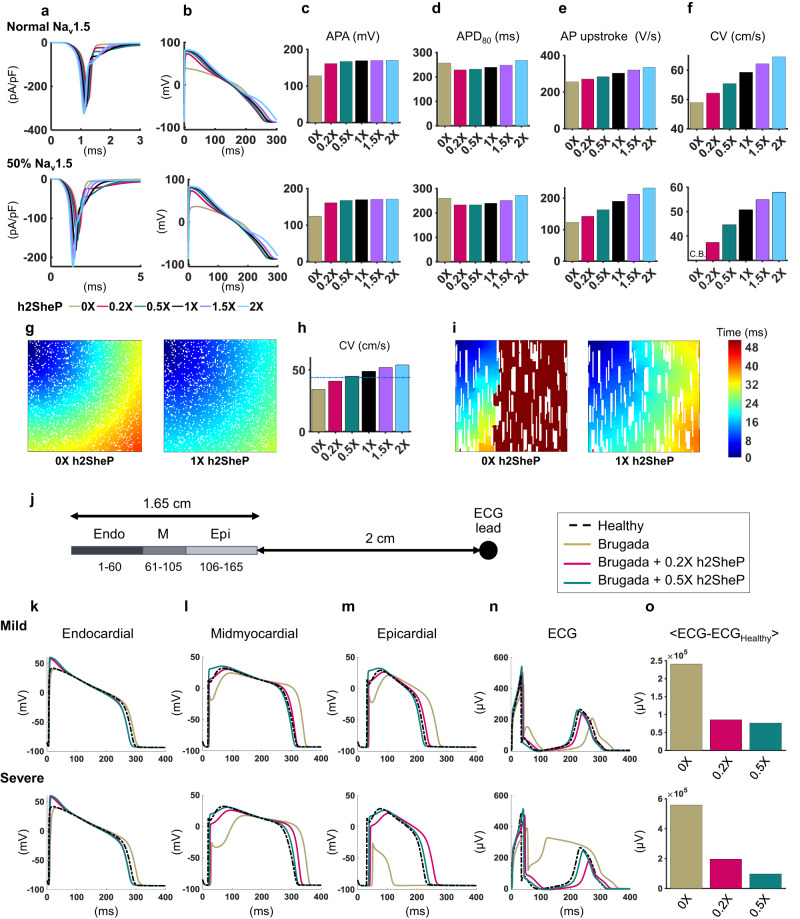
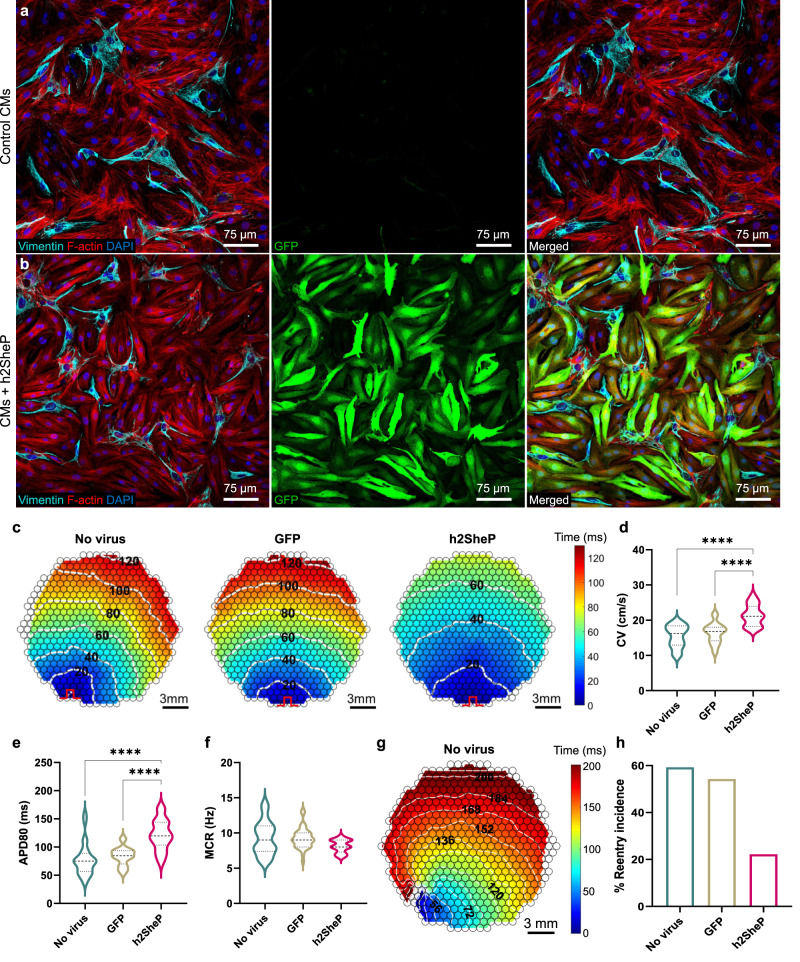
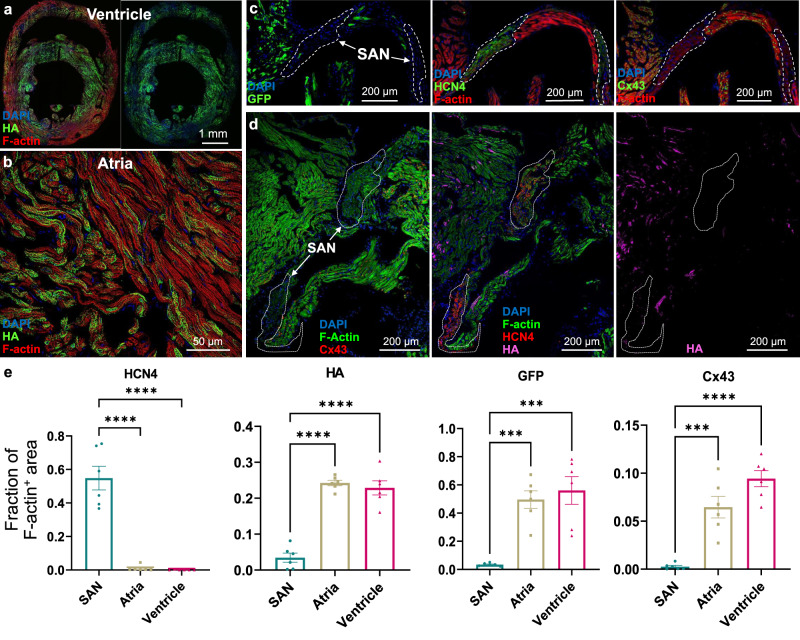
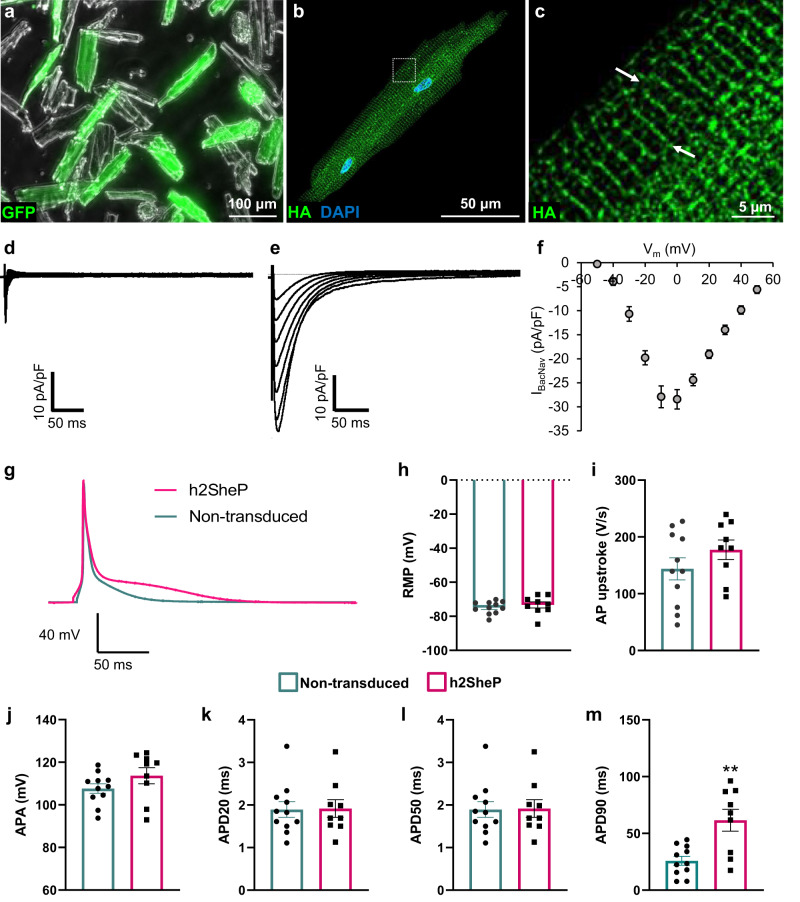
Therapies for cardiac arrhythmias could greatly benefit from approaches to enhance electrical excitability and action potential conduction in the heart by stably overexpressing mammalian voltage-gated sodium channels. However, the large size of these channels precludes their incorporation into therapeutic viral vectors. Here, we report a platform utilizing small-size, codon-optimized engineered prokaryotic sodium channels (BacNav) driven by muscle-specific promoters that significantly enhance excitability and conduction in rat and human cardiomyocytes in vitro and adult cardiac tissues from multiple species in silico. We also show that the expression of BacNav significantly reduces occurrence of conduction block and reentrant arrhythmias in fibrotic cardiac cultures. Moreover, functional BacNav channels are stably expressed in healthy mouse hearts six weeks following intravenous injection of self-complementary adeno-associated virus (scAAV) without causing any adverse effects on cardiac electrophysiology. The large diversity of prokaryotic sodium channels and experimental-computational platform reported in this study should facilitate the development and evaluation of BacNav-based gene therapies for cardiac conduction disorders.


Conflict of interest statement

H.X.N., T.W., and N.B. are inventors on a pending patent concerning application of prokaryotic sodium channels (PCT:WO2021076600A1). The remaining authors declare no competing interests.

Figures

Fig. 1
Fig. 1. Human codon optimization of BacNav gene improves expression of functional channels.
ad Representative images of HEK293 cells transduced with bicistronic lentiviruses in which GFP gene was linked via T2A peptide with non-optimized (bacterial) NavSheP D60A sequence (bSheP, a) or NavSheP D60A sequences codon-optimized using Genscript (hSheP, b) or ATUM (h2SheP, c) algorithms and corresponding quantification by flow cytometry (d). e, f Representative current traces (e) and corresponding quantifications of peak INa–V curves (f) recorded in bSheP, hSheP, or h2SheP-expressing HEK293 cells using whole-cell voltage clamp at 25 °C (n = 6). gj Representative action potential (AP) traces (g) measured via current clamp in BacNav-transduced Kir2.1-expressing HEK293 cells and corresponding quantifications of maximum upstroke velocity (h, AP upstroke; n = 5), AP duration at 80% repolarization (i, APD80; n = 5), and resting membrane potential (j, RMP; n = 5), all recorded at 37 °C. #P < 0.05 among all three groups and ^P < 0.05 for h2SheP vs. bSheP in f, exact P-values for all groups are included in Source Data. *P = 0.0403, **P = 0.0073 vs. bSheP in h. Error bars indicate s.e.m; statistical significance was determined by two-way ANOVA in f and one-way ANOVA in h, followed by Tukey’s post-hoc test to calculate P-values. Source data are provided as a Source Data file.
Fig. 2
Fig. 2. Optimization of BacNav expression in cardiomyocytes via promoter selection.
ac Representative images of NRVM monolayers transduced with h2SheP-T2A-GFP lentiviruses driven under cTnT (a), CMV (b), or MHCK7 (c) promoter. d Relative mRNA expression of the h2SheP gene normalized to housekeeping gene B2M, quantified in NRVMs transduced with specified lentiviruses (n = 5 for cTnT-h2SheP group, n = 10 for CMV- and MHCK7-h2SheP groups). *P = 0.0346, CMV-h2SheP vs. cTnT-h2SheP; *P = 0.0103, MHCK7-h2SheP vs. cTnT-h2SheP. eg Average conduction velocity (e, CV), APD80 (f), and maximum capture rate (g, MCR) values determined during optically mapped AP propagation in NRVM monolayers transduced with a CMV-GFP lentivirus (Control) or specified h2SheP lentiviruses (n = 6). *P = 0.0155, MHCK7-h2SheP vs. cTnT-h2SheP; ***P = 0.0003, CMV-h2SheP vs. Control; ****P < 0.0001, MHCK7-h2SheP vs. Control in e. Error bars indicate s.e.m; statistical significance was determined by one-way ANOVA, followed by Tukey’s post-hoc test to calculate P-values. Source data are provided as a Source Data file.
Fig. 3
Fig. 3. Effects of BacNav expression in genetically engineered HEK293 cells.
h2SheP was stably expressed in genetically engineered Ex293 line (co-expressing Nav1.5, Kir2.1, and Cx43) to create an ExSheP293 line and KirCx293 line (co-expressing Kir2.1, and Cx43) to create a KirCxSheP293 line. ac mRNA expression levels of SCN5A, KCNJ2, and GJA1 genes normalized to housekeeping gene GAPDH (a, n = 7), peak INav1.5-V (b, n = 5), or steady-state IK1-V (c, n = 5) curves in Ex293 and ExSheP293 lines showing no effect of h2SheP expression on endogenous channel expression and function. d, e Increasing concentrations of tetrodotoxin (TTX) led to significant reduction in peak Nav1.5 current in Ex293 cells (d, n = 5 for 0 and 10 µM groups, n = 6 for 2 µM group and n = 10 for 50 µM group) but not h2SheP current in KirCxSheP293 cells (e, n = 5 for 0 and 10 µM groups, n = 6 for 2 µM group and n = 10 for 50 µM group), showing differential sensitivity of mammalian and prokaryotic Na channels to TTX. All patch-clamp recordings were performed at 25 °C and peak currents of Nav1.5 and h2SheP were measured at −20 and 0 mV, respectively. **P = 0.0011, 0 µM vs. 2 µM group; ***P = 0.0005, 2 µM vs. 10 µM group; ****P < 0.0001, 0 µM vs. 10 µM, 0 µM vs. 50 µM and 2 µM vs. 50 µM groups in d. fh Increasing TTX concentrations progressively slowed AP propagation yielding conduction block at 10 μM in Ex293 (f, n = 8) but not ExSheP293 (g, n = 8) monolayers, while no CV slowing was observed in KirCxSheP293 monolayers (h, n = 6). *P = 0.0258, 0 µM vs. 2 µM group; ***P = 0.0006, 2 µM vs. 4 µM group; ****P < 0.0001, 0 µM vs. 4 µM in f. ***P = 0.0004, 2 µM vs. 4 µM group; ****P < 0.0001, 0 µM vs. 4 µM, 0 µM vs. 10 µM, 2 µM vs. 10 µM and 4 µM vs. 10 µM groups in d. Error bars indicate s.e.m; statistical significance was determined by one-way ANOVA, followed by Tukey’s post-hoc test to calculate P-values. Source data are provided as a Source Data file.
Fig. 4
Fig. 4. BacNav expression enhances cardiomyocyte excitability in vitro.
a, b Transduction of NRVMs with MHCK7-GFP (“GFP”) or MHCK7-h2SheP-2A-GFP (“h2SheP”) lentivirus did not affect mRNA expression of SCN5A gene shown normalized to B2M housekeeping gene (a, n = 11) or Nav1.5 current density (b, n = 5 for no virus group; n = 6 for GFP group; n = 10 for h2SheP group). c Representative current responses to a voltage step from −80 mV (holding) to −20 mV demonstrating slower kinetics of h2SheP than Nav1.5 current. d, e Representative h2SheP current responses (d) and peak INa–V curve (e, n = 7) in NRVMs transduced with MHCK7-h2SheP lentivirus. Only traces corresponding to stepping voltages at 0–50 mV are shown in d. fj Representative AP traces measured via intracellular recording with inset showing AP upstrokes and corresponding quantifications of maximum AP upstroke velocity (g), APA (h), APD80 (i), and RMP (j) in No virus (n = 32), GFP (n = 10), and h2SheP (n = 19) groups. ****P < 0.0001 versus h2SheP group in g and h. Electrophysiological recordings were performed at 25 °C in b, c and at 37 °C elsewhere. Error bars indicate s.e.m; statistical significance was determined by one-way ANOVA, followed by Tukey’s post-hoc test to calculate P-values. Source data are provided as a Source Data file.
Fig. 5
Fig. 5. BacNav improves conduction in simulated adult human ventricular tissues and in a model of Brugada syndrome.
a Combined sodium current (from Nav1.5 and added h2SheP) shown during simulated adult human ventricular myocyte AP for normal (top) and reduced (bottom, 50% of normal Nav1.5 current) excitability. Each trace represents a different h2SheP conductance value utilized for the simulation, with 1X representing h2SheP level that produces the same peak current as endogenous Nav1.5 during voltage-clamp simulation. bf Corresponding action potential traces generated with different h2SheP expression levels (b) and quantified AP amplitude (APA, c), duration (APD80, d), and maximum upstroke velocity (e) modeled in single cells, as well as conduction velocities (CVs) during AP propagation modeled in 1D cables (f). Note conduction block (C.B.) in 1D cable with reduced excitability in f that is rescued with adding h2SheP. g, h Isochrone activation maps showing AP conduction in a simulated 1 × 1 cm heterogeneous human ventricular tissue with 15% of the total area (1500 total cells shown in white) being randomly disconnected from the rest of the tissue to model nonconducting obstacles akin to tissue fibrosis and quantified CVs for different levels of added h2SheP (h). The obstacle-induced conduction slowing was recovered by the addition of h2SheP (see also Supplementary Movie 1). i Activation maps showing AP conduction block without h2SheP (left) and rescued conduction in the presence of 1× h2SheP (right) in a simulated 1 × 1 cm heterogeneous human ventricular tissue with 20% area consisting of nonconducting vertical anisotropic obstacles (shown in white; see also Supplementary Movie 2). In tissue simulations in g, i, AP conduction was initiated from the top-left tissue corner, with the color bar scale on the far right applying to all activation maps. j Schematics describing simulated transmural ventricular AP conduction (60 endocardial, 45 midmyocardial, and 60 epicardial cells; initiated at the endocardial end) and the location of ECG measurement 2 cm from the epicardial surface. ko Simulated AP traces (endocardial, k; midmyocardial, l; epicardial, m), ECG traces (n), and corresponding deviations from healthy ECG (o) shown for healthy (dashed line) and mild and severe Brugada cases not treated (0×) or treated with h2SheP at 0.2× or 0.5× expression level.
Fig. 6
Fig. 6. BacNav expression improves conduction and prevents reentrant activity in fibrotic cardiomyocyte cultures.
a, b Representative immunostaining images of monolayers containing fibroblasts and NRVMs labelled by vimentin and F-actin, respectively, exhibiting robust cardiac-specific GFP expression in the MHCK7-h2SheP-2A-GFP-transduced group (b) but not in the nontransduced control (a). c Representative isochrone activation maps of AP propagation in nontransduced NRVM monolayers (“No virus”) and monolayers transduced with MHCK7-GFP (“GFP”) or MHCK7-h2SheP-2A-GFP (“h2SheP”) lentivirus. df Monolayers transduced with h2SheP lentivirus (n = 18) exhibit improved CV (d), longer APD80 (e), and similar MCR (f) compared to nontransduced (n = 26) or GFP-transduced (n = 31) monolayers. ****P < 0.0001 in d, e. g Representative isochrone activation map showing reentrant arrhythmia induced by rapid point pacing in a nontransduced monolayer (see also Supplementary Movie 3). In c, g pulse signs indicate location of pacing electrode and circles denote 504 recording sites. h Transduction with h2SheP lentivirus significantly reduced the rate of reentry incidence (fraction of monolayers with induced reentry) compared to nontransduced and GFP-transduced control groups. Error bars indicate s.e.m; statistical significance was determined by one-way ANOVA, followed by Tukey’s post-hoc test to calculate P-values. Source data are provided as a Source Data file.
Fig. 7
Fig. 7. Intravenous AAV-mediated delivery of BacNav results in robust transgene expression in ventricles and atria, but not the SAN of the adult mouse heart.
a, b Representative images of transverse ventricular (a) and atrial (b) sections of the mouse heart six weeks after tail-vein injection of 1 × 1012 vg of scAAV9-MHCK7-h2SheP-HA showing robust BacNav expression in cardiomyocytes. c, d Representative images of the sinoatrial node (SAN) and surrounding atria of mice injected with 1 × 1012 vg of scAAV9-MHCK7-GFP (c) or scAAV9-MHCK7-h2SheP-HA (d). The SAN areas are delineated with white dashed lines identified from the robust expression of HCN4 and absence of Cx43. Note minimal transgene expression in the SAN. e Quantified areas of HCN4+,HA+, GFP+, or Cx43+ area relative to F-actin+ area in the SAN, atrial, and ventricle (n = 6 animals, 6 sections of each tissue per animal were imaged for quantification. ****P < 0.0001; ***P = 0.0006, SAN vs. Atria in GFP groups; ***P = 0.0002, SAN vs. Ventricle in GFP groups; ***P = 0.0002, SAN vs. Ventricle in Cx43 groups). Error bars indicate s.e.m; statistical significance in e was determined by one-way ANOVA, followed by Tukey’s post-hoc test to calculate P-values. Source data are provided as a Source Data file.
Fig. 8
Fig. 8. Intravenous AAV-mediated delivery of BacNav yields expression of functional channels in mouse ventricular myocytes.
ac Representative images of dissociated cardiomyocytes (CMs) (a) from mouse ventricles four weeks after tail-vein injection with 1 × 1012 vg of AAV9-MHCK7-h2SheP-HA-2A-GFP showing expression of h2SheP-HA channels at T tubules (b, c, examples shown with white arrows). d, e Representative sodium current traces in response to voltage steps from −80 mV (holding potential) to test potentials from −50 to 50 mV recorded from nontransduced (d) and transduced, h2SheP-expressing (e) mouse ventricular myocytes four weeks after tail-vein injection of 2 × 1012 vg of AAV9-CAG-h2SheP-2A-GFP. f Corresponding peak INa–V curve for CMs transduced with h2SheP virus (n = 5). Patch-clamp recordings in df were performed in the presence of 50 μM TTX. gm Representative action potential (AP) traces recorded from nontransduced and transduced h2SheP-expressing mouse ventricular myocytes six weeks after tail-vein injection with 1 × 1012 vg of AAV9-MHCK7-h2SheP-HA-2A-GFP (g) and corresponding resting membrane potential (RMP, h), maximum upstroke velocity (AP upstroke, i), AP amplitude (APA, j), and durations (APD20, k; APD50, l; APD90, m, **P = 0.0017). n = 9 for nontransduced and n = 11 for transduced CMs. All patch-clamp recordings were performed at 25 °C. Error bars indicate s.e.m; statistical significance in m was determined by unpaired two-tailed t-test. Source data are provided as a Source Data file.

Similar articles

Cited by

References

    1. George AL., Jr Inherited disorders of voltage-gated sodium channels. J. Clin. Invest. 2005;115:1990–1999. - PMC - PubMed
    1. Janse MJ, Wit AL. Electrophysiological mechanisms of ventricular arrhythmias resulting from myocardial ischemia and infarction. Physiol. Rev. 1989;69:1049–1169. - PubMed
    1. Carmeliet E. Cardiac ionic currents and acute ischemia: from channels to arrhythmias. Physiol. Rev. 1999;79:917–1017. - PubMed
    1. Rivaud MR, et al. Sodium channel remodeling in subcellular microdomains of murine failing cardiomyocytes. J. Am. Heart Assoc. 2017;6:e007622. - PMC - PubMed
    1. Ren D, et al. A prokaryotic voltage-gated sodium channel. Science. 2001;294:2372–2375. - PubMed

Publication types

MeSH terms

Substances