. 2022 Feb;602(7897):496-502.
doi: 10.1038/s41586-021-04384-4. Epub 2022 Feb 2.

Streptococcal pyrogenic exotoxin B cleaves GSDMA and triggers pyroptosis

Affiliations

Streptococcal pyrogenic exotoxin B cleaves GSDMA and triggers pyroptosis

Wanyan Deng et al. Nature. 2022 Feb.

Erratum in

Abstract

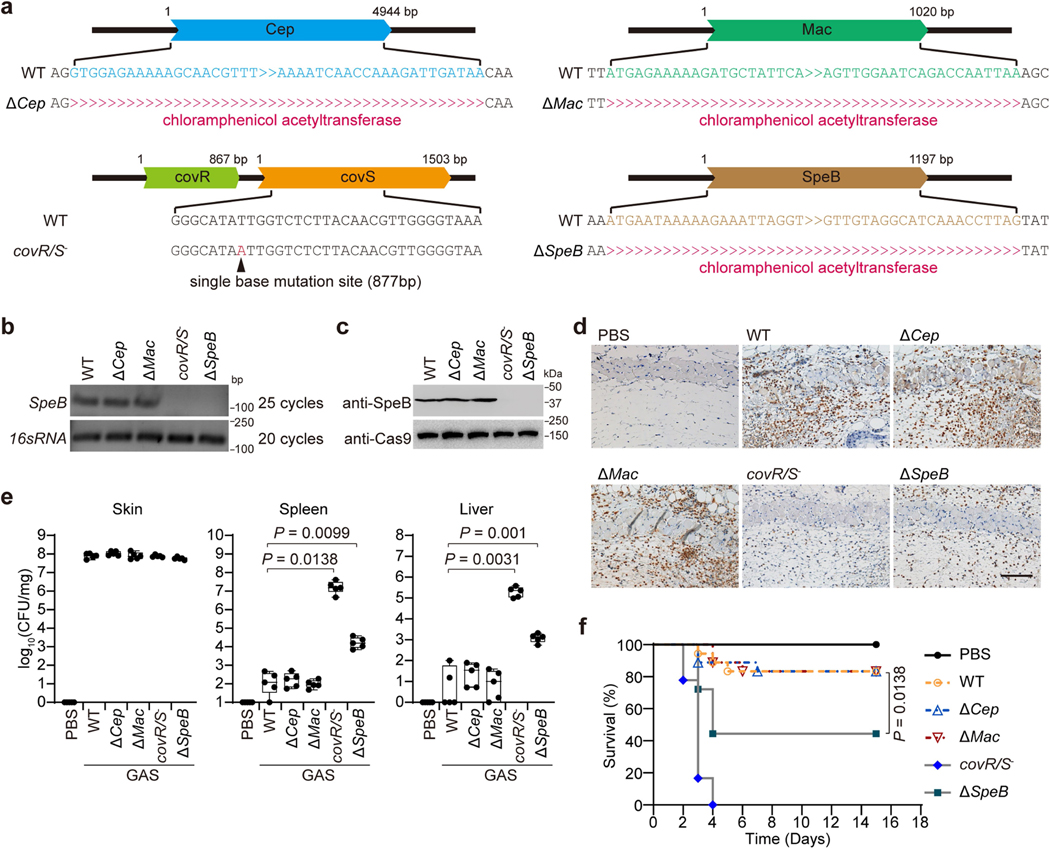
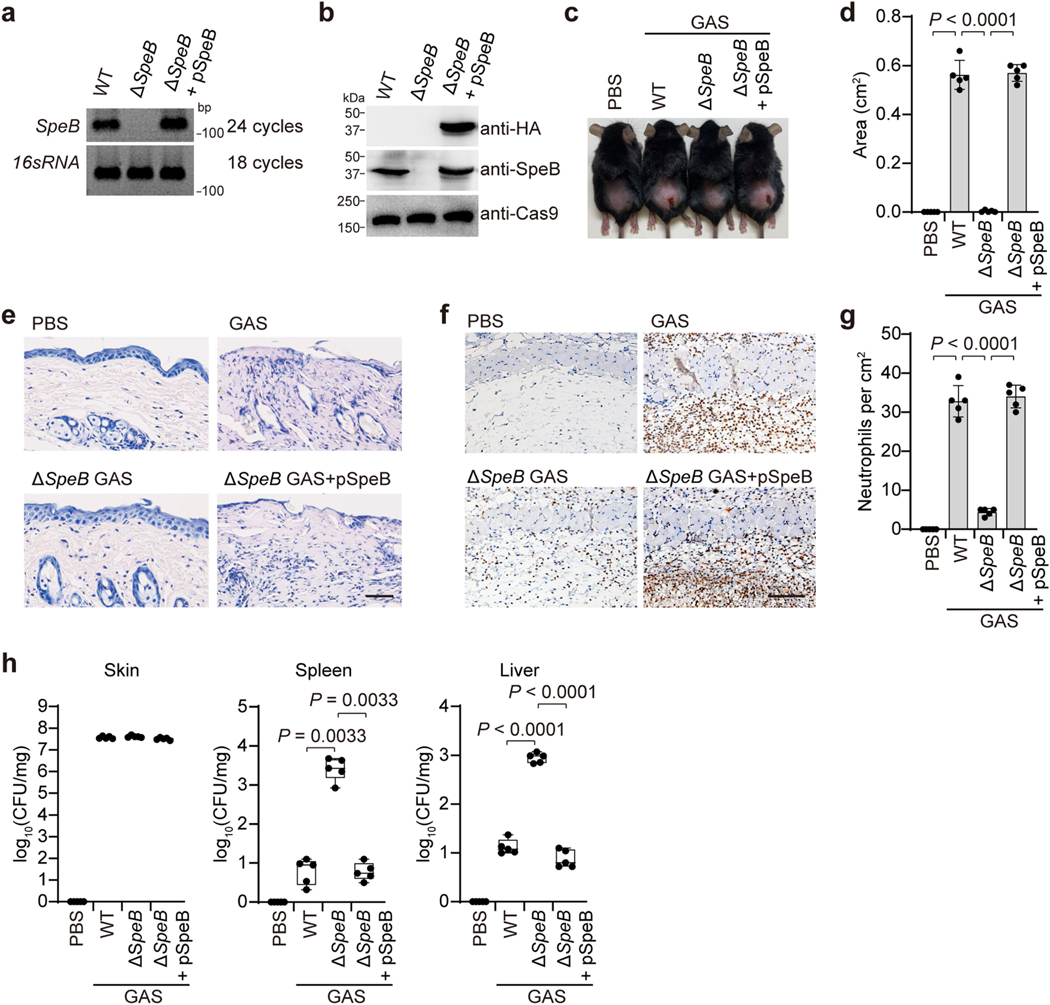
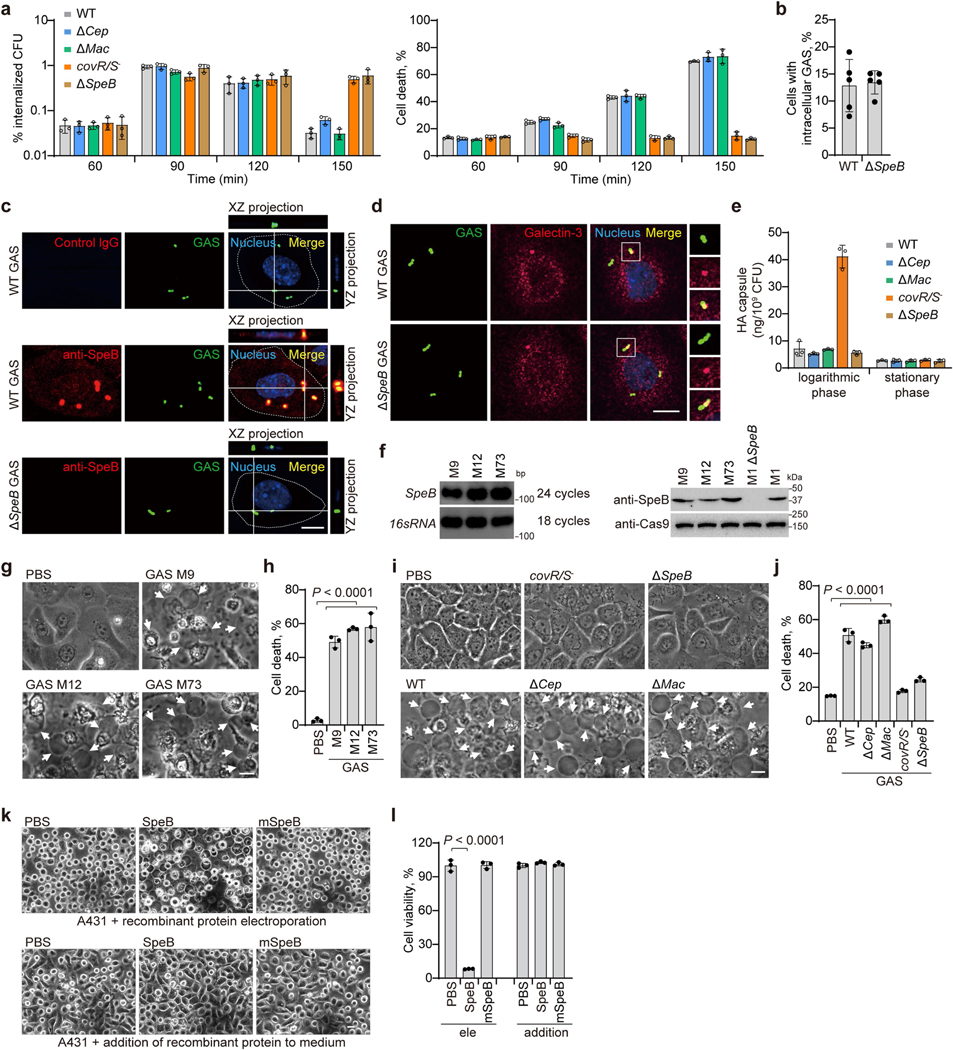
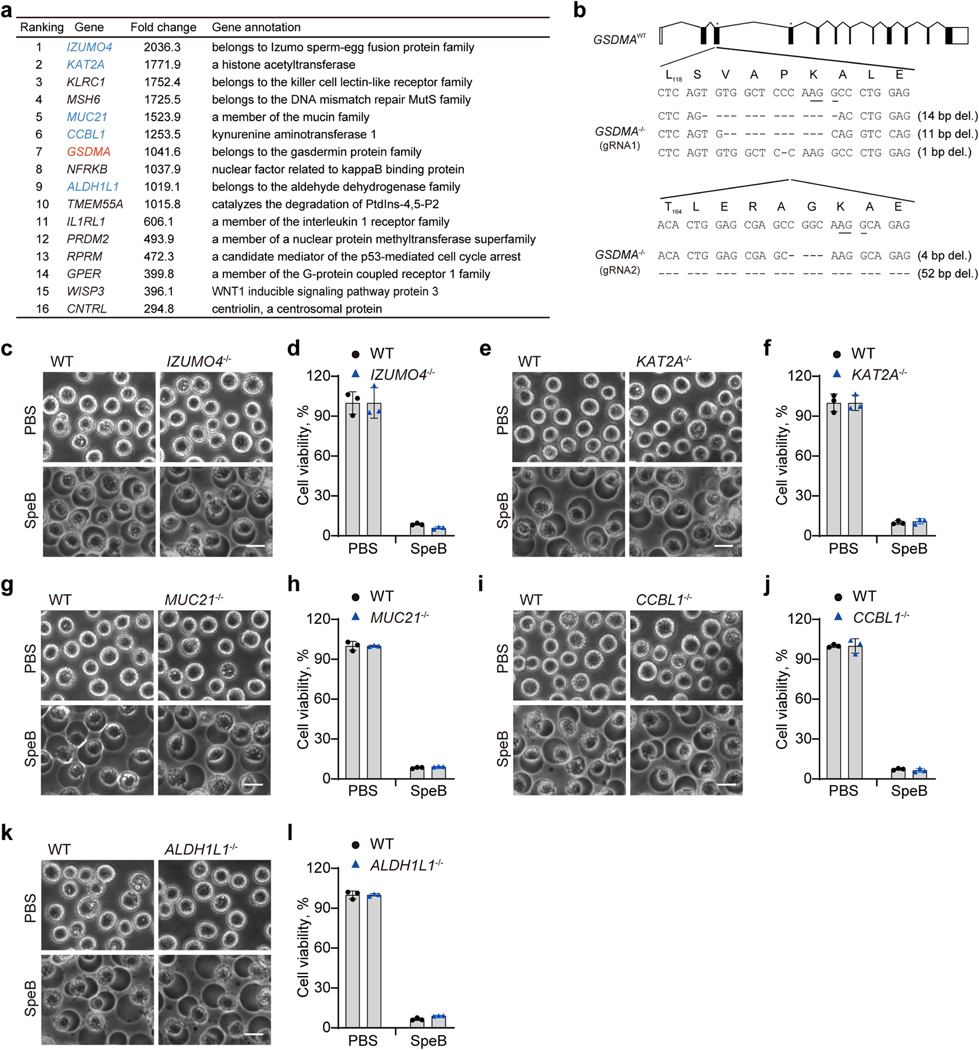
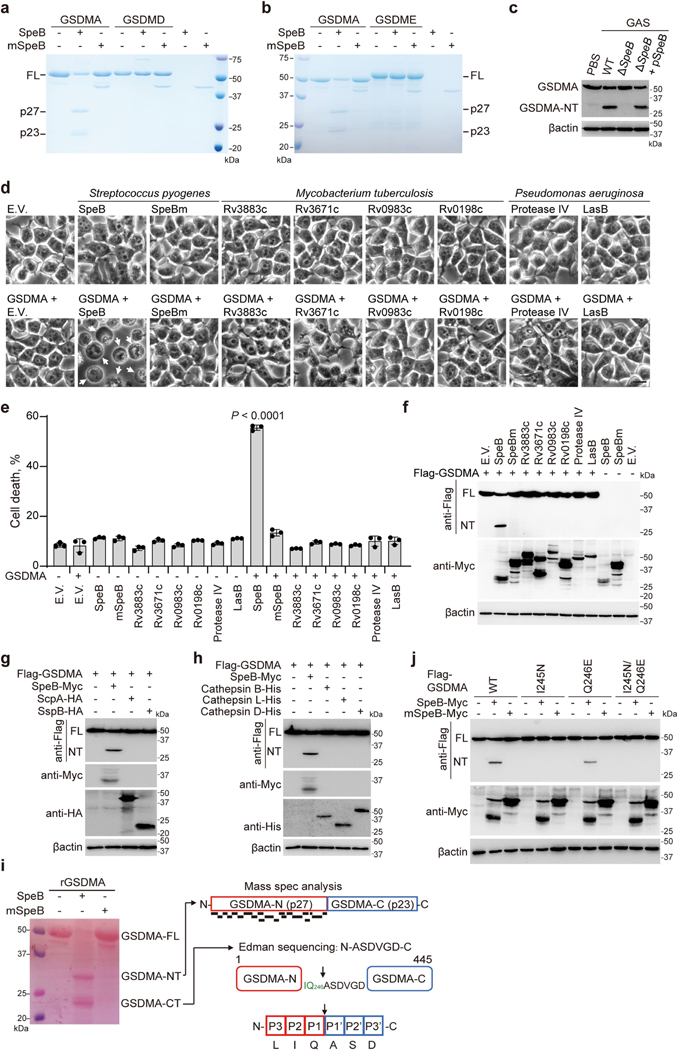
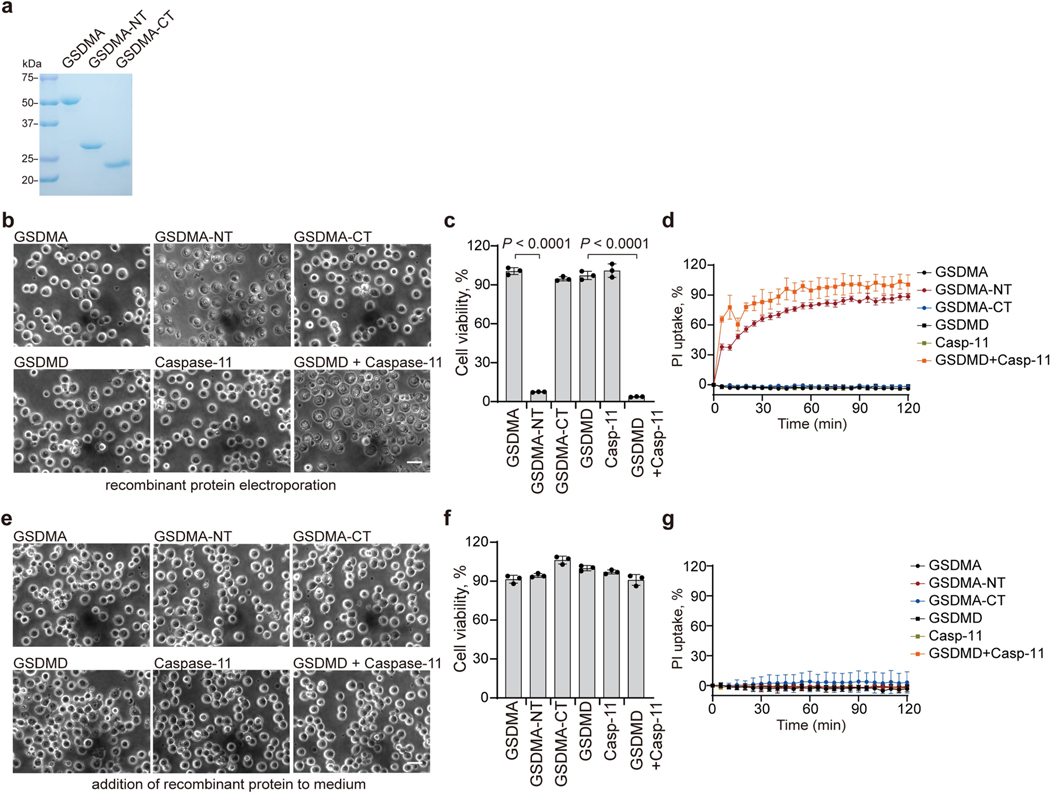
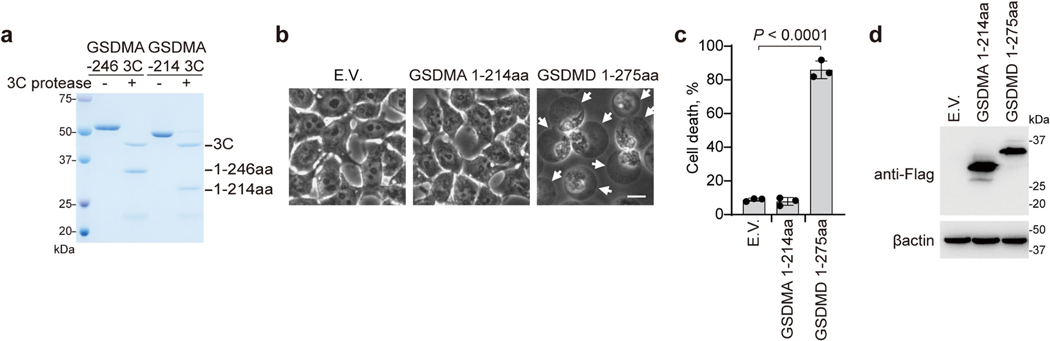
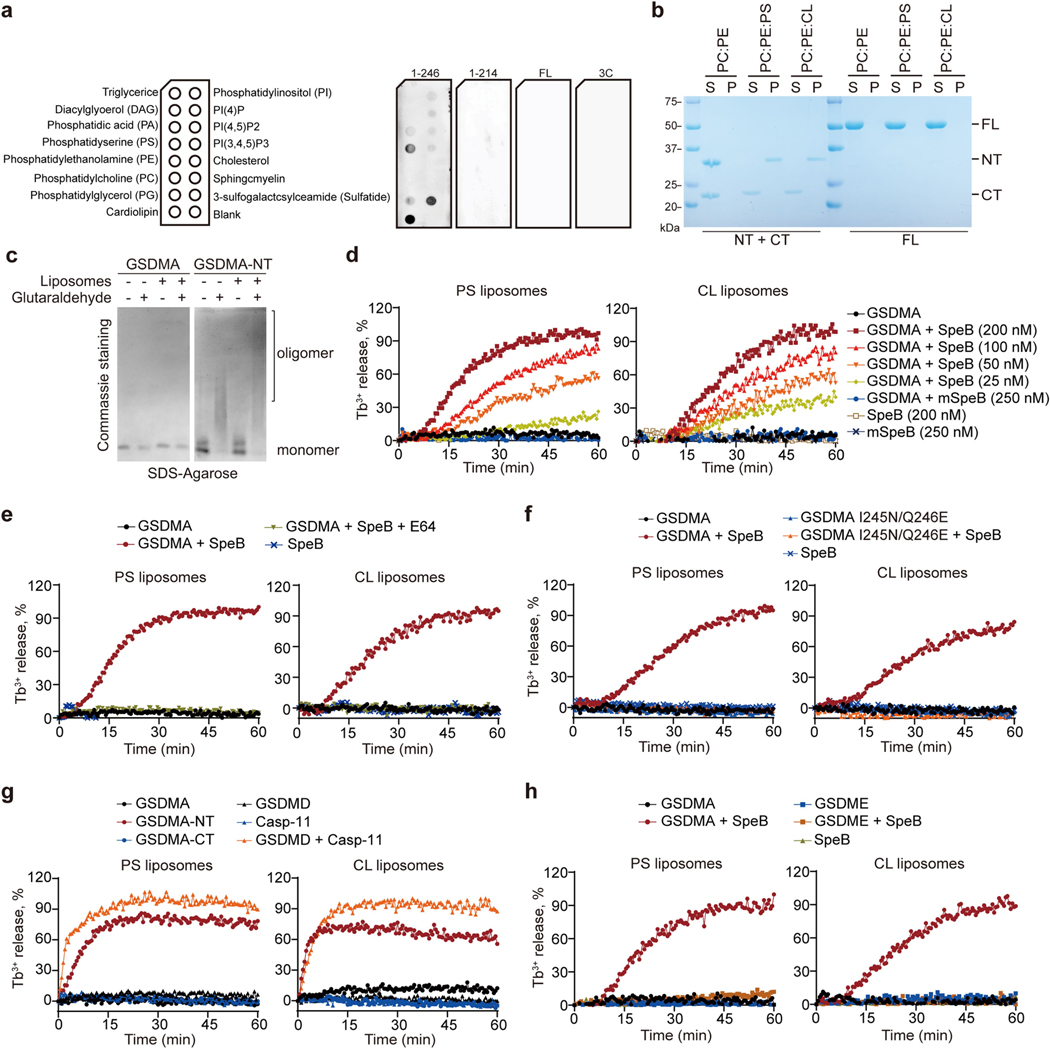
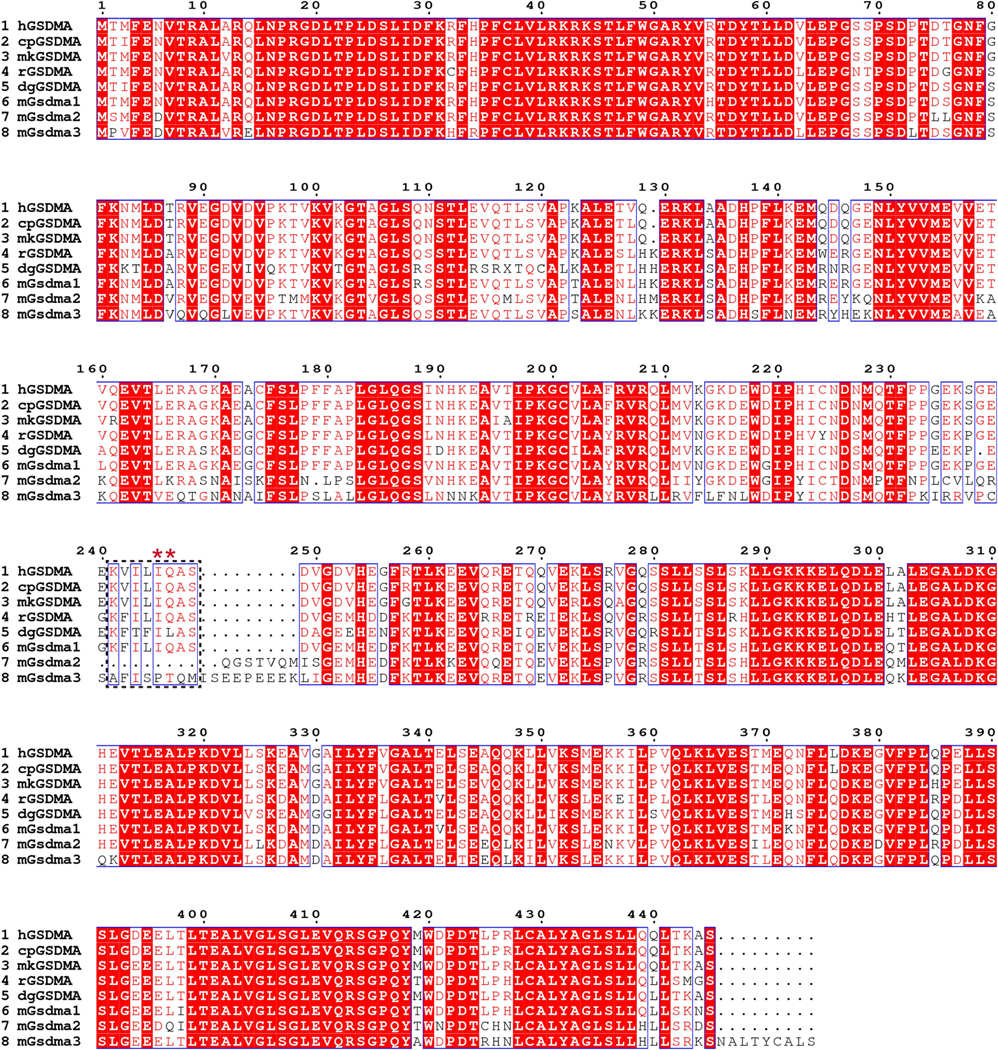
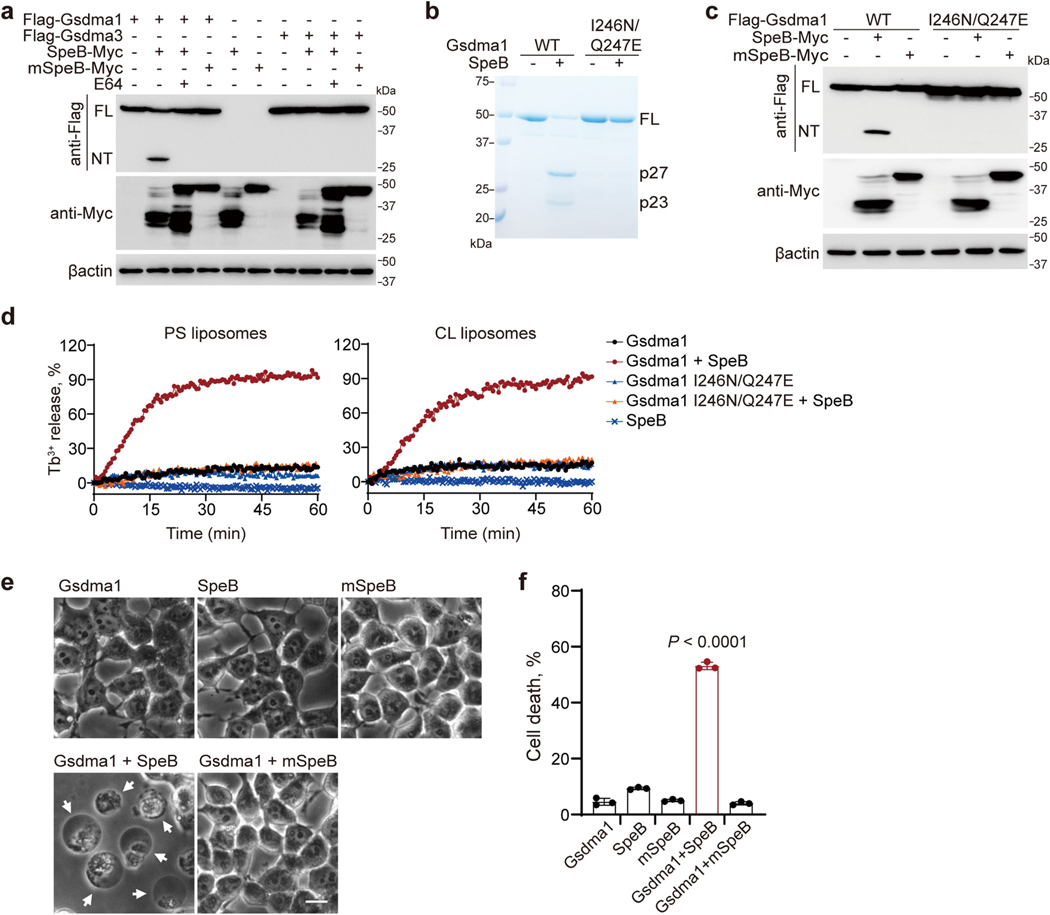
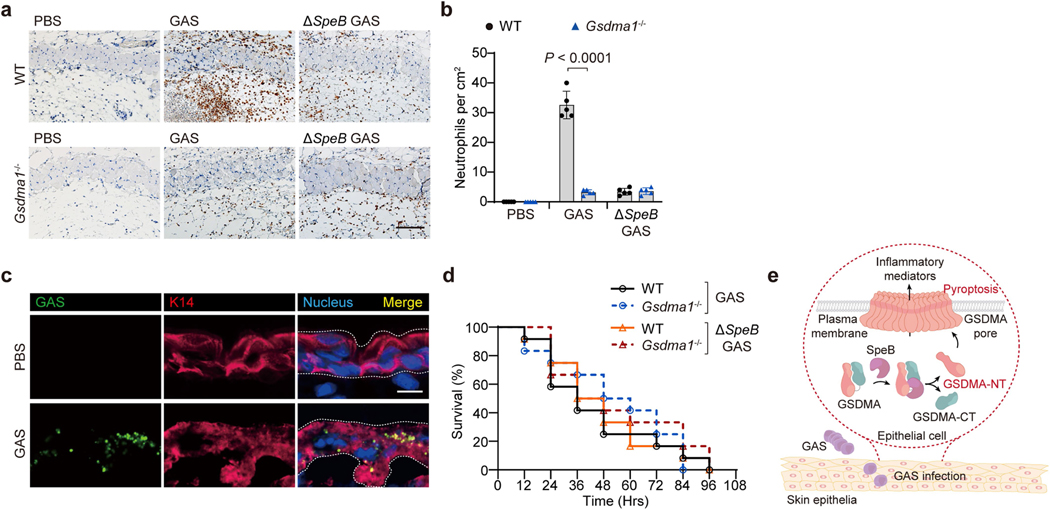
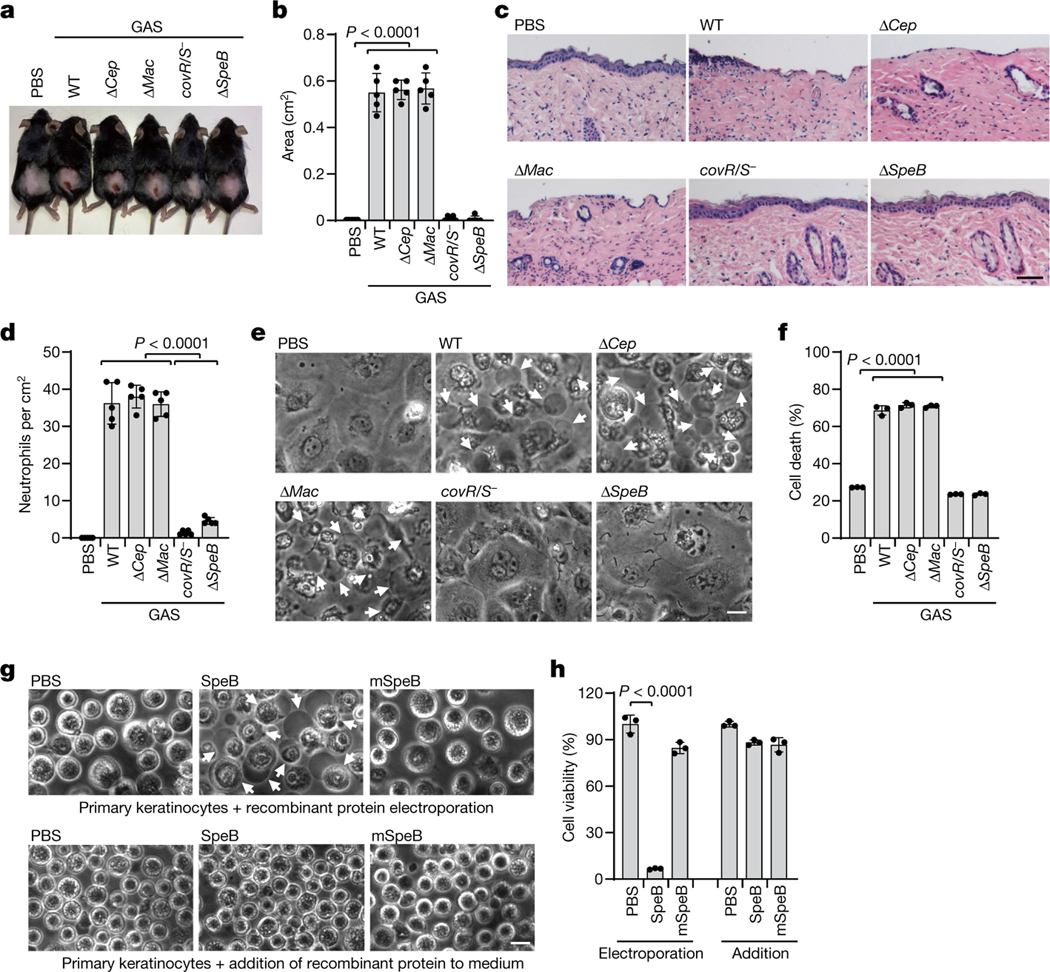
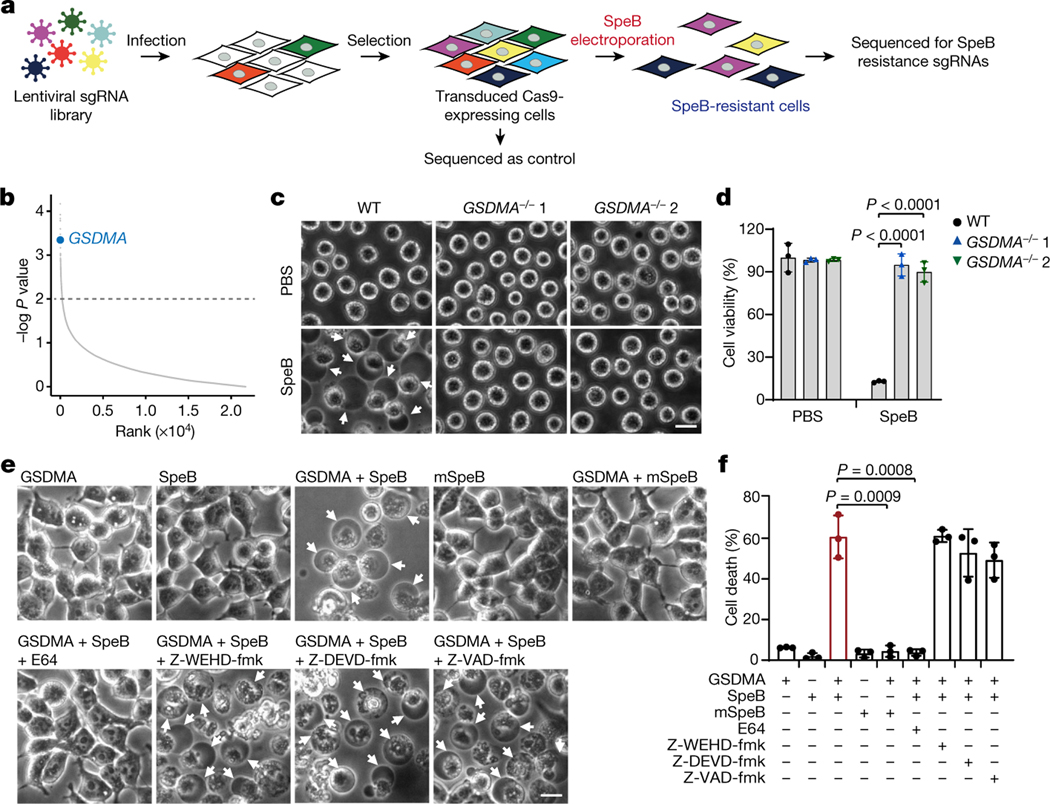
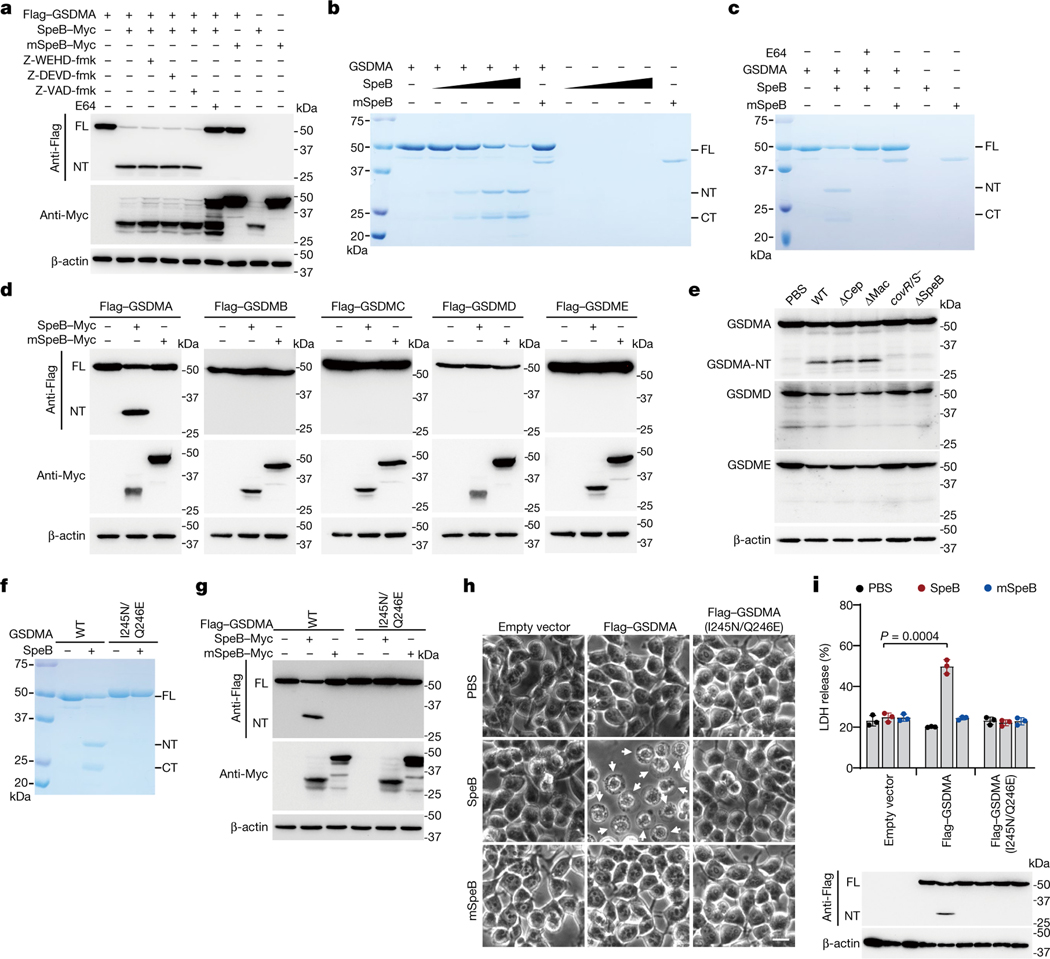
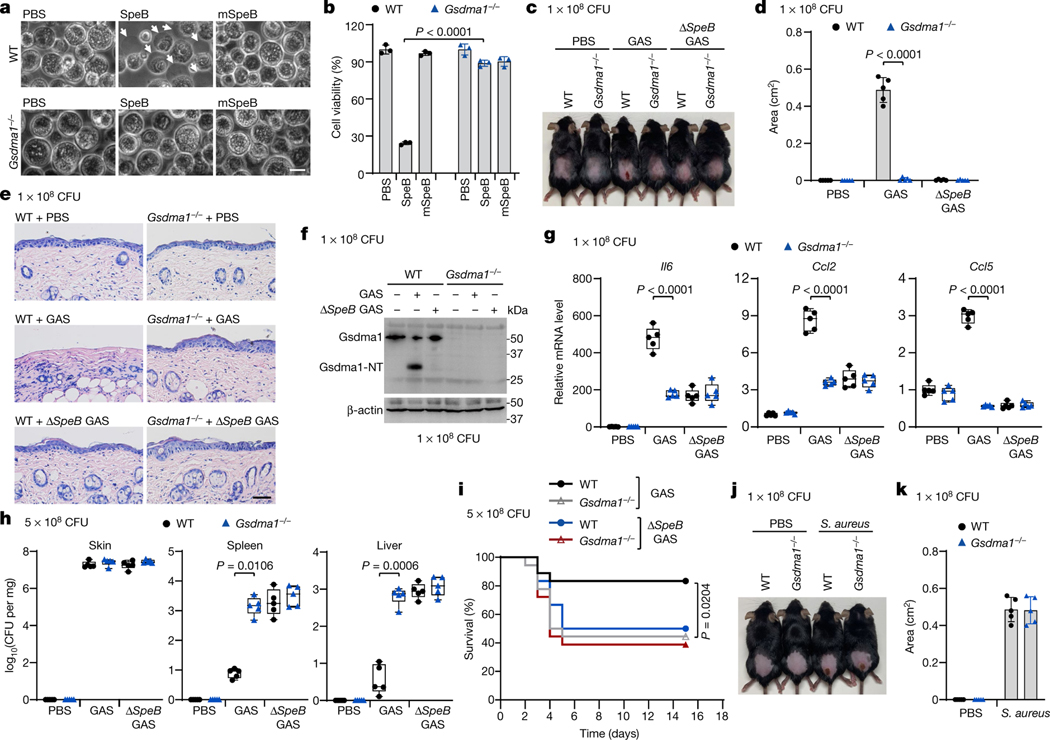
Gasdermins, a family of five pore-forming proteins (GSDMA-GSDME) in humans expressed predominantly in the skin, mucosa and immune sentinel cells, are key executioners of inflammatory cell death (pyroptosis), which recruits immune cells to infection sites and promotes protective immunity1,2. Pore formation is triggered by gasdermin cleavage1,2. Although the proteases that activate GSDMB, C, D and E have been identified, how GSDMA-the dominant gasdermin in the skin-is activated, remains unknown. Streptococcus pyogenes, also known as group A Streptococcus (GAS), is a major skin pathogen that causes substantial morbidity and mortality worldwide3. Here we show that the GAS cysteine protease SpeB virulence factor triggers keratinocyte pyroptosis by cleaving GSDMA after Gln246, unleashing an active N-terminal fragment that triggers pyroptosis. Gsdma1 genetic deficiency blunts mouse immune responses to GAS, resulting in uncontrolled bacterial dissemination and death. GSDMA acts as both a sensor and substrate of GAS SpeB and as an effector to trigger pyroptosis, adding a simple one-molecule mechanism for host recognition and control of virulence of a dangerous microbial pathogen.


Conflict of interest statement

Competing interests The authors declare no competing interests.

Figures

Extended Data Fig. 1 |
Extended Data Fig. 1 |. SpeB-deficient GAS triggers systemic infection.
a, DNA sequence comparison of GAS isolate M1T1 strain 5448 and its isogenic mutant strains (ΔcepA, Δmac, covR/S and ΔspeB variants). b, c, RT-PCR (b) and immunoblot analysis (c) of the expression of SpeB in the indicated GAS strains. df, mice were infected or not with the indicated GAS strains. d, IHC analysis of neutrophil infiltration at infection site on day 1. Scale bar: 100 μm. e, Bacteria load measured from skin lesions, spleens and livers of mice infected or not with GAS. f, Survival rate of mice challenged or not with the indicated GAS (n = 18 mice per group). e, box plots show all points, min to max (n = 5 mice per group). The center line, upper limit and lower limit of the box denote median, 25th and 75th percentiles and the whiskers denote the minimum and maximum values of data. e, Two-tailed Student’s t-test; f, Mantel-Cox log-rank test. Data are representative of at least three independent experiments. For gel source data, see Supplementary Fig. 1.
Extended Data Fig. 2 |
Extended Data Fig. 2 |. SpeB contributes to local tissue destruction.
a, b, The re-expression of SpeB in ΔspeB GAS was confirmed by both RT-PCR (a) and immunoblot analysis (b). ch, mice were infected or not with the indicated GAS strains. c, Representative image of skin lesions of mice challenged with GAS or not for 1 day. d, Quantification of skin lesion size. e, Histopathology of skin biopsies analysed by H&E staining. f, g, IHC analysis and quantification of neutrophil infiltration at infection site. h, Bacteria load measured from skin lesions, spleens and livers of mice infected or not with GAS. Scale bar: 100 μm. d, g, show mean ± s.d. (n = 5 mice per group); h, box plots show all points, min to max (n = 5 mice per group). The center line, upper limit and lower limit of the box denote median, 25th and 75th percentiles and the whiskers denote the minimum and maximum values of data. d, g, h, Two-tailed Student’s t-test. Data are representative of at least three independent experiments. For gel source data, see Supplementary Fig. 1.
Extended Data Fig. 3 |
Extended Data Fig. 3 |. SpeB triggers lytic death of primary mouse keratinocytes and A431 cells.
a, Primary mouse keratinocytes were infected with GAS isolate M1T1 strain 5448 or its isogenic mutant strains for the indicated times. Percentage of internalized GAS was shown by counting intracellular CFUs relative to the inoculum (left panel). Cell cytotoxicity of all the cells in a well was measured by LDH release assay (right panel). bd, Primary keratinocytes infected with FITC-labeled GAS strains were washed with PBS before cells were stained and analyzed by confocal fluorescence imaging. Cell borders are outlined with dashed lines. Cells with intracellular GAS were quantified from 700 cells (n = 5, mean ± s.d.) (b). e, Levels of hyaluronic acid capsule at logarithmic and stationary growth phases. f, RT-PCR (left panel) and immunoblot analysis (right panel) of the expression of SpeB in the indicated GAS strains. g, h Primary keratinocytes infected or not with the indicated GAS strains for 2.5 h were analysed by phase-contrast microscopy (g), LDH release (h). i, j, A431 cells infected or not with GAS isolate M1T1 strain 5448 or its isogenic mutant strains for 2.5 h were analysed by phase-contrast microscopy (i) and LDH release (j). k, l, Equal amounts of recombinant of WT SpeB or protease activity-deficient mutant mSpeB were respectively electroporated into A431 cells for 1 h or directly added into cell culture medium for 2.5 h, followed by cell morphology observation by phase-contrast microscopy (k), cell viability assessment by CellTiter-Glo luminescent assay (l). g, i, Arrowheads indicate pyroptotic cells. c, d, g, i, k, scale bar: 10 μm. Graphs show mean ± s.d. of triplicate wells. h, j, One-way ANOVA; l, Two-tailed Student’s t-test. Data are representative of at least three independent experiments. For gel source data, see Supplementary Fig. 1.
Extended Data Fig. 4 |
Extended Data Fig. 4 |. Validation of additional hits identified from CRISPR screen of SpeB-triggered lytic cell death.
a, List of top hits from CRISPR screen of SpeB-triggered lytic cell death. b, GSDMA-knockout cells used in this study. Gene coding sequences were present as black boxes. Top sequence track is the gene wild-type allele. Location of gRNAs is indicated with blue bars and PAM sequences were underscored. cl, WT and the indicated gene knockout A431 cells were transfected or not with recombinant SpeB by electroporation, followed by cell morphology observation by phase-contrast microscopy (c, e, g, i, k), cell viability assessment by CellTiter-Glo luminescent assay (d, f, h, j, l). Scale bar: 10 μm. Graphs show mean ± s.d. of triplicate wells. Data are representative of at least three independent experiments.
Extended Data Fig. 5 |
Extended Data Fig. 5 |. SpeB specifically targets and cleaves GSDMA.
a, b, In vitro cleavage assay of recombinant GSDMA, GSDMD (a) or GSDME (b) by incubation with recombinant WT SpeB (100 nM) or mSpeB (250 nM) for 0.5 h. c, Whole cell lysates of A431 cells infected or not with the indicated GAS strains were subjected to immunoblot analysis for the indicated proteins. df, 293T cells were transfected with the indicated plasmids (Flag-tagged GSDMA, Myc-tagged bacterial proteases) before analysed by phase-contrast microscopy (d), LDH release (e) and immunoblot of whole cell lysates with the indicated antibodies (f). g, h, Flag-tagged GSDMA was treated or not with SpeB, staphopains (ScpA, SspB), or cathepsins (Cathepsin B, L, D) before subjected to immunoblot analysis with the indicated antibodies. i, GSDMA N-terminal and C-terminal cleavage products (p27 and p23) were analysed by mass spectrometry (MS) and Edman sequencing, respectively. Individual peptides identified by MS and shown in black bars were mapped against N-terminal GSDMA (upper right panel). Middle right panel shows the N-terminal sequence of p23 determined by Edman sequencing, the diagram of GSDMA two-domain architecture, and SpeB cleavage site Gln246 highlighted in green. Bottom panel shows the positions (P) on the substrate of SpeB (GSDMA) which are counted and numbered (P3-P2-P1-P1’-P2’-P3’) from the point of cleavage. j, Whole cell lysates of 293T cells transfected with the indicated plasmids were collected and subjected to immunoblot analysis. Scale bar: 10 μm. Data are representative of at least three independent experiments. Graphs show mean ± s.d. of triplicate wells. e, One-way ANOVA. Data are representative of at least three independent experiments. For gel source data, see Supplementary Fig. 1.
Extended Data Fig. 6 |
Extended Data Fig. 6 |. GSDMA-NT produced by SpeB cleavage is sufficient to initiate pyroptosis, but does not injure bystander cells.
a, Coomassie Blue-stained SDS-PAGE gel showing purified recombinant GSDMA, GSDMA-NT and GSDMA-CT. bd, Equal amounts of recombinant full-length GSDMA, GSDMA-NT (1–246aa), GSDMA-CT, full-length GSDMD, Caspase-11 or full-length GSDMD plus Caspase-11 were electroporated into 293T cells respectively, followed by cell morphology observation by phase-contrast microscopy (b), cell viability analysis by CellTiter-Glo luminescent assay (c), and cell death assessment by PI uptake (d). eg, Equal amounts of recombinant of full-length GSDMA, GSDMA-NT (1–246aa), GSDMA-CT, full-length GSDMD, Caspase-11 or full-length GSDMD plus Caspase-11 were respectively added directly into cell culture medium, followed by cell morphology observation by phase-contrast microscopy (e), cell viability analysis by CellTiter-Glo luminescent assay (f), and cell death assessment by PI uptake (g). Pyroptotic cells form large ballooning bubbles; Scale bar: 20 μm. Graphs show mean ± s.d. of triplicate wells (c, f) or mean ± s.e.m. of quadruplicate wells (d, g). c, Two-tailed Student’s t-test. Data are representative of at least three independent experiments. For gel source data, see Supplementary Fig. 1.
Extended Data Fig. 7 |
Extended Data Fig. 7 |. GSDMA 1–246aa, but not 1–214aa possesses pyroptosis-inducing activity.
a, Coomassie Blue-stained SDS-PAGE gel showing recombinant engineered GSDMA with Flag tag-3C protease cleavage sequence inserted immediately after residue G214, Q246, treated with 3C protease. bd, 293T cells were transfected with the indicated plasmids (Empty vector or Flag-tagged Gasdermin) before cell death was observed by phase-contrast microscopy (b) and determined by LDH release assay (c), whole cell lysates were collected for immunoblot analysis (d). Arrowheads indicate pyroptotic cells; Scale bar: 10 μm. Graphs show mean ± s.d. of triplicate wells. c, Two-tailed Student’s t-test. Data are representative of at least three independent experiments. For gel source data, see Supplementary Fig. 1.
Extended Data Fig. 8 |
Extended Data Fig. 8 |. Phospholipid binding property and liposome-disrupting activity of GSDMA-NT.
a, Lipid strips dotted with indicated phospholipids (left panel) were incubated with noncovalent complex of cleaved GSDMA with a Flag-tag inserted right before the cleavage site, unprocessed full-length GSDMA, or 3C protease, followed by immunoblot analysis with an anti-Flag antibody (right panel). b, Indicated liposomes incubated with noncovalent complex of cleaved GSDMA (NT + CT) and full-length GSDMA (FL) were subjected to sedimentation by ultracentrifugation. Proteins in both liposome-free supernatant (S) and liposome-containing pellet (P) were analysed by SDS-PAGE. c, Indicated recombinant proteins incubated or not with CL liposomes and glutaraldehyde were analyzed by SDS-agarose gel electrophoresis and subsequent Coomassie Blue staining. dh, Leakage of PC-PE liposomes containing additional PS or CL was monitored in real-time by terbium (Tb3+) fluorescence after incubation with recombinant gasdermins proteins in the presence or absence of recombinant SpeB or enzymatically inactive SpeB C192S (mSpeB) as indicated, or cysteine protease inhibitor E64 if necessary. Data are representative of at least three independent experiments. For gel source data, see Supplementary Fig. 1.
Extended Data Fig. 9 |
Extended Data Fig. 9 |. GSDMA proteins in different species.
Multiple sequences alignment of human (h), chimpanzee (cp), monkey (mk), rat (r), dog (dg) GSDMA and mouse Gsdma1, Gsdma2 and Gsdma3 was performed using the ClustalW2 algorithm and plotted by ESPript program. Identical residues are highlighted by red background, and similar residues are indicated in red. Ile 245 and Gln246 (*) in human GSDMA are highly conserved in chimpanzee, monkey, rat, dog GSDMA as well as mouse Gsdma1.
Extended Data Fig. 10 |
Extended Data Fig. 10 |. SpeB cleaves mouse Gsdma1 and releases its N-terminal pyroptosis-inducing activity.
a, Whole cell lysates of 293T cells transfected with the indicated plasmids were collected and subjected to immunoblot analysis with the indicated antibodies. b, Coomassie Blue-stained SDS-PAGE gel showing in vitro cleavage of recombinant WT Gsdma1 or mutant Gsdma1 I246N/Q247E (1 μM) incubated with or without recombinant WT SpeB (100 nM) for 0.5 h. c, Whole cell lysates of 293T cells transfected with the indicated plasmids were collected and subjected to immunoblot analysis. d, Leakage of PC-PE liposomes containing additional PS or CL was monitored in real-time by terbium (Tb3+) fluorescence after incubation with recombinant gasdermins proteins in the presence or absence of recombinant SpeB as indicated. e, f, 293T cells transfected with the indicated plasmids were analysed by phase-contrast microscopy (e), LDH release (f). Arrowheads indicate pyroptotic cells; Scale bar: 10 μm. Graphs show mean ± s.d. of triplicate wells. f, One-way ANOVA. Data are representative of at least three independent experiments. For gel source data, see Supplementary Fig. 1.
Extended Data Fig. 11 |
Extended Data Fig. 11 |. Gsdma1 deficiency affects host immune responses against subcutaneous but not intraperitoneal infection of GAS WT.
a, WT and Gsdma1−/− mice were subcutaneously infected or not with GAS isolate M1T1 strain 5448 or its isogenic mutant strain (ΔspeB variant). IHC analysis of neutrophil infiltration at infection site on day 1. Scale bar: 100 μm. b, Quantification of neutrophil infiltration at infection site. c, Cutaneous sections from Gsdma1−/− mice infected or not for 18 h with FITC-labelled GAS WT were subjected to immunofluorescence staining with anti-keratin 14. Nucleus was stained with DAPI. Dashed lines delineate the boundaries of epidermis. Scale bar: 10 μm. d, Survival rate of mice intraperitoneally administrated with the indicated GAS (n = 12 mice per group). e, Model of SpeB-triggered GSDMA activation and subsequent pyroptosis of skin epithelial cells during GAS infection. b, show mean ± s.d. (n = 5 mice per group); Two-tailed Student’s t-test. Data are representative of at least three independent experiments.
Fig. 1 |
Fig. 1 |. The GAS virulence factor SpeB triggers lytic death of skin epithelial cells.
ad, Mice were infected with GAS M1T1 strain 5448 (WT) or its isogenic mutant strains (ΔcepA, Δmac, covR/S and ΔspeB). a, Representative image of skin lesions of mice challenged with indicated GAS variants. b, Quantification of skin lesion size. c, Histopathology of skin biopsies analysed by haematoxylin and eosin (H&E) staining. Scale bar, 100 μm. d, Quantification of neutrophil infiltration at skin lesion site. e, f, Primary mouse keratinocytes infected with indicated GAS strains for 2.5 h or not infected (PBS) were analysed by phase-contrast microscopy (e) and assayed for LDH release (f). g, h, Equal amounts of recombinant WT SpeB or the protease activity-deficient mutant mSpeB were electroporated into primary keratinocytes for 1 h, followed by observation of cell morphology by phase-contrast microscopy (g) and cell viability assessment by CellTiter-Glo luminescent assay (h). Keratinocytes displayed a rounded shape as they were resuspended before treatments. Arrows indicate pyroptotic cells. Scale bar, 10 μm. Data in b, d, are mean ± s.d. (n = 5 mice per group); data in f, h, are mean ± s.d. of triplicate wells. b, d, f, One-way analysis of variance (ANOVA). h, Two-tailed Student’s t-test. Data are representative of at least three independent experiments.
Fig. 2 |
Fig. 2 |. SpeB triggers pyroptosis in a GSDMA-dependent manner.
a, Schematic workflow of the genome-wide CRISPR screening procedure. b, Genes were ranked according to their relative enrichment after treatment with SpeB electroporation relative to controls in positive selection, which was calculated using the MAGeCK RRA algorithm. The dotted line represents a P value of 0.01. c, d, WT and GSDMA-deficient A431 cells were transfected with recombinant SpeB by electroporation for 1 h, cell morphology was observed by phase-contrast microscopy (c) and cell viability was assessed by CellTiter-Glo luminescent assay (d). e, f, 293T cells transfected with the indicated plasmids were treated with E-64 (broad spectrum cysteine protease inhibitor, 50 μM), Z-WEHD-fmk (caspase-1/5 inhibitor, 10 μM), Z-DEVD-fmk (caspase-3/6/7/8/10 inhibitor, 10 μM) or Z-VAD-fmk (pan-caspase inhibitor, 10 μM) at 4 h after transfection. Cell morphology was observed by phase-contrast microscopy (e) and cell death was assessed by LDH release assay (f) 12 h later. Arrows indicate pyroptotic cells. Scale bar, 10 μm. Data in d, f are mean ± s.d. of triplicate wells. d, f, Two-tailed Student’s t-test. Data are representative of at least three independent experiments.
Fig. 3 |
Fig. 3 |. SpeB directly cleaves GSDMA after Gln246.
a, 293T cells transfected with the indicated plasmids were treated with or without the indicated inhibitors, before the whole cell lysates were analysed by western blot. SpeB is autocatalysed and the molecular weights of SpeB and its active autocatalysed fragment are approximately 42 kDa and 28 kDa, respectively. b, c, Coomassie blue-stained SDS–PAGE showing in vitro cleavage of recombinant GSDMA (1 μM) incubated with increasing concentrations of recombinant SpeB (12.5, 25, 50 and 100 nM, wedges) or mSpeB (250 nM) in the absence (b) or presence (c) of E64 (2 μM). WT SpeB was not detected, partially owing to the autocatalytic cleavage and reduced stability of active SpeB. d, Whole-cell lysates of 293T cells transfected with Flag-tagged gasdermins together with WT SpeB or mSpeB were immunoblotted with the indicated antibodies. e, Whole-cell lysates of A431 cells infected with GAS M1T1 strain 5448 (WT) or its isogenic mutant strains were analysed by western blot. f, Coomassie blue-stained SDS–PAGE showing in vitro cleavage of recombinant WT GSDMA or mutant GSDMA(I245N/Q246E) (1 μM) incubated with or without recombinant SpeB (100 nM). g, Whole-cell lysates of 293T cells transfected with the indicated plasmids were analysed by western blot. h, i, 293T cells stably expressing WT GSDMA or GSDMA(I245N/Q246E) were transfected by electroporation with recombinant SpeB or mSpeB and analysed by phase-contrast microscopy (h), for LDH release (i, top) and by western blot of whole-cell lysates with indicated antibodies (i, bottom). Cells exhibiting ballooning morphology (indicated by white arrows) are undergoing pyroptosis. Scale bar, 10 μm. Data in i are mean ± s.d. of triplicate wells. i, Two-tailed Student’s t-test. Data are representative of at least three independent experiments. CT, C terminal; FL, full-length; NT, N terminal. For gel source data, see Supplementary Fig. 1.
Fig. 4 |
Fig. 4 |. Gsdma1 deficiency blunts host anti-GAS immunity.
a, b, Primary keratinocytes isolated from WT or Gsdma1−/− mice were electroporated with recombinant SpeB. Cell morphology was observed by phase-contrast microscopy (a) and cell viability was assessed by CellTiter-Glo luminescent assay (b). Arrows indicate pyroptotic cells. Scale bar, 10 μm. ci, WT and Gsdma1−/− mice were infected with GAS M1T1 strain 5448, ΔspeB GAS or PBS control. c, Representative image of skin lesions of mice challenged for 1 day. d, Quantification of skin lesion size. e, Histopathology of skin biopsies analysed by H&E staining. Scale bar, 100 μm. f, Skin biopsies from WT or Gsdma1−/− mice infected with WT or ΔspeB mutant GAS were analysed by western blot. g, The induction of Il6, Ccl2 and Ccl5 expression in skin biopsy was examined. h, Bacteria load measured from skin lesions, spleens and livers of mice infected with GAS. i, Survival rate of mice challenged with the indicated GAS variants (n = 18 mice per group). j, k, WT and Gsdma1−/− mice were subcutaneously injected with S. aureus or PBS for 3 days. j, Representative image of skin lesions of mice. k, Quantification of skin lesion size. b, Data are mean ± s.d. of triplicate wells. d, k, Data are mean ± s.d. (n = 5 mice per group). g, h, Box plots show all data points, whiskers extend from minimum to maximum values (n = 5 mice per group), and the centre line, upper limit and lower limit of the box denote median, 25th and 75th percentiles, respectively. b, d, g, h, Two-tailed Student’s t-test. i, Mantel–Cox log-rank test. Data are representative of at least three independent experiments. CFU, colony-forming units. For gel source data, see Supplementary Fig. 1.

Comment in

References

    1. Broz P, Pelegrin P. & Shao F. The gasdermins, a protein family executing cell death and inflammation. Nat. Rev. Immunol 20, 143–157 (2020). - PubMed
    1. Liu X, Xia S, Zhang Z, Wu H. & Lieberman J. Channelling inflammation: gasdermins in physiology and disease. Nat. Rev. Drug Discov 20, 384–405 (2021). - PMC - PubMed
    1. Cole JN, Barnett TC, Nizet V. & Walker MJ Molecular insight into invasive group A streptococcal disease. Nat. Rev. Microbiol 9, 724–736 (2011). - PubMed
    1. Musser JM, Stockbauer K, Kapur V. & Rudgers GW Substitution of cysteine 192 in a highly conserved Streptococcus pyogenes extracellular cysteine protease (interleukin 1beta convertase) alters proteolytic activity and ablates zymogen processing. Infect. Immun 64, 1913–1917 (1996). - PMC - PubMed
    1. Svensson MD et al. Role for a secreted cysteine proteinase in the establishment of host tissue tropism by group A streptococci. Mol. Microbiol 38, 242–253 (2000). - PubMed

Publication types