. 2022 Feb;602(7896):268-273.
doi: 10.1038/s41586-021-04358-6. Epub 2022 Feb 2.

Autism genes converge on asynchronous development of shared neuron classes

Affiliations

Autism genes converge on asynchronous development of shared neuron classes

Bruna Paulsen et al. Nature. 2022 Feb.

Abstract

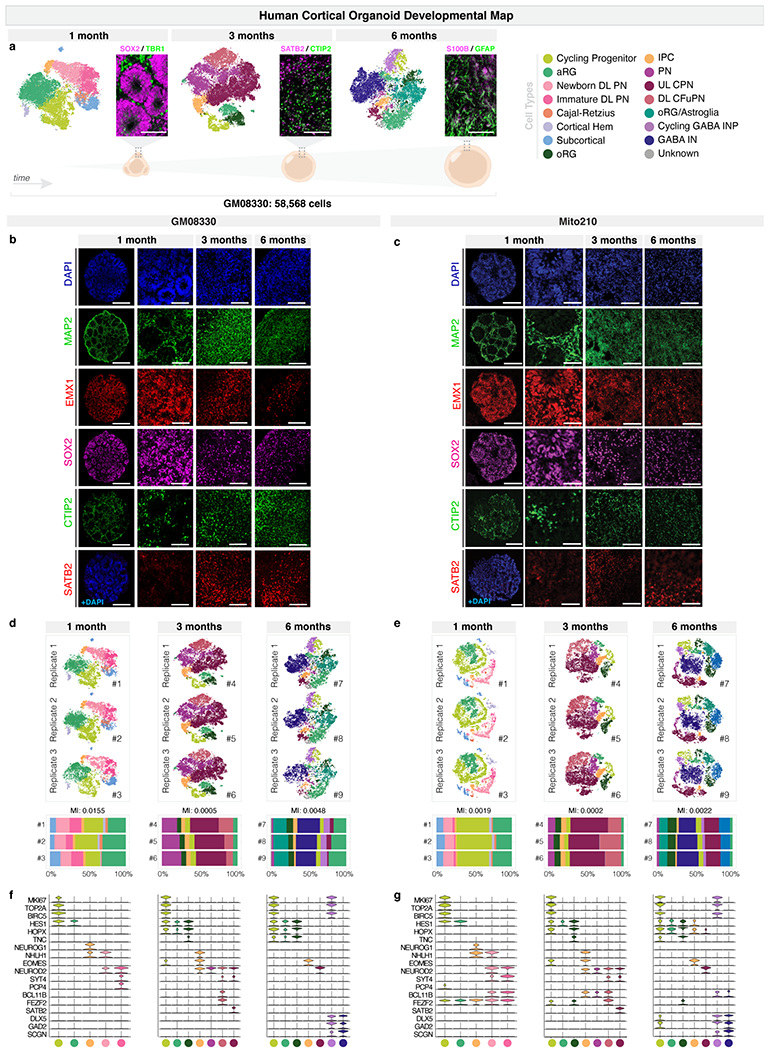
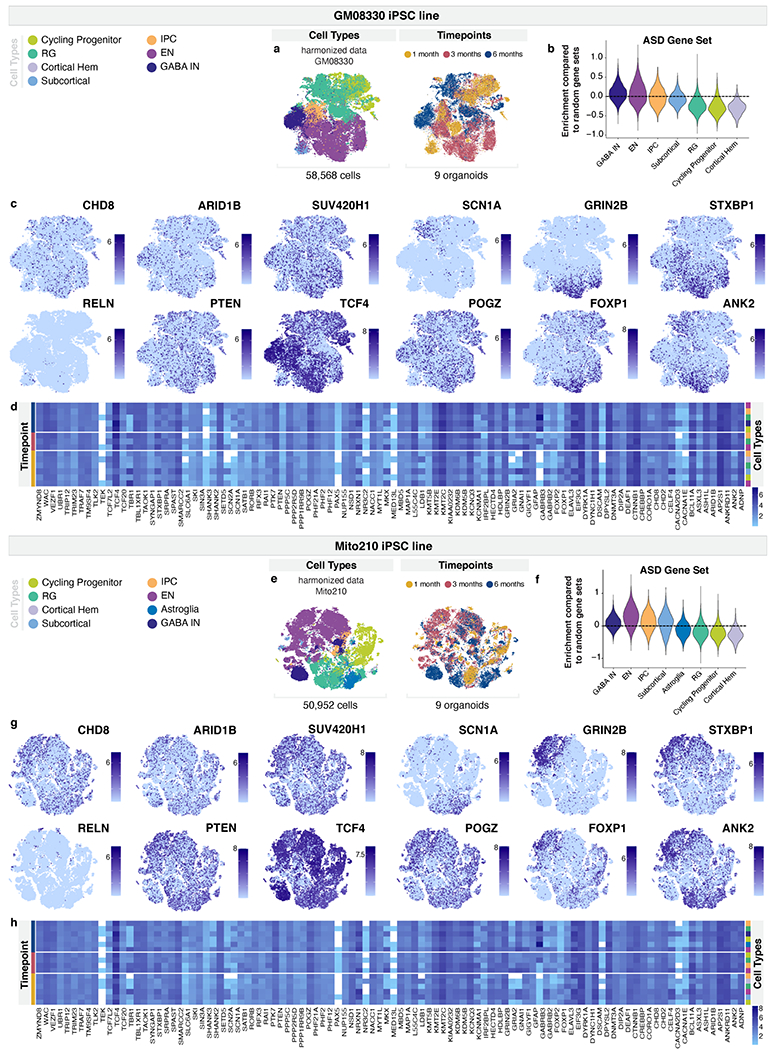
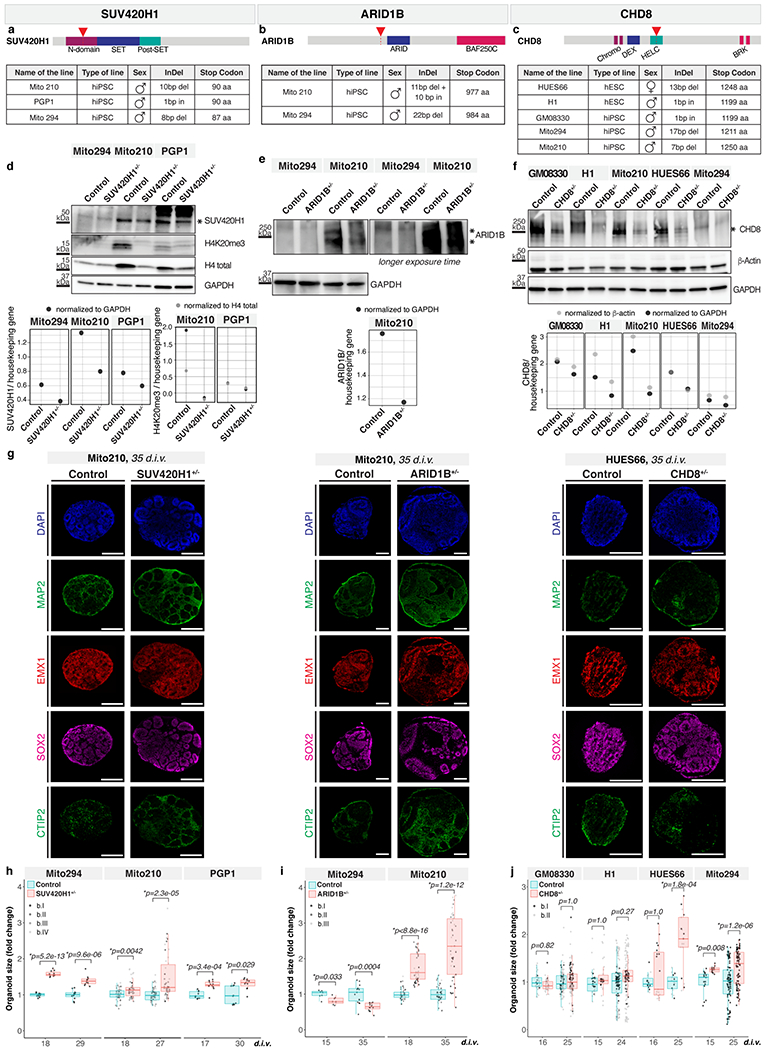
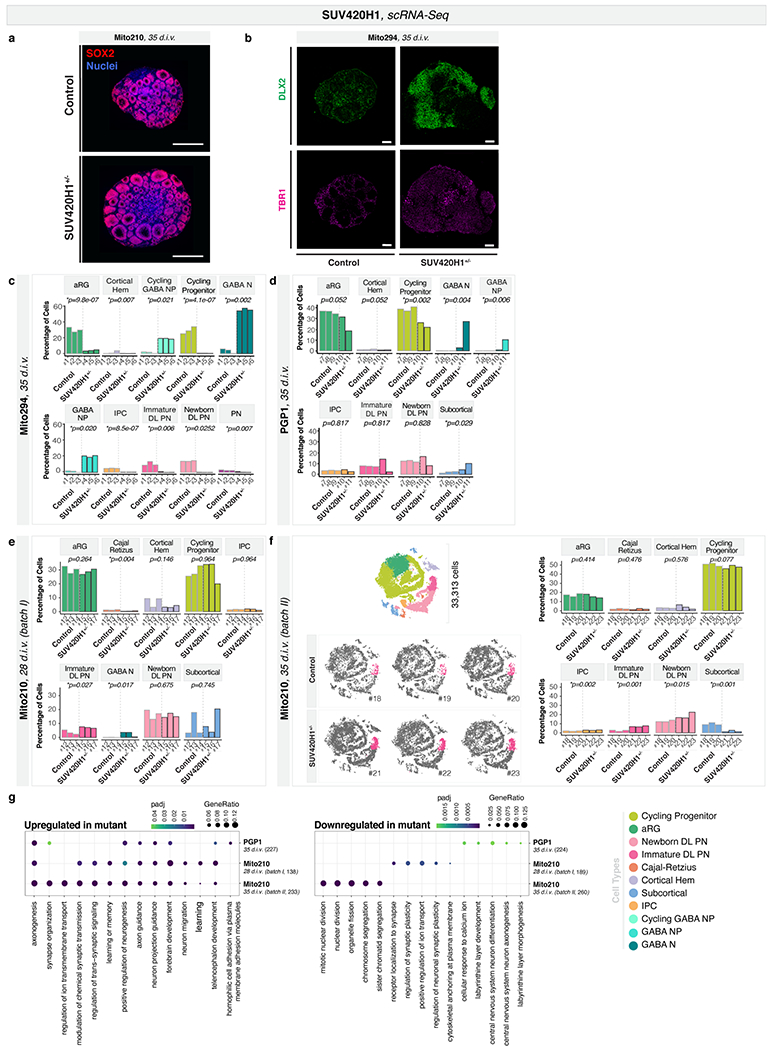
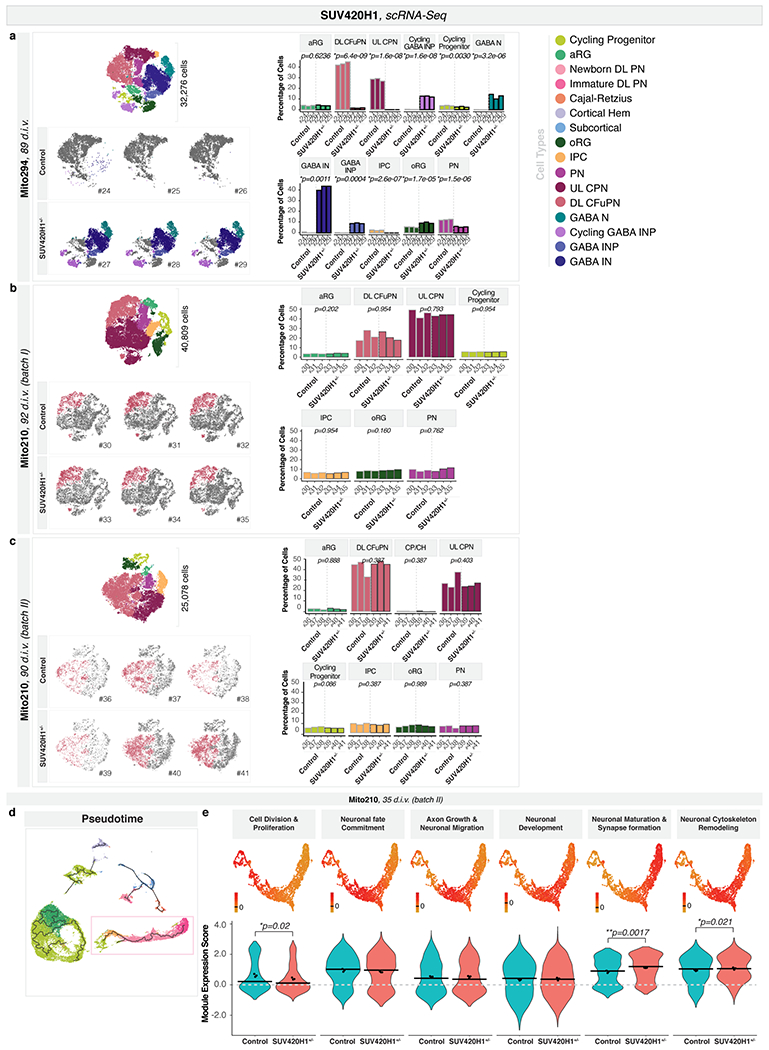
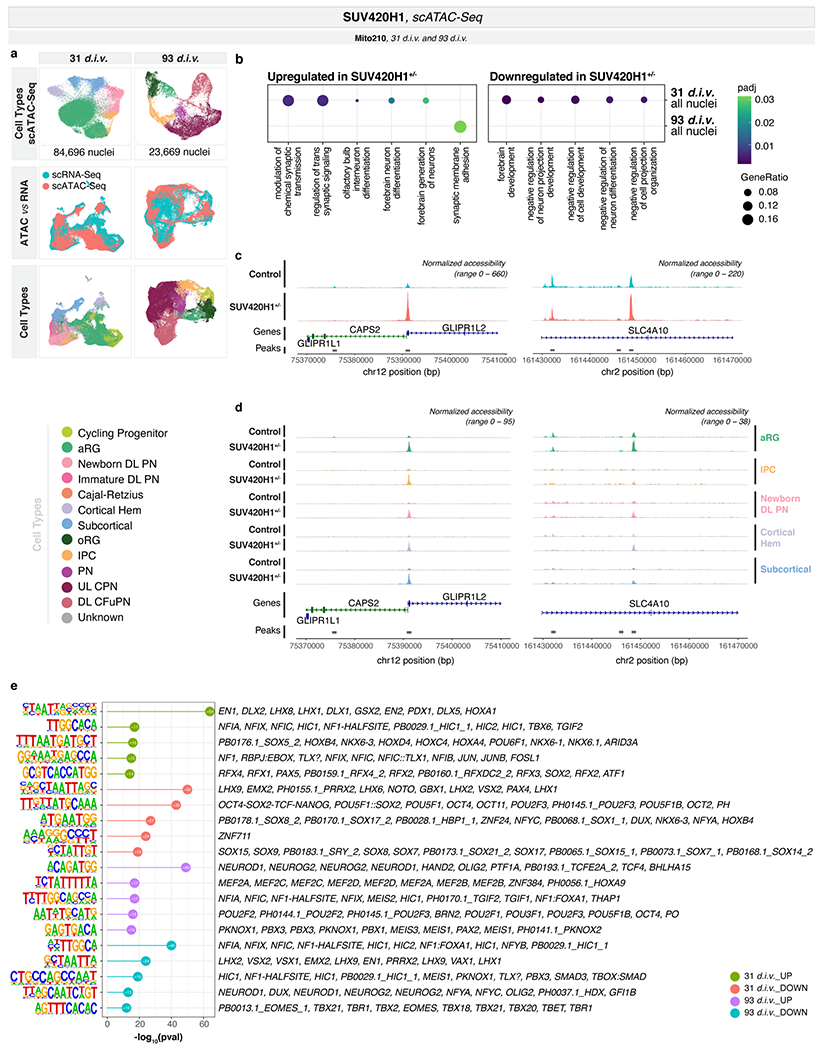
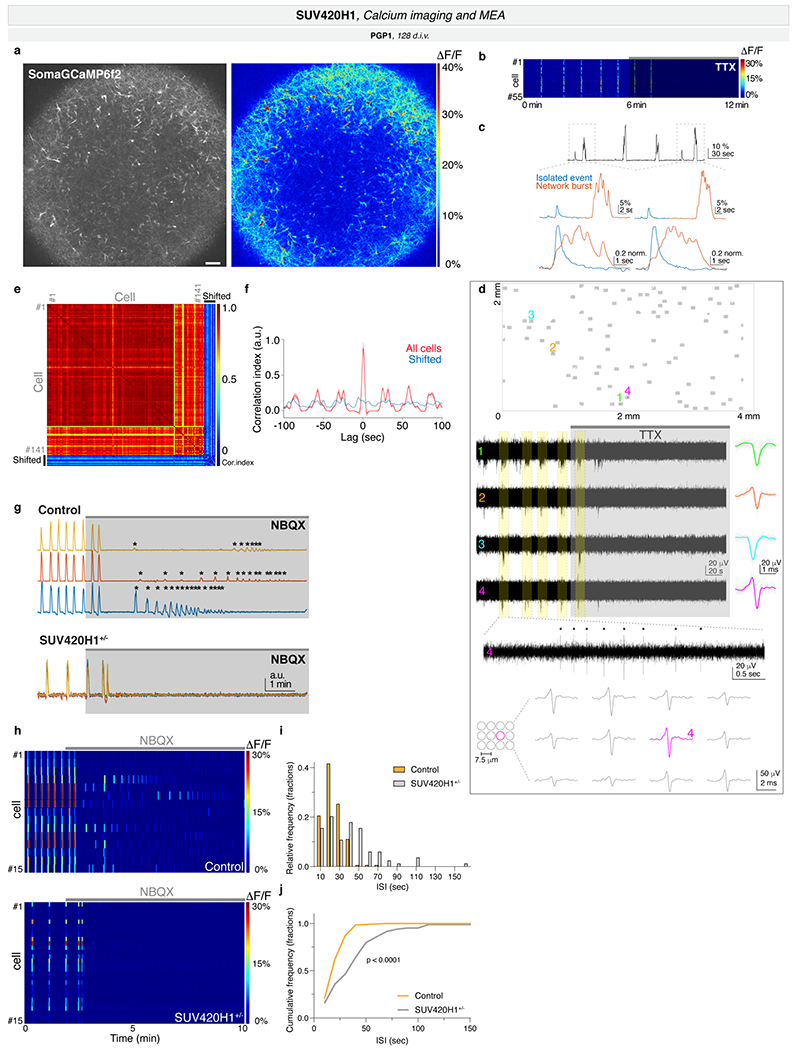
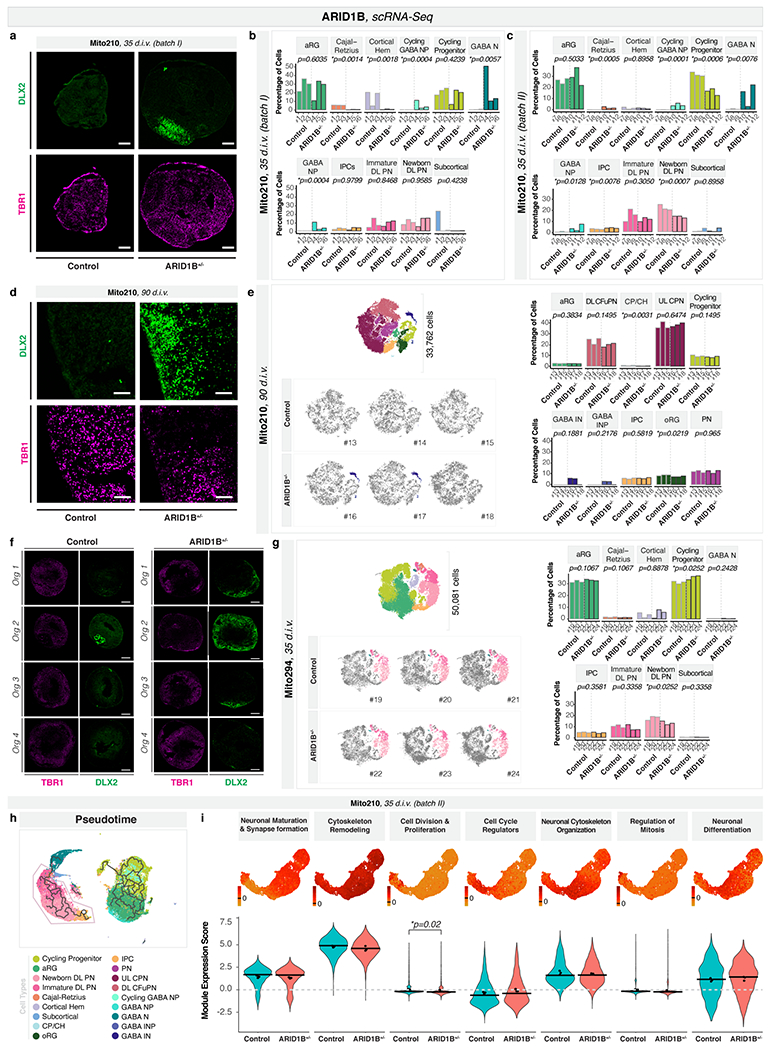
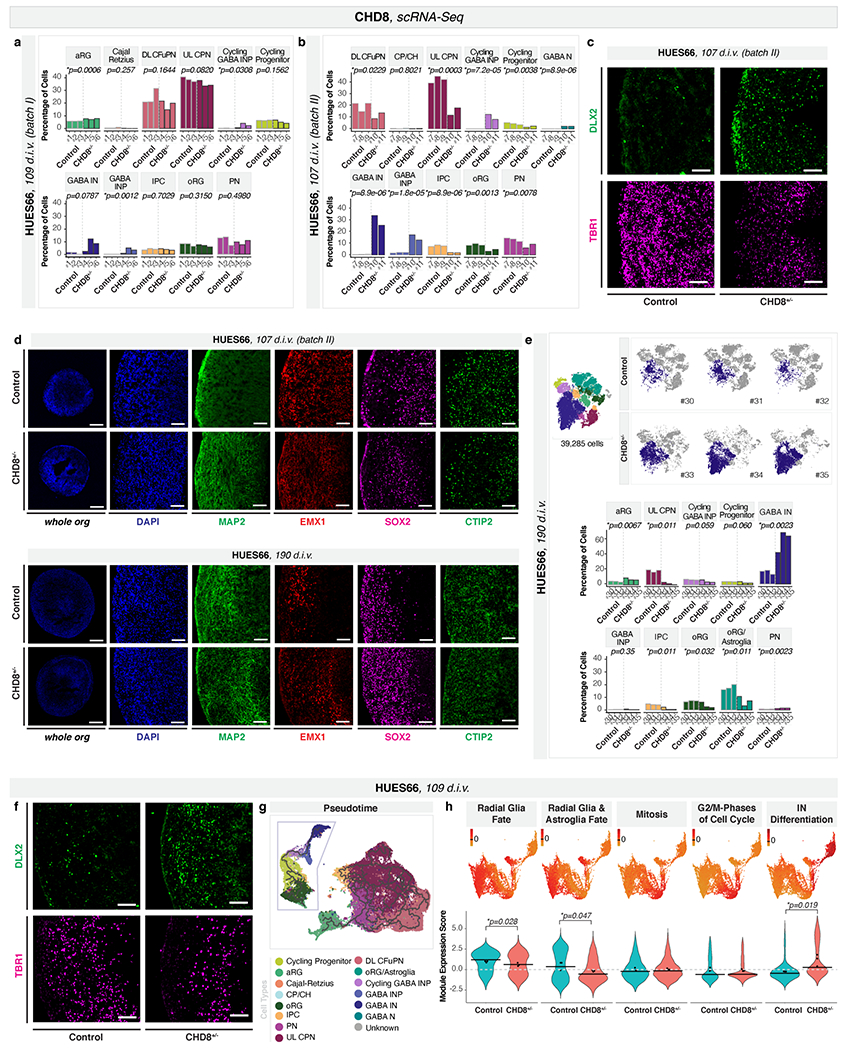
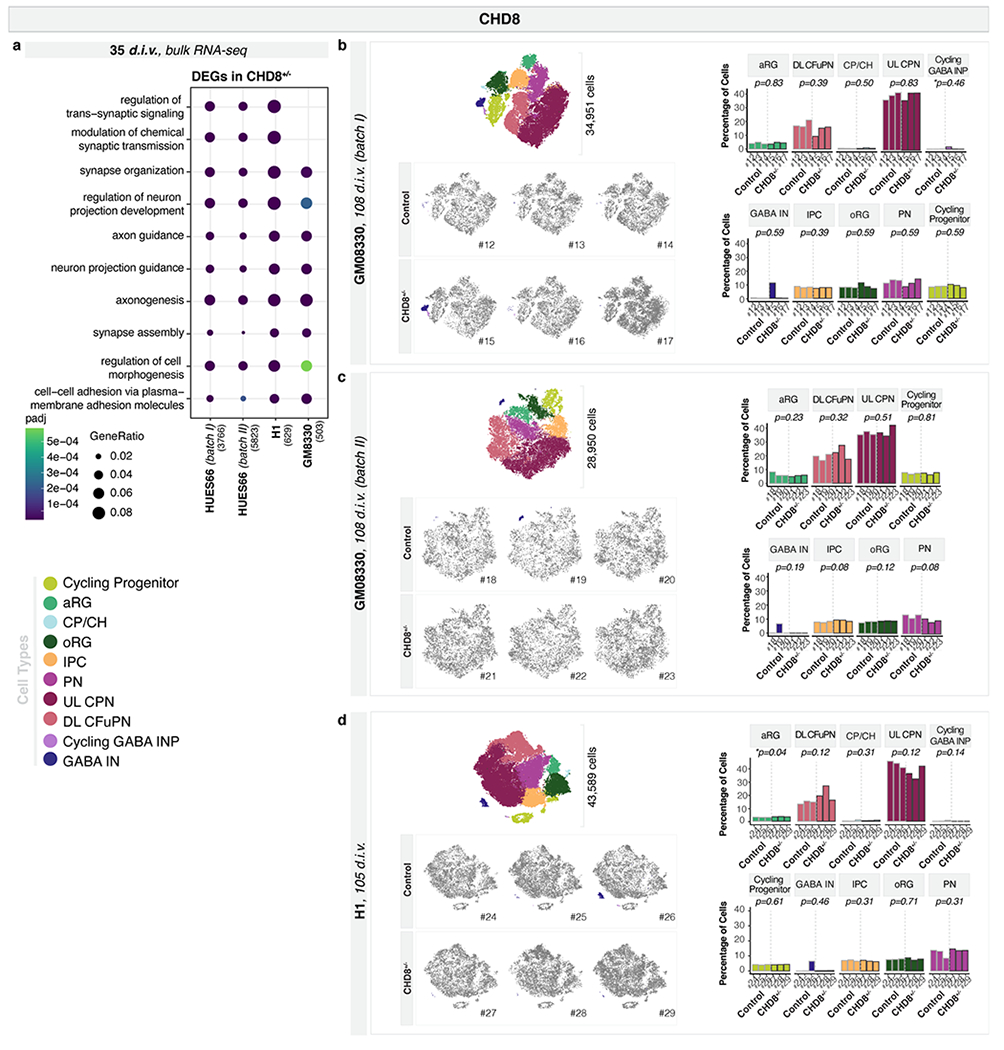
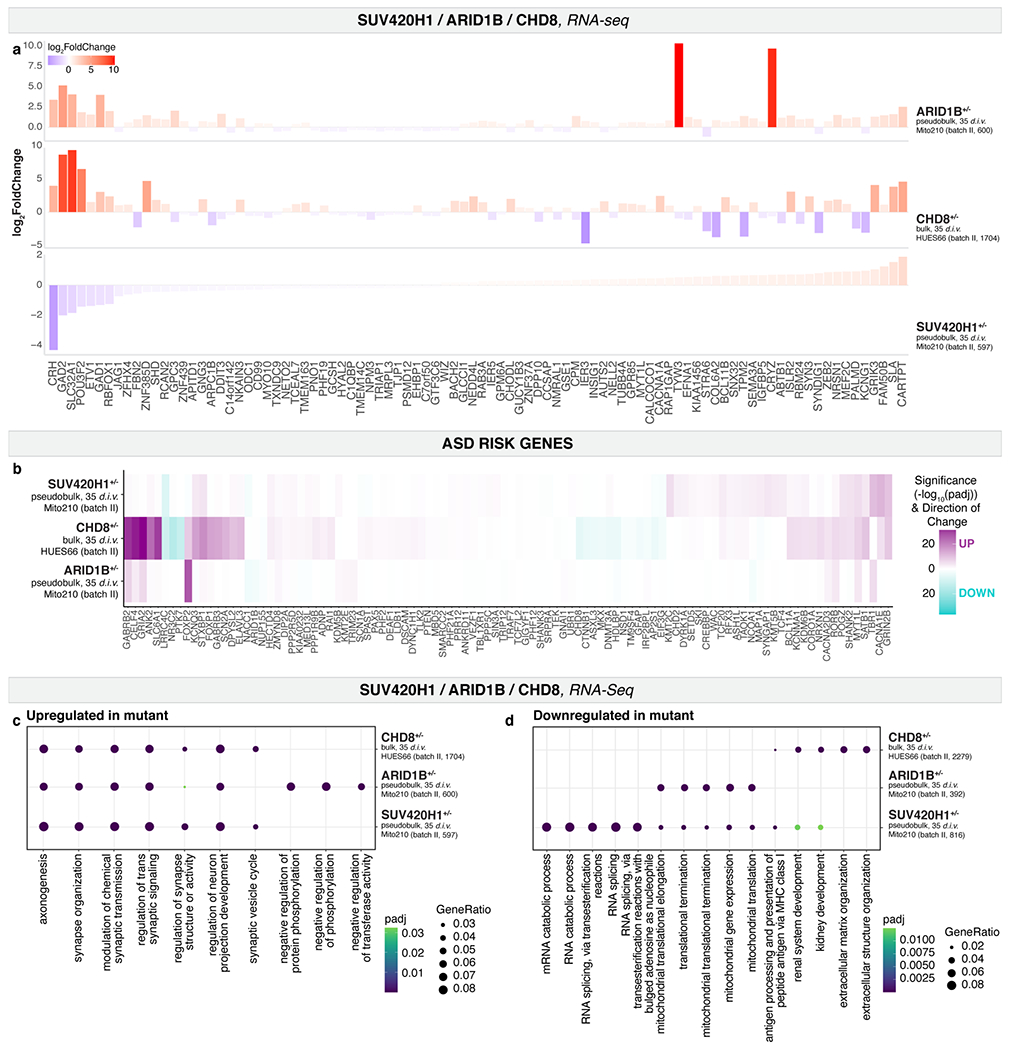
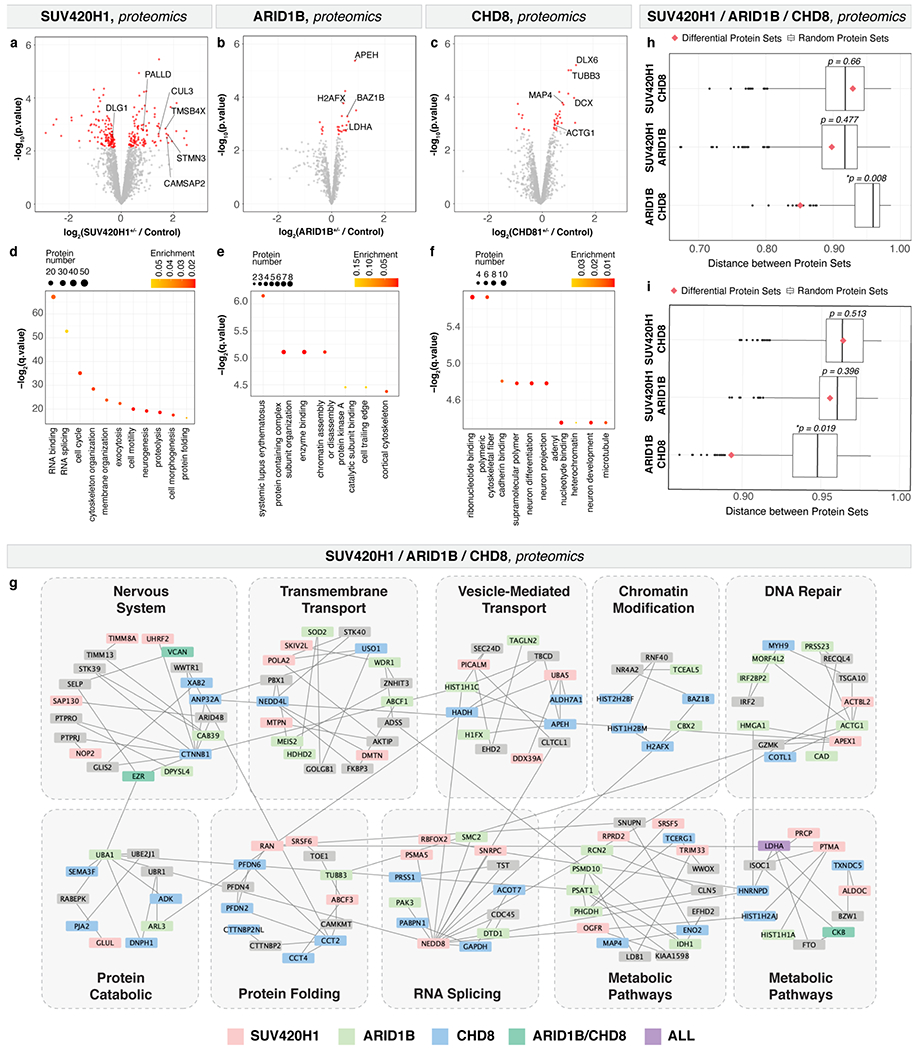
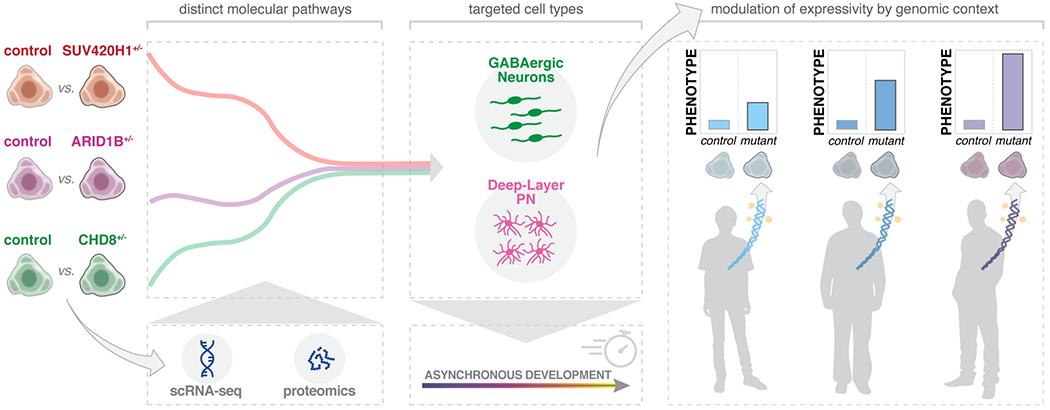
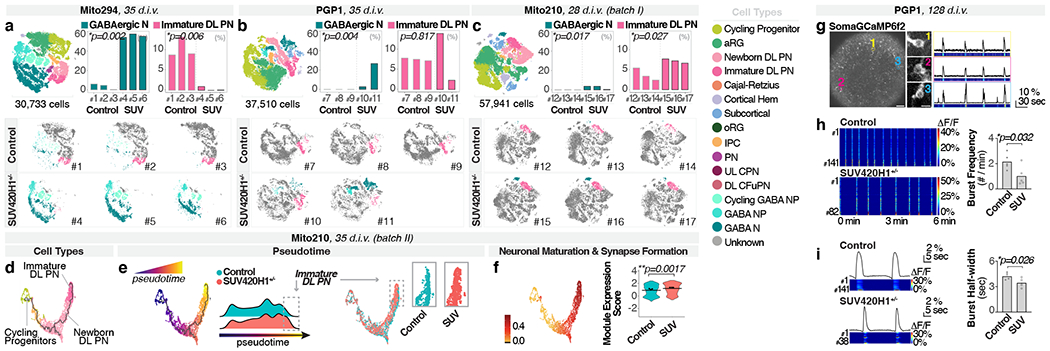
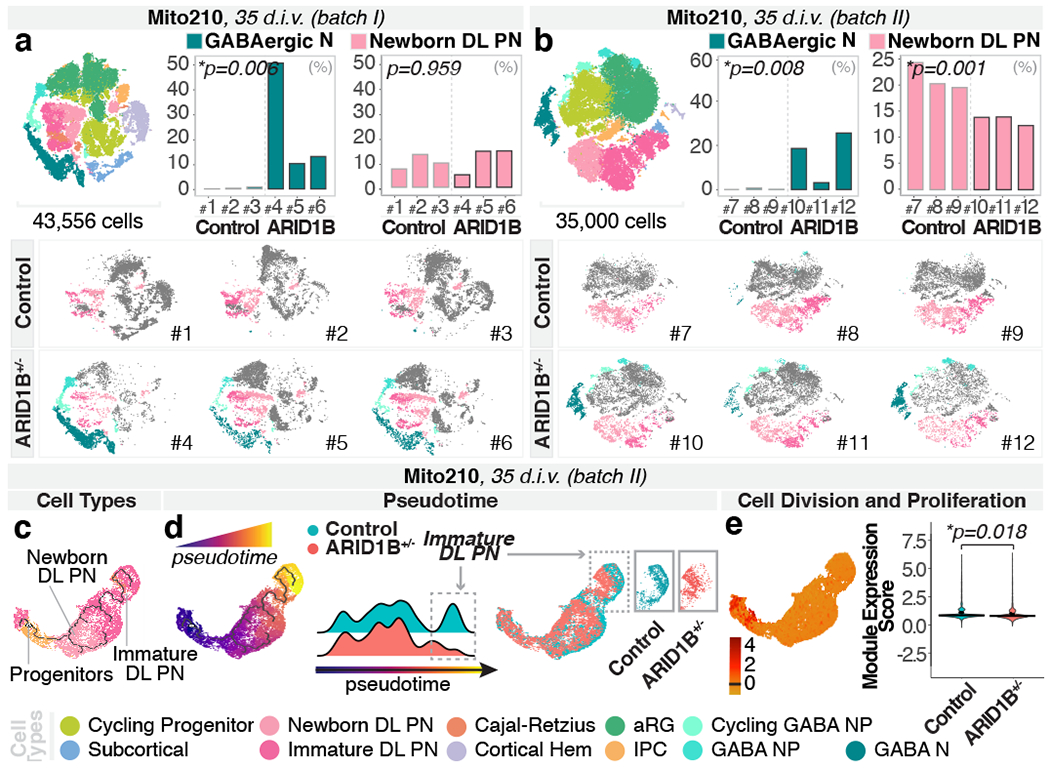
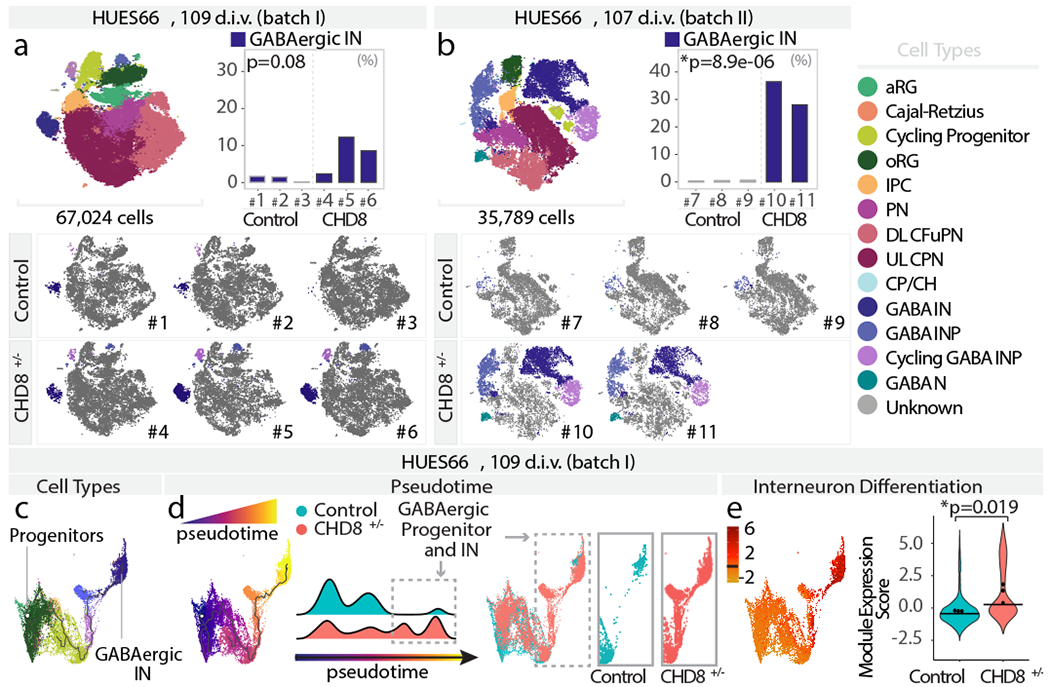
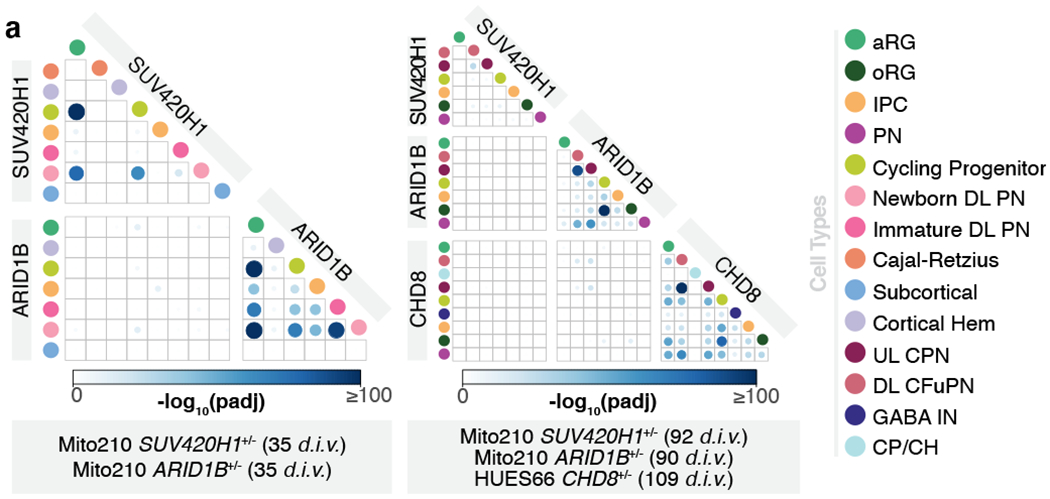
Genetic risk for autism spectrum disorder (ASD) is associated with hundreds of genes spanning a wide range of biological functions1-6. The alterations in the human brain resulting from mutations in these genes remain unclear. Furthermore, their phenotypic manifestation varies across individuals7,8. Here we used organoid models of the human cerebral cortex to identify cell-type-specific developmental abnormalities that result from haploinsufficiency in three ASD risk genes-SUV420H1 (also known as KMT5B), ARID1B and CHD8-in multiple cell lines from different donors, using single-cell RNA-sequencing (scRNA-seq) analysis of more than 745,000 cells and proteomic analysis of individual organoids, to identify phenotypic convergence. Each of the three mutations confers asynchronous development of two main cortical neuronal lineages-γ-aminobutyric-acid-releasing (GABAergic) neurons and deep-layer excitatory projection neurons-but acts through largely distinct molecular pathways. Although these phenotypes are consistent across cell lines, their expressivity is influenced by the individual genomic context, in a manner that is dependent on both the risk gene and the developmental defect. Calcium imaging in intact organoids shows that these early-stage developmental changes are followed by abnormal circuit activity. This research uncovers cell-type-specific neurodevelopmental abnormalities that are shared across ASD risk genes and are finely modulated by human genomic context, finding convergence in the neurobiological basis of how different risk genes contribute to ASD pathology.


Conflict of interest statement

Competing Interest Statement

P.A. is a SAB member at System 1 Biosciences and Foresite Labs, and is a co-founder of Serqet. A.R. is a founder and equity holder of Celsius Therapeutics, an equity holder in Immunitas Therapeutics and until August 31, 2020 was a SAB member of Syros Pharmaceuticals, Neogene Therapeutics, Asimov and Thermo Fisher Scientific. From August 1, 2020, A.R. is an employee of Genentech. N.E.S. is an advisor to Vertex and Qiagen.

Figures

Extended Data Fig. 1.
Extended Data Fig. 1.. Cortical organoids cultured for one, three and six months generate the cellular diversity of the human cerebral cortex with high organoid-to-organoid reproducibility
a, scRNA-seq and immunohistochemistry analysis of organoids cultured for one month (32 d.i.v.), three months (98 d.i.v.), and six months (190 d.i.v.). Left, t-SNE plots (n = 3 organoids per timepoint, co-clustered). Cells are colored by cell-type. Right, immunohistochemistry for specific markers. Neural progenitor marker SOX2 (magenta) and postmitotic neuronal marker TBR1 (green) are shown at one month. CPN marker SATB2 (magenta) and CFuPN marker CTIP2 (green) are shown at three months. The astroglia markers S100B (magenta) and GFAP (green) are shown at six months. Below, schematic images of brain organoids in each timepoint. Scale bars are 100 μm. b, Immunohistochemistry for neuronal (MAP2), dorsal forebrain neural progenitor (EMX1, SOX2), CFuPN (CTIP2), and CPN (SATB2) markers in GM08330 organoids at one, three, and six months. Scale bars: whole organoids (leftmost column), 200 μm; others, 50 μm. c, Immunohistochemistry for cell-type specific markers in Mito210 organoids, as in b. d, Top, t-SNE plots of the scRNA-seq data from individual replicates from three organoids at one month, three organoids at three months, and three organoids at six months from the GM08330 cell line shown in b. Bottom, bar charts showing the cell-type composition of each individual organoid. On top of the bar charts, mutual information (MI) scores between cell-type proportions and organoid identities are displayed. A MI score of 0 would indicate identical cell type proportions between organoids, while a score of 1 would indicate completely divergent profiles. In previous work, MI scores for endogenous brain datasets were reported to range from 0.008 to 0.0649. e, scRNA-seq data of organoids from the Mito210 cell line at one month (35 d.i.v.), three months (92 d.i.v.), and six months (178 d.i.v.), as in d. Organoids for the one and three month timepoints are the same as the control organoids in Extended Data Fig. 4f and Extended Data Fig. 5b. f, Expression of selected marker genes used in cell-type identification. Violin plots show distribution of normalized expression in cells from GM08330 organoids at one, three and six months (n = 3 individual organoids per timepoint). g, Expression of marker genes in Mito210 organoids, as in f. Number of organoids used for each analysis can be found in the (Methods under “Statistics and reproducibility”. aRG, apical radial glia; DL, deep layer; UL, upper layer; PN, projection neurons; oRG, outer radial glia; IPC, intermediate progenitor cells; CPN, callosal projection neurons; CFuPN, corticofugal projection neurons; GABA INP, GABAergic interneuron progenitors; GABA IN, GABAergic interneurons.
Extended Data Fig. 2.
Extended Data Fig. 2.. Expression of selected ASD risk genes in cortical organoids cultured for one, three, and six months
a, t-SNE plots of 58,568 cells from nine organoids from the GM08330 cell line, shown in Extended Data Fig. 1d, after Harmony batch correction. Cells are colored according to cell-type (left) and timepoint (right). b, Gene set expression scores for a set of 102 genes associated with ASD risk across cell-types, in cells from a. Scores above 0 indicate enriched expression over similar sets of randomly chosen genes. c, t-SNE plots showing normalized expression of selected ASD risk genes in cells from a. d, Average expression of 102 genes associated with ASD risk across cell-types and timepoints in the GM08330 cell line. e, t-SNE plots of nine organoids from the Mito210 cell line, shown in Extended Data Fig. 1e, after Harmony batch correction. Cells are colored according to cell-type (left) or timepoint (right). f, Gene set scores for the set of ASD risk genes as in b, in cells from e. Scores above 0 indicate higher expression than similar modules of randomly chosen genes. g, t-SNE plots showing normalized expression of selected ASD risk genes in cells from e. h, Expression of 102 genes associated with ASD risk across cell-types and timepoints in Mito210 cell line. RG, radial glia (aRG, oRG, and oRG/Astroglia), IPC, intermediate progenitor cells; CPN, callosal projection neurons; CFuPN, corticofugal projection neurons; EN, Excitatory neurons (CPN, CFuPN and PN); GABA IN, GABAergic interneurons.
Extended Data Fig. 3.
Extended Data Fig. 3.. Generation and characterization of SUV420H1, ARID1B, and CHD8 mutant organoids
a, Protein domain structure of SUV420H1. Arrow indicates the region (N-domain) mutated in the Mito210, PGP1 and Mito294 parental lines (bottom). b, Protein domain structure of ARID1B. Arrow indicates the region before the ARID domain mutated in the Mito210 and Mito294 parental lines (bottom). c, Protein domain structure of CHD8. Arrows indicates the helicase C-terminal (HELC) domain mutated in the HUES66, H1, GM08330, Mito294 and Mito210 lines (bottom). d-f, Western blot analysis showing presence of SUV420H1 (d), ARID1B (e) and CHD8 (f) protein expression in control lines, and its reduction in the mutant lines. Molecular weight in kDa is shown on the left of the gel. H4K20me3, a target of SUV420H1 activity, and total levels of histone H4 were also detected in control and in SUV420H1+/− lines (d). ARID1B was not detectable in Mito294 even with a longer exposure of the blotted membrane (e, right). Asterisks indicate the bands used for quantification. Bottom, protein levels in control and mutant lines were quantified and normalized for housekeeping genes β-Actin or GAPDH. For gel source data, see Supplementary Figure 1. g, Immunohistochemistry for neuronal (MAP2), dorsal forebrain neural progenitor (EMX1, SOX2) and CFuPN (CTIP2) markers in organoids at 35 d.i.v. derived from the Mito210 SUV420H1+/−, Mito210 ARID1B+/− and HUES66 CHD8+/− and isogenic control cell lines. Scale bar, 300 μm. h-j, Size quantification of control and SUV420H1+/− (h), ARID1B1+/− (i) and CHD8+/− (j) organoids across lines and at different timepoints. The ratio of organoid size compared to the average of control organoids in each batch is plotted. Differentiation batch (b.) is indicated by the shade of the points. Lower and upper hinges correspond to the first and third quartiles (the 25th and 75th percentiles) and middle hinge is the median (50th). Both whiskers extends from the hinge to the largest or smallest value no further than 1.5 * IQR from the hinge (where IQR is the inter-quartile range, or distance between the first and third quartiles). P-values from a two-sided t-test, after Bonferroni adjustment within each mutation. Number of organoids and differentiations used for the measurement are summarized in Supplementary Table 2 and in the (Methods under “Statistics and reproducibility”.
Extended Data Fig. 4.
Extended Data Fig. 4.. Cell-type composition of SUV420H1+/− and isogenic control organoids
a, Immunohistochemistry of Mito210 SUV420H1+/− and control organoids cultured for one month (35 d.i.v.). Optical section from the middle of whole-organoid dataset. Scale bars are 500 μm. SOX2, a marker of neuronal progenitors, is shown in red, and nuclei (Syto16) are shown in blue. b, Immunohistochemistry for the postmitotic excitatory neuronal marker TBR1 and GABAergic marker DLX2 in Mito294 control and SUV420H1+/− organoids at one month (35 d.i.v.). Scale bars: 200 μm. c-e, scRNA-seq data from one month (Mito294 35d.i.v. (c), PGP1 35 d.i.v. (d) and Mito210 28 d.i.v., batch I (e)) control and SUV420H1+/− organoids. Bar charts show the percentage of cells for all the cell populations in each control and mutant organoid. Adjusted p-values for a difference in cell type proportions between control and mutant, based on logistic mixed models (see Methods) are shown. f, scRNA-seq data from Mito210 35 d.i.v. (batch II) control and SUV420H1+/− organoids. Left top shows combined t-SNE plots of control and mutant organoids (n = 3 single organoids per genotype). Cells are colored by cell-type, and the total number of cells per plot is indicated. Left bottom, t-SNE plots for control and mutant individual organoids. Immature deep-layer projection neuron populations are highlighted in color. Right, bar charts show the percentage of cells for all the cell populations in each control and mutant organoid, as in c-e. g, Enriched gene ontology terms for genes upregulated and downregulated in SUV420H1+/− vs. control across lines. Genes were calculated using cells from the partition of interest. The top 5 most significant terms per dataset are shown. Size of dot indicates the proportion of genes belonging to each term found in the list of dysregulated genes (“GeneRatio”). Color indicates enrichment adjusted p-value. Numbers in parentheses along the y axis indicate the number of differentially expressed genes in that dataset. As control, we calculated GO term enrichment for 100 random gene sets of the same size sampled from genes expressed in each dataset, and found no significant enrichment of these terms (see Methods). Number of organoids used for each analysis can be found in the (Methods under “Statistics and reproducibility”. aRG, apical radial glia; DL, deep layer; UL, upper layer; PN, projection neurons; oRG, outer radial glia; IPC, intermediate progenitor cells; CPN, callosal projection neurons; CFuPN, corticofugal projection neurons; GABA N, GABAergic neurons.
Extended Data Fig. 5.
Extended Data Fig. 5.. Cell-type composition, full pseudotime trajectories, and gene modules in SUV420H1+/− and isogenic control organoids
a-c, scRNA-seq data from three month Mito294 89 d.i.v. (a), Mito210 92 d.i.v. batch I (b), and 90 d.i.v. batch II (c) control and SUV420H1+/− organoids. Left top shows combined t-SNE plots of control and mutant organoids (n = 3 single organoids per genotype). Cells are colored by cell type, and the number of cells per plot is indicated. Left bottom, t-SNE plots for control and mutant individual organoids. Cell-types of interest are highlighted in color. Right, bar charts show the percentage of cells for all the cell populations in each control and mutant organoid. Adjusted p-values for a difference in cell type proportions between control and mutant, based on logistic mixed models (see Methods) are shown. d, Pseudotime trajectory from the full dataset of Mito210 SUV420H1+/− 35 d.i.v. (batch II) and control organoids, calculated with Monocle3. The partition highlighted by a box was subsetted and the trajectory is shown in Fig. 1d. e, Module scores (top) and their distribution across mutant and control cells (bottom) for all modules resulting from WGCNA analysis of the partition of interest from Mito210 SUV420H1+/− and control organoids at 35 d.i.v. (batch II). Cells were downsampled to have an equal number of cells per organoid. Names were assigned to each module based on the known functions of the genes included in each one. Horizontal bars show median scores, and dots show average score per organoid. Adjusted p-values show differences between control and mutant based on linear mixed models (see Methods). aRG, apical radial glia; DL, deep layer; UL, upper layer; PN, projection neurons; CP/CH, Choroid Plexus/Cortical Hem; oRG, outer radial glia; IPC, intermediate progenitor cells; CPN, callosal projection neurons; CFuPN, corticofugal projection neurons; GABA INP, GABAergic interneuron progenitors; GABA IN, GABAergic interneurons; GABA N, GABAergic neurons.
Extended Data Fig. 6.
Extended Data Fig. 6.. scATAC-seq analysis in SUV420H1+/− and isogenic control organoids
a, UMAPs of scATAC-seq data in Mito210 SUV420H1+/− and control organoids at one month (31 d.i.v., upper left) and three months (93 d.i.v., upper right), and coembedded UMAPs with scRNA-seq in Mito210 SUV420H1+/− and control organoids at one month (28 d.i.v., middle bottom left) and three months (90 d.i.v., middle bottom right). Number of nuclei per plot is indicated. b, Enriched gene ontology terms for the nearest genes to regions with increased and decreased accessibility in SUV420H1+/− compared to control organoids. c, Genome tracks showing read coverage for representative regions with increased accessibility between SUV420H1+/− and control organoids. Scales for the y axes (normalized counts) are displayed on the top right. d, Genome tracks showing read coverage for representative regions with increased accessibility between Mito210 SUV420H1+/− and control organoids, split by cell-type. Scales for the y axes (normalized counts) are displayed on the top right. e, Top 5 de novo motifs enriched in the regions with altered accessibility in Mito210 SUV420H1+/− compared to control organoids at one month (31 d.i.v.) and three months (93 d.i.v.), as calculated with HOMER (see Methods). Regions that showed increased accessibility in mutant compared to control organoids are in green and purple, while those with decreased accessibility are in red and blue. Transcription factors with known binding sites resembling the discovered motifs are shown.
Extended Data Fig. 7.
Extended Data Fig. 7.. Neuronal spontaneous activity in SUV420H1+/− and isogenic control organoids
a, Left, Representative image of a PGP1 SUV420H1 organoid infected with SomaGCaMP6f2. Right, ΔF/F signal at the peak of a network burst. Scale bar: 100 μm. b, Heat map of calcium signal from individual cells (rows), showing the effect of 2 μM TTX. c, Top, representative trace of spontaneous calcium signal (corresponding to cell #3 in Fig. 1g). Bottom, high magnification traces of calcium transients, displaying the difference in amplitude between the isolated event and the network burst (top), and normalized traces (bottom) showing their kinetics and the multiple peaks of the burst signal. d, MEA recordings. Top, Spatial configuration of recording electrodes. Middle, example raw traces for the numbered electrodes shown at the top, and the effect upon 2 μM TTX application. Yellow columns indicate the network bursts. Right, individual (grey) and average (color) spike waveforms for each electrode. High magnification of the trace #4 showing the individual spikes (asterisk) during a burst event. Bottom, average spike waveform (right) in a unit of electrodes (left), extracted at the time points determined by the spikes in electrode #4. e-f, Synchronous network activity in human brain organoids. Heatmap of cross-correlation index (e) and cross-correlogram against a reference signal (cell #135) for a representative recording. As a control, the signal of 10 cells were circularly shifted by a random phase and the cross-correlation was then calculated. In f, the average value was plotted, and the synchronous activations as well as the periodic bursting can be seen (“All cells” in red). g, Effect of NBQX on neuronal activity. Representative traces for individual cells were normalized (3 traces for SUV420H1+/− are superimposed) and post-NBQX residual/isolated calcium transients are indicated by asterisks. h, Effect of NBQX on calcium signal. Heatmap of ΔF/F signal for 15 representative cells in control (top) and SUV420H1+/− (bottom) organoids. i-j, Inter-spike interval (ISI) analysis for the network bursting. Relative frequency (top) and cumulative frequency distribution (bottom) of ISI for control and SUV420H1+/− organoids. In j, two-sided Kolmogorov-Smirnov test (n = 5 organoids per genotype). Number of organoids used for each analysis can be found in the (Methods under “Statistics and reproducibility”.
Extended Data Fig. 8.
Extended Data Fig. 8.. Cell-type composition, full pseudotime trajectories, and gene modules of ARID1B+/− and isogenic control organoids
a, Immunohistochemistry for the postmitotic excitatory neuronal marker TBR1 (magenta) and GABAergic marker DLX2 (green) in Mito210 control and ARID1B+/− organoids at one month (35 d.i.v.). Scale bars: 200 μm. b-c, scRNA-seq data from Mito210 one month (35 d.i.v. batch I in b, batch II in c) control and ARID1B+/− organoids. Bar charts show the percentage of cells for all the cell populations in each control and mutant organoid. Adjusted p-values for a difference in cell-type proportions between control and mutant, based on logistic mixed models (see Methods) are shown. d, Immunohistochemistry for TBR1 (magenta) and DLX2 (green) in Mito210 control and ARID1B+/− organoids at three months (90 d.i.v.). Scale bars: 100 μm. e, scRNA-seq data from Mito210 three months (90 d.i.v.) control and ARID1B+/− organoids. Left top shows combined t-SNE plots of control and mutant organoids (n = 3 single organoids per genotype). Cells are colored by cell-type, and the number of cells per plot is indicated. Left bottom, t-SNE plots for control and mutant individual organoids. GABAergic interneurons are highlighted in color. Left, bar charts show the percentage of cells for all the cell populations in each control and mutant organoid, as shown in b-c. Two out of three mutant organoids show an increase in GABAergic interneurons, vs. zero out of three controls (adjusted p = 0.19, logistic mixed models). f, Immunohistochemistry for the postmitotic excitatory neuronal marker TBR1 (magenta) and GABAergic marker DLX2 (green) in Mito210 control and ARID1B+/− organoids at three months (90 d.i.v.). Three out of four mutant organoids contain DLX2-positive cells, while no DLX2 expression is detected in the four controls. Scale bars: 500 μm. g, scRNA-seq data from Mito294 one month (35 d.i.v.) ARID1B+/− and control organoids. Left top shows combined t-SNE plots of control and mutant organoids (n = 3 single organoids per genotype). Cells are colored by cell type, and the number of cells per plot is indicated. Left bottom, t-SNE plots for control and mutant individual organoids. GABAergic neurons, newborn deep-layer projection neurons and immature deep-layer projection neuron populations are highlighted in color. Right, bar charts show the percentage of cells for all the cell populations in each control and mutant organoid, as in b-c. h, Pseudotime trajectories from the full dataset of Mito210 ARID1B+/− 35 d.i.v. batch II and control organoids, calculated with Monocle3. The partition highlighted by a box was subsetted and the trajectory is shown in Fig. 2c. i, Module scores (top) and their distribution across mutant and control cells (bottom) for all modules resulting from WGCNA analysis of the partition of interest from Mito210 ARID1B1+/− and control organoids at 35 d.i.v. Cells were downsampled to have an equal number of cells per organoid. Names were assigned to each module based on the known functions of the genes included in each one. Horizontal bars show median scores, and dots show average score per organoid. Adjusted p-values show differences between control and mutant based on linear mixed models (see Methods). Number of organoids used for each analysis can be found in the (Methods under “Statistics and reproducibility”. aRG, apical radial glia; DL, deep layer; UL, upper layer; PN, projection neurons; CP/CH, Choroid Plexus/Cortical Hem; oRG, outer radial glia; IPC, intermediate progenitor cells; CPN, callosal projection neurons; CFuPN, corticofugal projection neurons; GABA NP, GABAergic neuron progenitors; GABA N, GABAergic neurons; GABA INP; GABAergic interneuron progenitors; GABA IN, GABAergic interneurons.
Extended Data Fig. 9.
Extended Data Fig. 9.. Cell-type composition, immunohistochemistry, and full pseudotime trajectories and gene modules of CHD8+/− and isogenic control HUES66 organoids
a-b, scRNA-seq data from HUES66 3.5-month (109 d.i.v. (a), batch I and 107 d.i.v. (b). batch II) CHD8+/− and control organoids. Bar charts show the percentage of cells for all the cell populations in each control and mutant organoid. Adjusted p-values for a difference in cell-type proportions between control and mutant, based on logistic mixed models (see Methods) are shown. c, Immunohistochemistry for the postmitotic excitatory neuronal marker TBR1 (magenta) and GABAergic marker DLX2 (green) in HUES66 control and CHD8+/− organoids at 3.5 months (107 d.i.v.). Scale bars: 100 μm. d, Immunohistochemistry for neuronal (MAP2), dorsal forebrain neural progenitor (EMX1, SOX2) and CFuPN (CTIP2) markers in HUES66 CHD8+/− and control organoids at 3.5 months (107 d.i.v., top), and six months (190 d.i.v., bottom). Scale bars: whole organoids, 500 μm; others, 100 μm. e, scRNA-seq data from HUES66 CHD8+/− and control organoids at six months (190 d.i.v.). Top left shows combined t-SNE plots of control and mutant organoids (n = 3 single organoids per genotype). Cells are colored by cell-type, and the number of cells per plot is indicated. Top right, t-SNE plots for control and mutant individual organoids. GABAergic interneurons are highlighted in color. Bottom, bar charts show the percentage of cells for all the cell populations in each control and mutant organoid, as in a-b. f, Immunohistochemistry for the post mitotic neuronal marker TBR1 (magenta) and GABAergic marker DLX2 (green) in HUES66 control and CHD8+/− organoids at six months (190 d.i.v.). Scale bars: 100 μm. g, Pseudotime trajectories from the full dataset of HUES66 batch I CHD8+/− and control organoids at 109 d.i.v., calculated with Monocle3. The partition highlighted by a box was subsetted and the trajectory is shown in Fig. 3c. h, Module scores (top) and their distribution across mutant and control cells (bottom) for all modules resulting from WGCNA analysis of the partition of interest from HUES66 CHD8+/− and control organoids at 109 d.i.v. Cells were downsampled to have an equal number of cells per organoid. Names were assigned to each module based on the known functions of the genes included in each one. Horizontal bars show median scores, and dots show average score per organoid. Adjusted p-values show differences between control and mutant based on linear mixed models (see Methods). Number of organoids used for each analysis can be found in the (Methods under “Statistics and reproducibility”. aRG, apical radial glia; DL, deep layer; UL, upper layer; PN, projection neurons; oRG, outer radial glia; IPC, intermediate progenitor cells; CPN, callosal projection neurons; CFuPN, corticofugal projection neurons; GABA INP, GABAergic interneuron progenitors; GABA IN, GABAergic interneurons.
Extended Data Fig. 10.
Extended Data Fig. 10.. Bulk RNA-seq and scRNA-seq of CHD8+/− and isogenic control organoids from multiple cell lines
a, Bulk RNA-seq data from HUES66, GM83330 and H1 35 d.i.v. organoids. Enriched gene ontology terms for genes differentially expressed in CHD8+/− vs. control organoids. The top 5 most significant terms per dataset are shown. Size of dot indicates the proportion of genes belonging to each term found in the list of dysregulated genes (“GeneRatio”). Color indicates enrichment adjusted p-value. Numbers in parentheses along the y axis indicate the number of differentially expressed genes in that dataset. b-d, scRNA-seq data from control and CHD8+/− organoids at 3.5 months (GM83330 108 d.i.v., batch I (b), GM83330 108 d.i.v., batch II (c) and H1 105 d.i.v. (d)). Left top shows combined t-SNE plots of control and mutant organoids (n = 3 single organoids per genotype). Cells are colored by cell type, and the number of cells per plot is indicated. Left bottom, t-SNE plots for control and mutant individual organoids. GABAergic interneurons are highlighted in color. Right, bar charts show the percentage of cells for all the cell populations in each control and mutant organoid. Adjusted p-values for a difference in cell-type proportions between control and mutant, based on logistic mixed models (see Methods) are shown. aRG, apical radial glia; DL, deep layer; UL, upper layer; PN, projection neurons; CP/CH, Choroid Plexus/Cortical Hem; oRG, outer radial glia; IPC, intermediate progenitor cells; CPN, callosal projection neurons; CFuPN, corticofugal projection neurons; GABA INP, GABAergic interneuron progenitors; GABA IN, GABAergic interneurons; GABA N, GABAergic neurons.
Extended Data Fig. 11.
Extended Data Fig. 11.. Convergent differential expressed genes for the three mutations
a, Log fold change of all genes which showed significant change (adjusted p < 0.05) in all three of the 1 month datasets: Mito210 SUV420H1+/− 35 d.i.v., Mito210 ARID1B+/− 35 d.i.v., and HUES66 CHD8+/− 35 d.i.v. Differentially expressed genes were calculated using all cells as a pseudobulk for Mito210 SUV420H1+/− and Mito210 ARID1B+/−. b, Differential expression of all 102 genes associated with ASD risk in the three datasets Mito210 SUV420H1+/− 35 d.i.v., Mito210 ARID1B+/− 35 d.i.v. and in HUES66 CHD8+/− 35 d.i.v. compared to relative controls. Expression of risk genes was calculated using all cells (pseudobulk) for Mito210 SUV420H1+/− and Mito210 ARID1B+/−. Boxes are colored according to −log10(adjusted p value) according to whether they are upregulated (purple), or downregulated (turquoise) in mutant vs. control. Genes are ordered according to hierarchical clustering (using Euclidean distance) of those values. c-d, Enriched gene ontology terms for genes upregulated (c) and downregulated (d) in mutant vs. control. Genes were calculated using the cells as in a-b. The top 5 most significant terms per dataset are shown. Size of dot indicates the proportion of genes belonging to each term found in the list of dysregulated genes (“GeneRatio”). Color indicates enrichment adjusted p-value. Numbers in parentheses along the x axis indicate the number of differentially expressed genes in that dataset.
Extended Data Fig. 12.
Extended Data Fig. 12.. Convergent differentially expressed proteins for the three mutations
a-c, Volcano plot showing fold change versus adjusted p-value of measured proteins in MS experiments on Mito210 SUV420H1+/− (a), Mito210 ARID1B+/− (b), and HUES66 CHD8+/− (c) vs. control organoids at 35 d.i.v. (n = 4 single organoids per genotype for SUV420H1, 4 controls and 5 mutants for ARID1B, and n = 3 single organoids per genotype for CHD8). To detect statistically significant differential protein abundance between conditions a moderated t-test was performed (see Methods, FDR threshold of 0.1). Significant DEPs are shown in red (FDR < 0.1). d-f, Selected enriched gene ontology terms for DEPs in Mito210 SUV420H1+/− (d), Mito210 ARID1B+/− (e), and HUES66 CHD8+/− (f) vs. control organoids cultured for 35 d.i.v. GO terms and KEGG pathways were calculated using the GSEA software (see Methods) and FDR q-values < 0.05 were considered statistically significant. g, Protein-protein interaction network using the top 50 DEPs from the three sets of mutant versus control organoids, created using the prize-collecting Steiner forest algorithm (see Methods). Protein nodes are colored by the mutant in which they were differentially expressed. Gray nodes indicate “Steiner nodes”, proteins that did not result from any screen but were included by the algorithm to connect DEPs. Lines between nodes indicate physical protein-protein interactions from the STRING database, where line thickness correlates with interaction confidence. Subclusters of the network and significantly enriched terms for those subclusters are highlighted with gray rectangles and black text. h, Protein set distances between pairs of differentially expressed protein sets. For each pair of mutations, a PPI-weighted protein set distance was calculated between all significant DEPs (FDR < 0.1, pink diamond). To determine if this distance was smaller than would be expected by chance, size-matched sets were randomly chosen from the proteins detected in each experiment, and distance between these random sets was calculated 1000 times per pair. P-values were assigned by counting the fraction of times this random distance was less than the actual distance value between differential sets. Lower and upper hinges correspond to the first and third quartiles (the 25th and 75th percentiles) and middle hinge is the median (50th). Both whiskers extends from the hinge to the largest or smallest value no further than 1.5 * IQR from the hinge (where IQR is the inter-quartile range, or distance between the first and third quartiles). i, Protein set distances between the top 50 DEPs per mutation. For each pair of mutations, a PPI-weighted protein set distance was calculated as in h. Number of organoids used for the analyzes are summarized in the (Methods under “Statistics and reproducibility”. DEPs: differentially expressed proteins. MS: mass spectrometry.
Extended Data Fig. 13.
Extended Data Fig. 13.. Mutations in ASD Risk Genes in Human Brain Organoids Converge on Asynchronous Development of Shared Neuronal Classes
Conceptual schematics highlighting main results.
Fig. 1.
Fig. 1.. SUV420H1+/− induces asynchronous generation of GABAergic neurons and deep-layer projection neurons, and changes in circuit activity
a-c, Combined t-SNE of all organoids (top left, with total cells per dataset) and percentage of indicated cell types per organoid (top right), color-coded by cell type. Adjusted p-values: difference in cell-type proportions between genotypes (logistic mixed models; Methods). Bottom, t-SNE for individual organoids, with cell types of interest colored. d-e, Pseudotime UMAP for indicated batch, color-coded by cell type (d), pseudotime (early, blue; late, yellow; e, left), or genotype (e, right). Insets: cells from dotted boxes, separated by genotype. f, Module of highly correlated genes in cells from d-e, showing UMAP plot of module scores (left) and score distribution across genotypes (right). Horizontal bars: median scores, dots: average score per organoid. Adjusted p-values: differences between control and mutant (linear mixed models; Methods). g-i, Calcium imaging of neuronal activity in intact organoids. g, Left, representative organoid transduced with SomaGCaMP6f2. Scale bar: 100 μm. Insets: high-magnification image of individual cells (1-3). Scale bar: 10 μm. Right, spontaneous calcium signal for each example cell as ΔF/F (top) and pseudocolor heatmap (bottom). h, Left, representative heatmaps of calcium signal per condition. Right, spontaneous network burst frequency. Dots: average values per organoid, bars: mean across all organoids. i, Left, population-averaged calcium transients (top) and heatmap for individual cells (bottom). Right, spontaneous network burst duration. Bar plot format as in h. aRG, apical radial glia; DL, deep layer; UL, upper layer; PN, projection neurons; oRG, outer radial glia; IPC, intermediate progenitor cells; CPN, callosal projection neurons; CFuPN, corticofugal projection neurons; GABA, GABAergic; NP, neuron progenitors; N, neurons; SUV, SUV420H1+/−.
Fig. 2.
Fig. 2.. ARID1B+/− induces asynchronous generation of GABAergic neurons and deep-layer projection neurons
a-b, Combined t-SNE of all organoids (top left), percentage of indicated cell-types per organoid (top right), and t-SNEs for individual organoids (bottom), as in Fig. 1a–c. c-d, Pseudotime UMAPs for indicated batch, as in Fig. 1d–e. e, Module of highly correlated genes by co-expression network analysis on cells in c-d, as in Fig. 1f. INP, interneuron progenitors; IN, interneurons; other cell-type abbreviations as in Fig. 1.
Fig. 3.
Fig. 3.. CHD8+/− leads to asynchronous generation of GABAergic interneurons
a-b, Combined t-SNE of all organoids (top left), percentage of indicated cell-types per organoid (top right), and t-SNEs for individual organoids (bottom), as in Fig. 1a–c. c-d, Pseudotime UMAPs for indicated batch, as in Fig. 1d–e. e, Module of highly correlated genes by co-expression network analysis on cells in c-d, as in Fig. 1f. INP, interneuron progenitors; IN, interneurons; other cell-type abbreviations as in Fig. 1.
Fig. 4.
Fig. 4.. SUV420H1+−, ARID1B+−, and CHD8+/− act through distinct gene targets
a, Overlap between the sets of differentially expressed genes (mutant vs. control) in individual cell types from the scRNA-seq datasets. Color and size of boxed circles indicates the significance of the number of overlapping genes between the corresponding cell populations (Bonferroni-adjusted p-value of a hypergeometric test). GABA IN, GABAergic interneurons; CP/CH, Choroid Plexus/Cortical Hem; other cell-type abbreviations as in Fig. 1.

Comment in

References

    1. Rosenberg RE et al. Characteristics and concordance of autism spectrum disorders among 277 twin pairs. Arch Pediatr Adolesc Med 163, 907–914 (2009). - PubMed
    1. Sanders SJ et al. De novo mutations revealed by whole-exome sequencing are strongly associated with autism. Nature 485, 237–241 (2012). - PMC - PubMed
    1. Ruzzo EK et al. Inherited and De Novo Genetic Risk for Autism Impacts Shared Networks. Cell 178, 850–866.e26 (2019). - PMC - PubMed
    1. Grove J et al. Identification of common genetic risk variants for autism spectrum disorder. Nat Genet 51, 431–444 (2019). - PMC - PubMed
    1. Satterstrom FK et al. Large-Scale Exome Sequencing Study Implicates Both Developmental and Functional Changes in the Neurobiology of Autism. Cell 180, 568–584.e23 (2020). - PMC - PubMed

Methods References

    1. Chen AE et al. Optimal timing of inner cell mass isolation increases the efficiency of human embryonic stem cell derivation and allows generation of sibling cell lines. Cell stem cell 4, 103–106 (2009). - PMC - PubMed
    1. Church GM The personal genome project. Molecular systems biology 1, 2005.0030–2005.0030 (2005). - PMC - PubMed
    1. Velasco S, Paulsen B & Arlotta P Highly reproducible human brain organoids recapitulate cerebral cortex cellular diversity. Protocol Exchange (2019).
    1. Lovell-Badge R et al. ISSCR Guidelines for Stem Cell Research and Clinical Translation: The 2021 update. Stem Cell Reports 16, 1398–1408 (2021). - PMC - PubMed
    1. Doench JG et al. Rational design of highly active sgRNAs for CRISPR-Cas9–mediated gene inactivation. Nature Biotechnology 32, 1262–1267 (2014). - PMC - PubMed

Publication types