. 2022 Feb:106:102649.
doi: 10.1016/j.jag.2021.102649.

Impacts of worldwide individual non-pharmaceutical interventions on COVID-19 transmission across waves and space

Affiliations

Impacts of worldwide individual non-pharmaceutical interventions on COVID-19 transmission across waves and space

Yong Ge et al. Int J Appl Earth Obs Geoinf. 2022 Feb.

Abstract

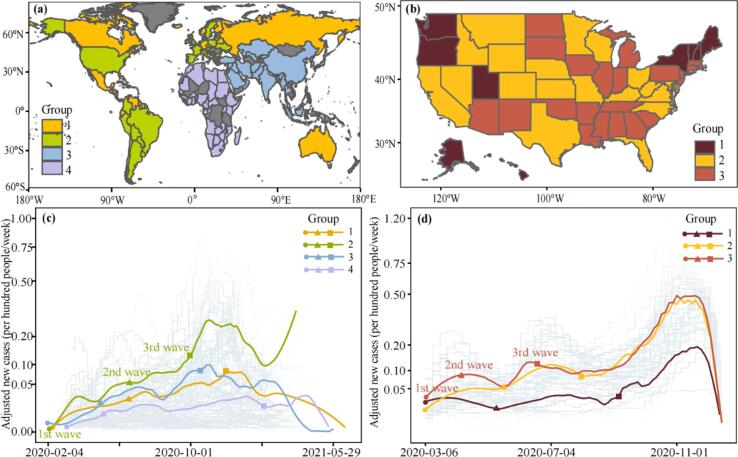
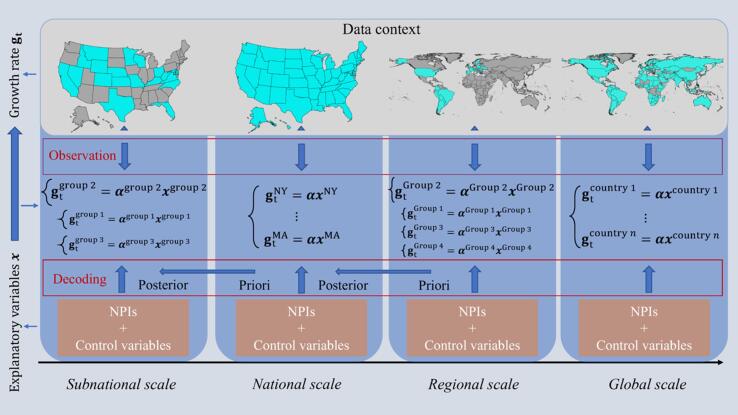
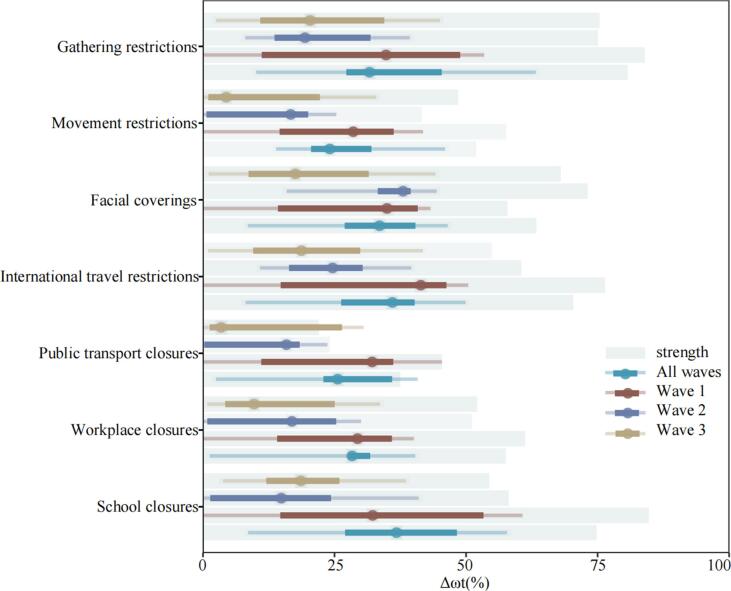
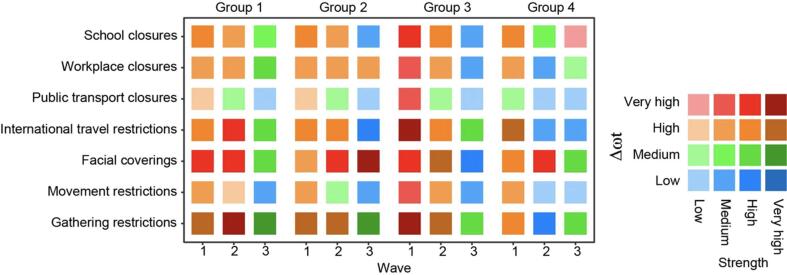
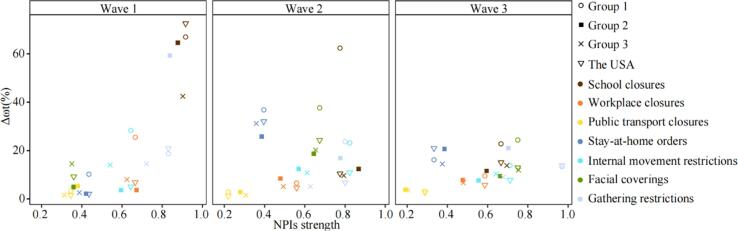
Governments worldwide have rapidly deployed non-pharmaceutical interventions (NPIs) to mitigate the COVID-19 pandemic. However, the effect of these individual NPI measures across space and time has yet to be sufficiently assessed, especially with the increase of policy fatigue and the urge for NPI relaxation in the vaccination era. Using the decay ratio in the suppression of COVID-19 infections and multi-source big data, we investigated the changing performance of different NPIs across waves from global and regional levels (in 133 countries) to national and subnational (in the United States of America [USA]) scales before the implementation of mass vaccination. The synergistic effectiveness of all NPIs for reducing COVID-19 infections declined along waves, from 95.4% in the first wave to 56.0% in the third wave recently at the global level and similarly from 83.3% to 58.7% at the USA national level, while it had fluctuating performance across waves on regional and subnational scales. Regardless of geographical scale, gathering restrictions and facial coverings played significant roles in epidemic mitigation before the vaccine rollout. Our findings have important implications for continued tailoring and implementation of NPI strategies, together with vaccination, to mitigate future COVID-19 waves, caused by new variants, and other emerging respiratory infectious diseases.

Keywords: Big data; COVID-19; Effectiveness; Multi-scale; Non-pharmaceutical interventions.


Conflict of interest statement

The authors declare that they have no known competing financial interests or personal relationships that could have appeared to influence the work reported in this paper.

Figures

Fig. 1
Fig. 1
The different groups in (a) and (b) were determined by pandemic parameters and geographic proximity (see SI for more information). (c) - (d) The pandemic trajectories of weekly reporting cases for each country/state (background polylines) and group (solid curves). The solid curves for each group are mean weekly cases across countries/states in that group. Starting points (represented by different marks) of different waves in each group are generally illustrated by their mean starting dates which were quantitatively defined in this study. A full list of countries in each group and the corresponding time frame of different waves of COVID-19 can be found in SI Table C1 – C4, C6 – C8.
Fig. 2
Fig. 2
The computational environmental settings for analysis from subnational scale to global scale. We used growth rate as the outcome variable to describe the trajectory of the pandemic. The empirical changes of growth rate were decoded into the effectiveness of both NPIs as well as the control variables.
Fig. 3
Fig. 3
Effects of individual NPIs on reducing the transmission of COVID-19 across waves within our data context. The coefficients (αi) of NPIs parameters in different periods were calibrated by the default model setting with corresponding data contexts. The effect estimates were calculated by the coefficients of NPIs through 1-exp(-αixi¯), where xi¯ is the average strength of NPI implementation (represented by the background shadow). We rescaled the average strength by multiplying 100 to adapt the x-axis. The synergistic effectiveness of all NPIs (All waves: 92.3%, Wave 1: 95.4%, Wave 2: 79.9%, Wave 3: 56.0%) were nonlinear cumulative in terms of the individual effect by 1-xiexp(-αixi¯). The effect over all waves represents the average performance of NPIs against COVID-19 in 133 countries (Fig. 1(a)) before their vaccination by 22 June 2021. Wave 1 refers to the average performance of NPIs against COVID-19 in the first wave of the 133 countries. The specific periods of the first wave in 133 countries are not fully consistent, meaning that the first wave does not refer to a particular time but a general period of the first outbreak. The second wave refers to the periods starting from the second outbreak. %Δωt represents a decay ratio of the COVID-19 infection rate in each country. The 5th, 25th (Q1), 50th (median), 75th (Q3), and 95th percentiles of estimates of %Δωt are presented to indicate details of the variations. The uncertainty intervals of NPI effectiveness refer to the variance over corresponding data contexts.
Fig. 4
Fig. 4
The cross-wave and cross-group effects of individual NPIs. Effects of individual NPIs on reducing the transmission of COVID-19 across waves and groups are illustrated by different colours associated with their average implementation strength. The dark colour indicates higher strength, while the NPIs effects increased from low level (blue) to high level (red). A full list of countries and the corresponding time frames of different waves for each group can be found in SI Table C2 – C5. (For interpretation of the references to colour in this figure legend, the reader is referred to the web version of this article.)
Fig. 5
Fig. 5
The individual efficacy estimates of the seven NPIs for the USA and its subnational regions. Different NPIs are represented by different colours. The groups as well as the USA are demonstrated by different symbols. Full lists of states name in each group as well as their defined wave periods can be found in SI Table C6- C8.

References

    1. Aleta, A., Martin-Corral, D., y Piontti, A.P., Ajelli, M., Litvinova, M., Chinazzi, M., Dean, N.E., Halloran, M.E., Longini Jr, I.M., Merler, S., 2020. Modelling the impact of testing, contact tracing and household quarantine on second waves of COVID-19. Nat. Hum. Behav. 4, 964-971. - PMC - PubMed
    1. Aschwanden C. Five reasons why COVID herd immunity is probably impossible. Nature. 2021;591:520–522. - PubMed
    1. Baker R.E., Yang W., Vecchi G.A., Metcalf C., Grenfell B.T. Assessing the influence of climate on wintertime SARS-CoV-2 outbreaks. Nat. Commun. 2021;12 - PMC - PubMed
    1. Brauner, J.M., Mindermann, S., Sharma, M., Johnston, D., Salvatier, J., Gavenčiak, T., Stephenson, A.B., Leech, G., Altman, G., Mikulik, V., 2021. Inferring the effectiveness of government interventions against COVID-19. Science 371. - PMC - PubMed
    1. Care, T.D.A.o.H., 2021. Bed Capacity.

LinkOut - more resources