. 2022 Jan 17:12:760488.
doi: 10.3389/fimmu.2021.760488. eCollection 2021.

Exhausted and Apoptotic BALF T Cells in Proinflammatory Airway Milieu at Acute Phase of Severe Mycoplasma Pneumoniae Pneumonia in Children

Affiliations

Exhausted and Apoptotic BALF T Cells in Proinflammatory Airway Milieu at Acute Phase of Severe Mycoplasma Pneumoniae Pneumonia in Children

Xi Chen et al. Front Immunol. .

Abstract

Severe mycoplasma pneumoniae pneumonia (MPP) in children presents with serious clinical complications. Without proper and prompt intervention, it could lead to deadly consequences. Dynamics of the inflammatory airway milieu and activation status of immune cells were believed to be the hallmark of the pathogenesis and progress of the disease. In this study, by employing the T-cell sorting and mRNA microarray, we were able to define the main feature of the chemokine/cytokine expression and the unique characteristics of T cells in the bronchoalveolar lavage fluid (BALF) from severe MPP patients at acute phase. Our study for the first time delineated the molecular changes in isolated BALF T cells in severe MPP children with respect to the cytokine/chemokine expression, cell activation, exhaustion, and apoptosis. By comparing the BALF aqueous expression of cytokines/chemokines with that in sorted T cells, our data give a preliminary clue capable of finishing out the possible cell source of the proinflammatory cytokines/chemokines from the BALF mixture. Meanwhile, our data provide a distinctively pellucid expression profile particularly belonging to the isolated BALF T cells demonstrating that in the inflammatory airway, overactivated T cells were exhausted and on the verge of apoptotic progress.

Keywords: T cells; bronchoalveolar lavage fluid (BALF); cell exhaustion; children; mycoplasma pneumoniae pneumonia (MPP); proinflammatory milieu.


Conflict of interest statement

The authors declare that the research was conducted in the absence of any commercial or financial relationships that could be construed as a potential conflict of interest.

Figures
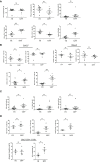
Figure 1
Figure 1
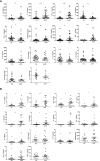
BALF cells from patients (MPP) and controls (FB) were stained with monoclonal antibodies conjugated with flourochrome. Cells were washed with PBS and then subjected to the analysis by a FACScalibur flow cytometry. Data were processed with Flowjo software. Every dot in the scatter plot indicates a patient or control sample. * p < 0.05; ** p < 0.01; *** p < 0.001; NS, no significant difference. (A) T-cell subgroups and CD4/8 ratio were represented as scatter plots. (B) Cytometric analysis of naive (CD45RA+) vs. memory (CD45RO+) in BALF and blood CD3+ cells, as well as the activation status (CD25+ and HLA-DR+) of BALF T cells (gating CD3+ population). (C) BALF cells were stimulated with TCR ligation by anti-CD3/CD28 in the presence of Golgi Stop. Intracellular cytokines (IFN-γ, IL-2, and TNF-α) expression was detected with corresponding flourochrome-conjugated antibody following cell perforation. (D) BALF cells from MPP patients and FB controls were stained with PD1, TIM3, and TIGIT; their ratio in CD3+ T-cell gate was represented (upper panels). BALF cells from MPP patients and FB controls were stained with annexin V and JC-1 for apoptosis analysis. The ratios of annexin V-positive cells and JC-1 monomer + cells in CD3+ T-cell gate were represented as dot plot.
Figure 2
Figure 2
The absolute concentration (pg/ml) of each indicated cytokine in (A) aqueous phase of BALF or in (B) serum was determined via Luminex xMAP technology by a calculation based on a standard curve generated from the quantification standards of each cytokine the manufacture provided. Student’s t-test was employed to analyze the difference of the cytokine concentration in (A) BALF between patient group (MPP) and control group (FB) and (B) in serum between patient (MPP) and control group (HC). * p < 0.05; ** p < 0.01; *** p < 0.001.
Figure 3
Figure 3
Based on the microarray mRNA chip results, the mRNA expression level were compared between patient BALF samples and FB control samples. Differentially expressed genes (DEGs) in BALF samples were subjected to Gene Ontology (GO) analysis. Cell functions these DEGs involved are categorized and ranked in a sequential order of relevance (upper bar to lower bar is from high to low). The left panel is the result from GO analysis of total BALF cells. The right panel is the result from GO analysis of sorted BALF CD3+ T cells.
Figure 4
Figure 4
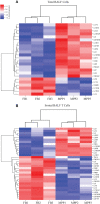
DEGs of chemokines from microarray results were represented as heat maps. Colors indicate relative expression levels. The gradient color from red to blue means expression of the listed gene from upregulation to downregulation. Gene names of DEGs are listed on the right. Similar pattern of expression are clustered closer with linked line. (A) The heat map for DEGs of chemokine gene in BALF cells. Each sample represents BALF cells from an individual patient or FB control. (B) The heat map for DEGs of chemokine gene in sorted CD3+ T cells. Each sample represents sorted CD3+ T cells from an individual patient or FB control.
Figure 5
Figure 5
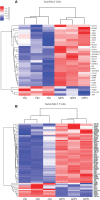
DEGs of cytokines from microarray results were represented as heat maps. Colors indicate relative expression levels. The gradient color from red to blue means expression of the listed gene from upregulation to downregulation. Gene names of DEGs are listed on the right. Similar pattern of expression are clustered closer with linked line. (A) The heat map for DEGs of cytokine gene in BALF cells. Each sample represents BALF cells from an individual patient or FB control. (B) The heat map for DEGs of cytokine gene in sorted CD3+ T cells. Each sample represents CD3+-sorted cells from an individual patient or FB control.
Figure 6
Figure 6
DEGs of apoptotic genes in patient-sorted BALF T cells generated from the comparison with sorted BALF T cells in FB controls were processed with KEGG for apoptosis pathway analysis. Upregulated genes were labeled with red color, downregulated green. Cluster of DEGs with common function that is exclusive in patient-sorted T cells are boxed with different colors. DEGs of ER stress are boxed with blue. Substrates of cleavage, such as cell skeleton genes, are boxed with purple. Proapoptotic genes for DNA damaging are boxed with yellow.
Figure 7
Figure 7
DEGs of T-cell activation and exhaustion derived from microarray data are represented as heat maps. Colors indicate relative expression levels. The gradient color from red to blue means expression of the listed gene from upregulation to downregulation. Gene names of DEGs are listed on the right. Similar pattern of expression are clustered closer with linked line. (A) The heat map for DEGs of T-cell activation and exhaustion gene in BALF cells. Each sample represents BALF cells from an individual patient or FB control. (B) The heat map for DEGs of T-cell activation and exhaustion in sorted CD3+ T cells. Each sample represents sorted CD3+ T cells from an individual patient or FB control.

Similar articles

Cited by

References

    1. Kutty PK, Jain S, Taylor TH, Bramley AM, Diaz MH, Ampofo K, et al. . Mycoplasma Pneumoniae Among Children Hospitalized With Community-Acquired Pneumonia. Clin Infect Dis (2019) 68:5–12. doi: 10.1093/cid/ciy419 - DOI - PMC - PubMed
    1. Yang M, Meng F, Gao M, Cheng G, Wang X. Cytokine signatures Associate With Disease Severity in Children With Mycoplasma Pneumoniae Pneumonia. Sci Rep (2019) 9:17853. doi: 10.1038/s41598-019-54313-9 - DOI - PMC - PubMed
    1. Zhao J, Li Y, Zhang W. The Clinical Significance of IL-6 s and IL-27 s in Bronchoalveolar Lavage Fluids From Children With Mycoplasma Pneumoniae Pneumonia. BMC Infect Dis (2020) 20:331. doi: 10.1186/s12879-020-05017-3 - DOI - PMC - PubMed
    1. Jin X, Zhu Y, Zhang Y, Chen J, Li R, Zhao X. Assessment of Levels of D-Dimer and Interferon-γ in Pediatric Patients With Mycoplasma pneumoniae pneumonia and its Clinical Implication. Exp Ther Med (2018) 16(6):5025–30. doi: 10.3892/etm.2018.6873 - DOI - PMC - PubMed
    1. Koh YY, Park Y, Lee HJ, Kim CK. Levels of Interleukin-2, Interferon-Gamma, and Interleukin-4 in Bronchoalveolar Lavage Fluid From Patients With Mycoplasma Pneumonia: Implication of Tendency Toward Increased Immunoglobulin E Production. Pediatrics (2001) 107(3):E39. doi: 10.1542/peds.107.3.e39 - DOI - PubMed

Publication types

MeSH terms

LinkOut - more resources