. 2022 Jan 17:12:787468.
doi: 10.3389/fimmu.2021.787468. eCollection 2021.

Human Leucocyte Antigen G and Murine Qa-2 Are Critical for Myeloid Derived Suppressor Cell Expansion and Activation and for Successful Pregnancy Outcome

Affiliations

Human Leucocyte Antigen G and Murine Qa-2 Are Critical for Myeloid Derived Suppressor Cell Expansion and Activation and for Successful Pregnancy Outcome

Stefanie Dietz et al. Front Immunol. .

Abstract

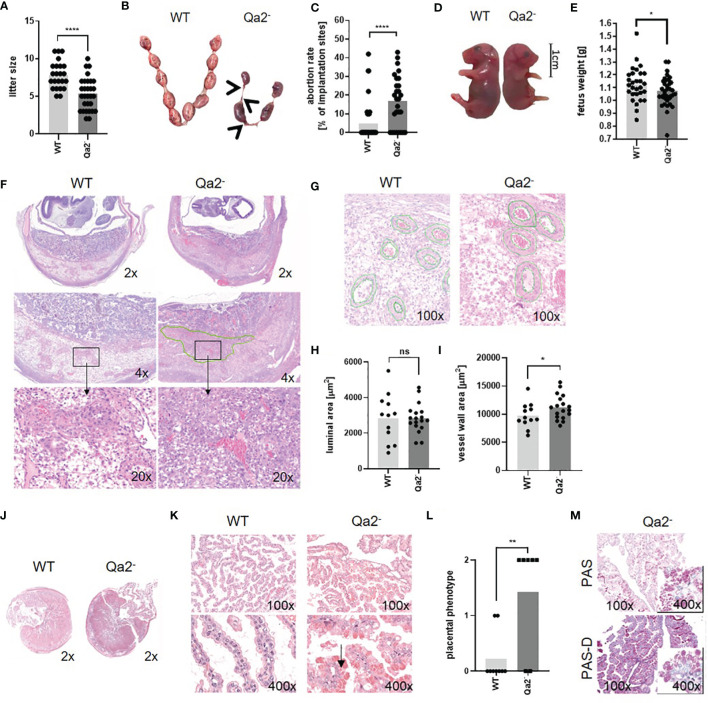
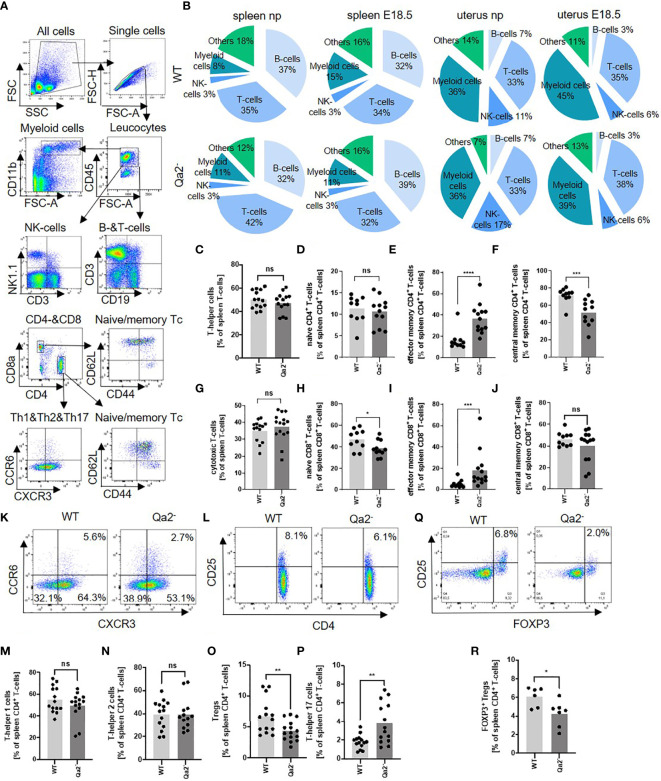
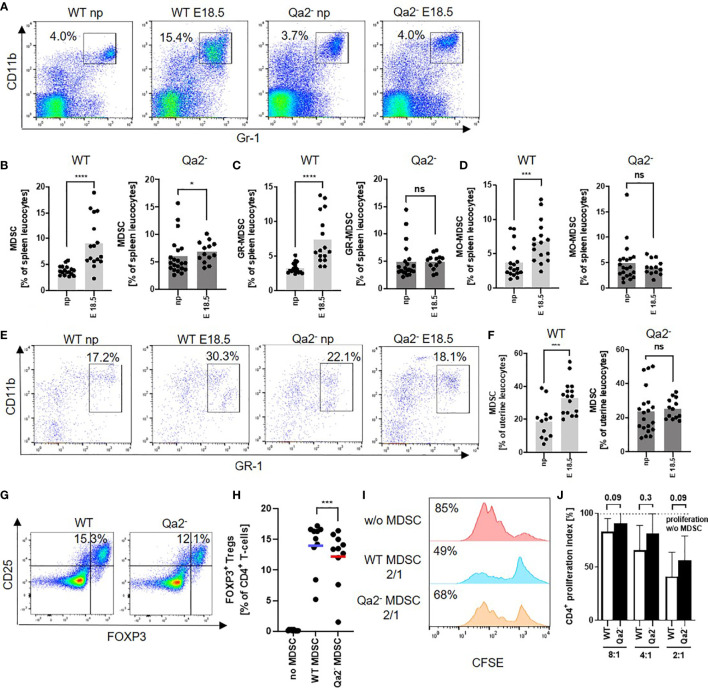
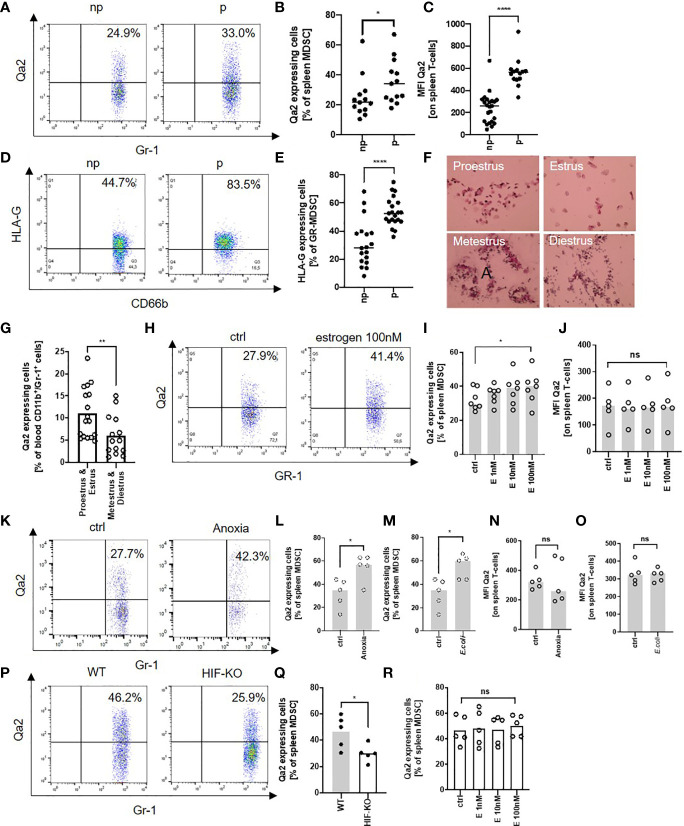
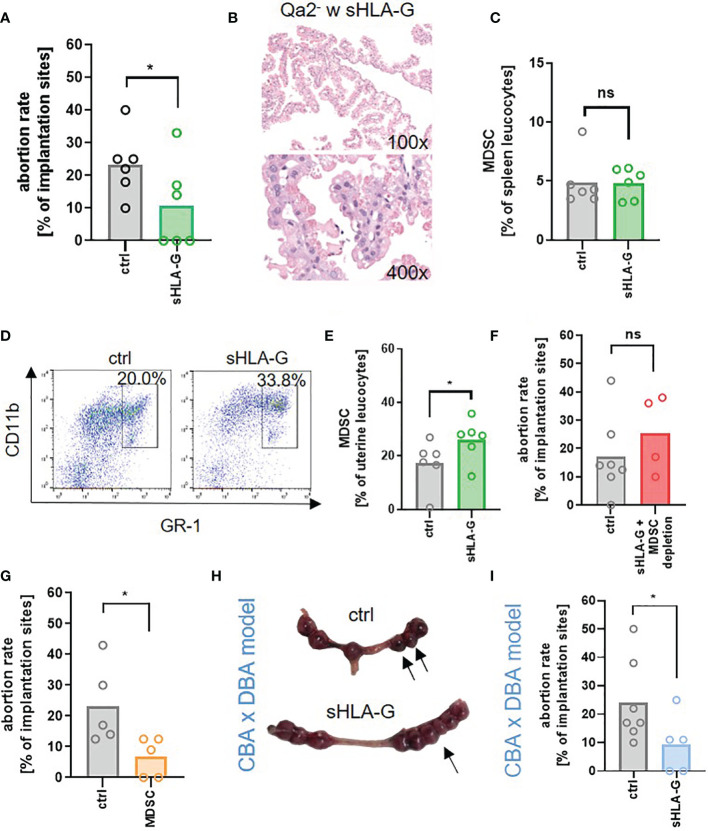
During pregnancy, maternal immune system has to balance tightly between protection against pathogens and tolerance towards a semi-allogeneic organism. Dysfunction of this immune adaptation can lead to severe complications such as pregnancy loss, preeclampsia or fetal growth restriction. In the present study we analyzed the impact of the murine MHC class Ib molecule Qa-2 on pregnancy outcome in vivo. We demonstrate that lack of Qa-2 led to intrauterine growth restriction and increased abortion rates especially in late pregnancy accompanied by a disturbed trophoblast invasion and altered spiral artery remodeling as well as protein aggregation in trophoblast cells indicating a preeclampsia-like phenotype. Furthermore, lack of Qa-2 caused imbalanced immunological adaptation to pregnancy with altered immune cell and especially T-cell homeostasis, reduced Treg numbers and decreased accumulation and functional activation of myeloid-derived suppressor cells. Lastly, we show that application of sHLA-G reduced abortion rates in Qa-2 deficient mice by inducing MDSC. Our results highlight the importance of an interaction between HLA-G and MDSC for pregnancy success and the therapeutic potential of HLA-G for treatment of immunological pregnancy complications.

Keywords: HLA-G; Qa-2; abortion; myeloid-derived suppressor cells; preeclampsia; pregnancy.


Conflict of interest statement

The authors declare that the research was conducted in the absence of any commercial or financial relationships that could be construed as a potential conflict of interest.

Figures

Figure 1
Figure 1
Phenotype of Qa-2- mice during pregnancy. Wildtype (WT) and Qa-2 deficient mice (Qa2-) were term-bred and the day when a vaginal plug was detected was defined as day E0.5. Mice delivered spontaneously and litter size was determined (A) or mice were euthanized at E18.5 and uteri containing feto-placental units were removed and inspected (B–E). Total implantation sides and resorbing units were counted and fetuses were weighed. (A) Litter size of spontaneous delivered WT (n=23) and Qa2- mice (n=30). (B) Representative uteri containing feto placental units from WT and Qa-2- mice at gestational day E18.5. Arrows show resorbing units. (C) Abortion rate (percentage of resorbed fetuses per litter) of WT (n=39) and Qa-2- mice (n=28) at E18.5. (D) Representative WT and Qa-2- fetuses at E18.5. (E) Weight of WT (n=29) and Qa-2- fetuses (n=35) at E18.5. (F–I) Mice were euthanized at E10.5, uterine arteries were ligated and spiral arteries were analyzed. (F) Representative images of H&E stained WT and Qa-2- uteri showing cross-section areas of placenta and decidua in different magnifications. The green line shows an area with unorganized trophoblast distribution within the Qa-2- decidua. (G) Representative images of H&E stained WT and Qa-2- uteri showing quantification of spiral artery wall and luminal area. (H) Luminal area of spiral arteries from WT (n=5) and Qa-2- animals (n=5). (I) Vessel wall area of spiral arteries from WT and Qa-2- animals. (J–M) Mice were euthanized at E18.5 and placentas were analyzed. (J) Representative images of H&E stained cross-section areas of WT and Qa-2-placentas. (K) Representative images of H&E stained chorionic villi from WT and Qa-2- placentas showing abnormal vacuoles with eosinophilic aggregates in trophoblasts of Qa-2- animals (arrow). (L) Grade of eosinophilic aggregation in trophoblasts of WT and Qa-2- animals. (M) Representative images of PAS and PAS-diastase stained chorionic villi from a Qa-2- placenta showing aggregates still present in PAS-diastase staining. Each symbol represents an individual mother (A, C, L)/fetus (E)/measurement (H+I) and the mean is indicated. ****p < 0.0001; **p < 0.01; *p < 0.05; ns, not significant. Mann-Whitney test (A, C, L) or unpaired t-test (E, H, I).
Figure 2
Figure 2
Immune cell composition in WT and Qa-2 deficient animals. Wildtype (WT) and Qa-2 deficient mice (Qa2-) were term-bred and the day when a vaginal plug was detected was defined as day E0.5. Spleen cells were analyzed by flow cytometry. (A) Gating strategy for gating immune cell subpopulations. (B) Proportions of the different cell types in spleens and uteri of non-pregnant (np) and E18.5 pregnant (E18.5) WT (upper diagrams, n=14-17 for np and n=16 for E18.5) and Qa-2- animals (lower diagrams, n=16-21 for npand n=12-13 for E18.5). (C–J) Percentages of all T-helper cells (C), naïve T-helper cells (D), effector memory T-helper cells (E), central memory T-helper cells (F), all cytotoxic T-cells (G), naïve cytotoxic T-cells (H), effector memory cytotoxic T-cells (I) and central memory cytotoxic T-cells (J) from all spleen leucocytes in WT (n=10-14) and Qa-2- animals (n=11-15). (K) Representative pseudocolor plots for CXCR3 versus CCR6 showing the populations of T-helper 1 cells (lower right quadrant), T-helper 2 cells (lower left quadrant) and T-helper 17 cells (upper left quadrant) in spleen leucocytes. Cells were pre-gated on CD45, CD3 and CD4. (L) Representative pseudocolor plots for CD4 versus CD25 showing the population of Treg cells in spleen leucocytes in the upper right quadrant. Cells were pre-gated on CD45 and CD3. (M-P) Percentages of all T-helper 1 cells (M), T-helper 2 cells (N), Treg cells (O) and T-helper 17 cells (P) from all spleen leucocytes in WT (n=10-14) and Qa-2- animals (n=11-15). (Q) Representative pseudocolor plots for Foxp3 versus CD25 showing the population of Foxp3+ Treg cells in spleen leucocytes in the upper right quadrant. Cells were pre-gated on CD45, CD3 and CD4. (R) Percentages of Foxp3 Treg cells from all spleen leucocytes in WT (n=6) and Qa-2- animals (n=7). Each symbol represents an individual animal and the mean is indicated. Light grey bars represent WT animals and dark grey bars represent Qa-2- animals. ****p < 0.0001; ***p < 0.001; **p < 0.01; *p < 0.05; ns, not significant. Mann-Whitney test.
Figure 3
Figure 3
Decreased accumulation and function of MDSC in Qa-2 deficient mice. Wildtype (WT) and Qa-2 deficient mice (Qa2-) were term-bred and the day when a vaginal plug was detected was defined as day E0.5. Mice were euthanized at E18.5 and spleens and uteri were collected. Non-pregnant animals served as controls. Tissues were homogenized and filtered to obtain single cell suspensions and cells were analyzed by flow cytometry. (A) Representative pseudocolor plots for Gr-1 versus CD11b showing the population of MDSC in spleen leucocytes in the upper right quadrant. Cells were pre-gated on CD45. (B–D) Percentages of all MDSC (B), GR-MDSC (C) and MO-MDSC (D) from all spleen leucocytes in non-pregnant animals (np, n=17 for WT and n=21 for Qa-2-) and pregnant animals at E18.5 (n=16 for WT and n=13 for Qa-2-). Light grey graphs represent WT animals and dark grey graphs represent Qa-2- animals. (E) Representative pseudocolor plots for Gr-1 versus CD11b showing the population of MDSC in uterus leucocytes in the upper right quadrant. Cells were pre-gated on CD45. (F) Percentages of MDSC from all uterus leucocytes in non-pregnant animals (np, n=12 for WT and n=20 for Qa-2-) and pregnant animals at E18.5 (n=16 for WT and n=13 for Qa-2-). Light grey graph represents WT animals and dark grey graph represents Qa-2- animals. Each symbol represents an individual animal and the mean is indicated. ****p < 0.0001; ***p < 0.001; *p < 0.05; ns, not significant. Mann-Whitney test. MDSC were in vitro generated from bone marrow cells (G+H) or isolated by magnetic activated cell sorting from E18.5 pregnant WT and Qa-2- mice (I+J) and added to MACS isolated splenic CD4+ T-cells from WT mice. (G) Representative pseudocolor plots for Foxp3 versus CD25 showing the population of Foxp3+ Treg cells after four days of co-culture with MDSC generated from WT and Qa-2- mice in a 2:1 (T-cells: MDSC) ratio in the upper right quadrant. Cells were pre-gated on CD45, CD3 and CD4. (H) Percentages of Foxp3+ Treg cells of all CD4+ T-cells without addition of MDSC, with addition of MDSC generated from WT mice and with addition of MDSC generated from Qa-2- mice (n=10). Each symbol represents an individual animal and the mean is indicated. Bars represent pooled data from 6-7 independent experiments. (I) Representative histogram plots showing proliferation of CFSE-stained and anti-CD3/CD28 stimulated T-cells without addition of MDSC and with addition of MDSC generated from WT and Qa-2- mice in a 2:1 (T-cells: MDSC) ratio. (J) Inhibitory effect of MDSC from WT mice (white bars) and Qa-2- mice (black bars) on proliferation of CD4+ T-cells in different ratios (T-cells:MDSC) (n=6-7). Dashed line shows proliferation of target CD4+ T-cells without addition of MDSC. Proliferation index was determined as ratio of T-cell proliferation with and without addition of MDSC. **p < 0.001; ns, not significant. Wilcoxon matched pairs signed rank test (H) and Mann-Whitney test (J).
Figure 4
Figure 4
Expression of Qa-2 on MDSC is regulated by estrogen via HIF-1α. (A) Representative pseudocolor plots for Gr-1 versus Qa-2 from splenocytes from non-pregnant (np) and pregnant (p) wildtype (WT) animals showing the percentage of Qa-2 expressing MDSC in the upper right quadrant. Cells were pre-gated on CD45 and CD11b. (B) Percentages of Qa-2 expressing MDSC from all spleen MDSC from non-pregnant (n=13) and pregnant WT mice (n=13). (C) MFI for Qa-2 on spleen T-cells from non-pregnant (n=23) and pregnant WT mice (n=14). (D) Representative pseudocolor plots for CD66b versus HLA-G from PBMC from non-pregnant (np) and pregnant (p) women showing the percentage of HLA-G expressing MDSC in the upper right quadrant. (E) Percentages of HLA-G expressing MDSC from all MDSC in the peripheral blood of non-pregnant (n=18) and pregnant women (n=21). (F) Representative images of H&E stained vaginal swabs from the four different phases of the mouse estrus cycle. (G) Percentages of Qa-2 expressing cells from all blood CD11b+/Gr-1+ cells in proestrus & estrus (n=14) and metestrus & diestrus (n=17). (H) Representative pseudocolor plots for Gr-1 versus Qa-2 from splenocytes from WT mice without stimulation (ctrl) and with stimulation with 100nM estrogen showing the percentage of Qa-2 expressing MDSC in the upper right quadrant. Cells were pre-gated on CD45 and CD11b. (I) Percentages of Qa-2 expressing MDSC from all spleen MDSC from WT mice without stimulation and with stimulation with estrogen in rising concentrations (n=7). (J) MFI for Qa-2 on spleen T-cells from wildtype mice without stimulation and with stimulation with estrogen in rising concentrations (n=5). (K) Representative pseudocolor plots for Gr-1 versus Qa-2 from splenocytes from wildtype (WT) mice cultured under normoxia (ctrl) or anoxia for 4 h showing the percentage of Qa-2 expressing MDSC in the upper right quadrant. Cells were pre-gated on CD45 and CD11b. (L) Percentages of Qa-2 expressing MDSC from all spleen MDSC from WT mice cultured under normoxia or anoxia (n=5). (M) Percentages of Qa-2 expressing MDSC from all spleen MDSC from WT mice without stimulation or with stimulation with (E) coli (n=5). (N) MFI of Qa-2 on spleen T-cells from WT mice cultured under normoxia or anoxia (n=5). (O) MFI of Qa-2 on spleen T-cells from wildtype mice without stimulation or with stimulation with (E) coli (n=5). (P) Representative pseudocolor plots for Gr-1 versus Qa-2 from splenocytes from pregnant WT animals and pregnant animals with targeted deletion of HIF-1α in myeloid cells (HIF-KO) showing the percentage of Qa-2 expressing MDSC in the upper right quadrant. Cells were pre-gated on CD45 and CD11b. (Q) Percentages of Qa-2 expressing MDSC from all spleen MDSC from WT mice (n=5) and from HIF-KO mice (n=5). (R) Percentages of Qa-2 expressing MDSC from all spleen MDSC from HIF-KO mice without stimulation and with stimulation with estrogen in rising concentrations (n=5). Each symbol represents an individual animal/women and the mean is indicated. ****p < 0.0001; **p < 0.01; *p < 0.05; ns, not significant. Mann-Whitney test (B, C, E, G, Q) and Wilcoxon matched-pairs signed rank test (I, J, L–O, R).
Figure 5
Figure 5
sHLA-G improves pregnancy outcome. (A–F) Qa-2 deficient mice (Qa2-) were term-bred and the day when a vaginal plug was detected was defined as day E0.5. At E10.5 and E14.5 mice received either PBS, 1µg/g bodyweight sHLA-G or 1µg/g bodyweight sHLA-G and anti-Ly6G-antibody. (A) Abortion rate (percentage of resorbed fetuses per litter) of Qa-2- mice after application of PBS (ctrl, n=6) or sHLA-G (n=6) at E18.5. (B) Representative images of H&E stained chorionic villi Qa-2- animals that received sHLA-G. (C) Percentages of MDSC in spleens of pregnant Qa-2- animals after application of PBS (ctrl, n=6) or sHLA-G (n=6) at E18.5. (D) Representative pseudocolor plots for Gr-1 versus CD11b showing the population of MDSC in uterus leucocytes of Qa-2- mice after application of PBS or sHLA-G in the upper right quadrant. Cells were pre-gated on CD45. (E) Percentages of MDSC in uteri of pregnant Qa-2- animals after application of PBS (ctrl, n=6) or sHLA-G (n=6) at E18.5. (F) Abortion rate of Qa-2 deficient mice after application of PBS (ctrl, n=7) or sHLA-G and anti-Ly6G-antibody (n=4) at E18.5. (G+H) Female CBA/J mice were term-bred with male DBA/2J mice and the day when a vaginal plug was detected was defined as day E0.5. At E0.5, E3.5, E6.5 and E9.5 mice received either PBS or 1µg/g bodyweight sHLA-G. (G) Abortion rate of Qa-2 deficient mice after application of PBS (ctrl, n=5) or MDSC (n=5) at E18.5. (H+I) Female CBA/J mice were term-bred with male DBA/2J mice and the day when a vaginal plug was detected was defined as day E0.5. At E0.5, E3.5, E6.5 and E9.5 mice received either PBS or 1ug/g bodyweight sHLA-G. (H) Representative uteri containing fetal-placental units from PBS (ctrl, n=7) and sHLA-G treated mice (n=5) at gestational day E10.5. Arrows show resorbed fetuses. (I) Abortion rate of CBA/J mice after application of PBS (ctrl, n=7) or sHLA-G (n=5) at E10.5. Each symbol represents an individual animal and the mean is indicated. *p < 0.05; ns, not significant. Mann-Whitney test.

Similar articles

Cited by

References

    1. Rai R, Regan L. Recurrent Miscarriage. Lancet (2006) 368(9535):601–11. doi: 10.1016/S0140-6736(06)69204-0 - DOI - PubMed
    1. Romero R, Dey SK, Fisher SJ. Preterm Labor: One Syndrome, Many Causes. Science (2014) 345(6198):760–5. doi: 10.1126/science.1251816 - DOI - PMC - PubMed
    1. Geraghty DE, Koller BH, Orr HT. A Human Major Histocompatibility Complex Class I Gene That Encodes a Protein With a Shortened Cytoplasmic Segment. Proc Natl Acad Sci USA (1987) 84(24):9145–9. doi: 10.1073/pnas.84.24.9145 - DOI - PMC - PubMed
    1. Rebmann V, da Silva Nardi F, Wagner B, Horn PA. HLA-G as a Tolerogenic Molecule in Transplantation and Pregnancy. J Immunol Res (2014) 2014:297073. doi: 10.1155/2014/297073 - DOI - PMC - PubMed
    1. Kovats S, Main EK, Librach C, Stubblebine M, Fisher SJ, DeMars R. A Class I Antigen, HLA-G, Expressed in Human Trophoblasts. Science (1990) 248(4952):220–3. doi: 10.1126/science.2326636 - DOI - PubMed

Publication types

MeSH terms

Substances