. 2022 Feb 1;13(1):267-283.
doi: 10.14336/AD.2021.0720. eCollection 2022 Feb.

Cognitive Impairment and Metabolite Profile Alterations in the Hippocampus and Cortex of Male and Female Mice Exposed to a Fat and Sugar-Rich Diet are Normalized by Diet Reversal

Affiliations

Cognitive Impairment and Metabolite Profile Alterations in the Hippocampus and Cortex of Male and Female Mice Exposed to a Fat and Sugar-Rich Diet are Normalized by Diet Reversal

Alba M Garcia-Serrano et al. Aging Dis. .

Abstract

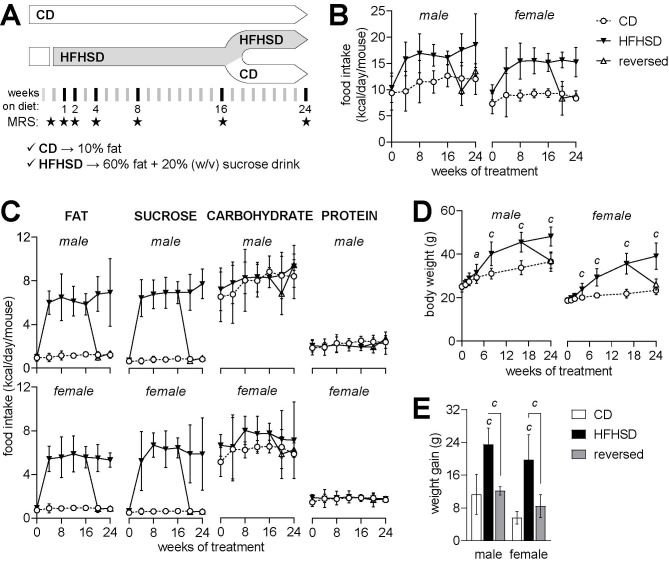
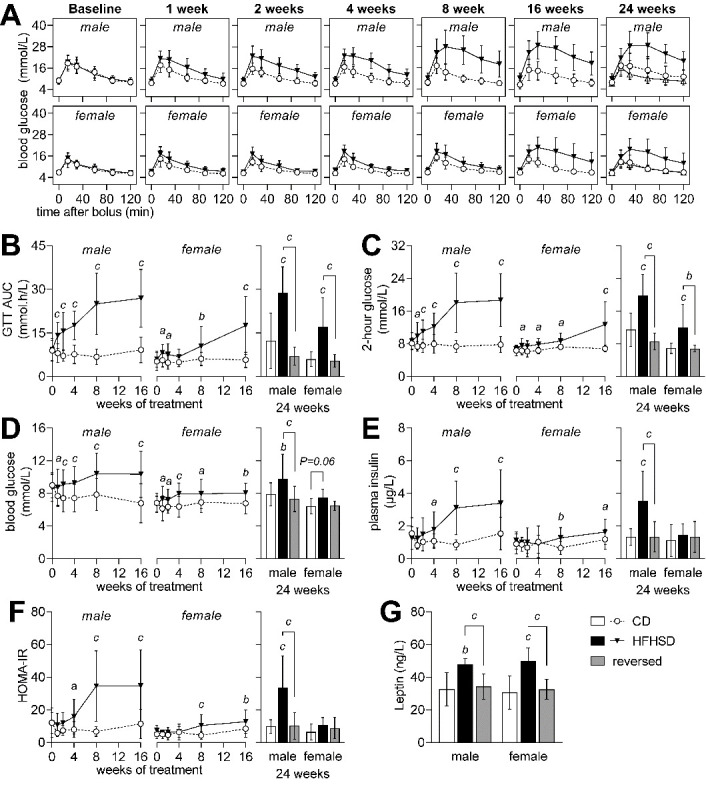
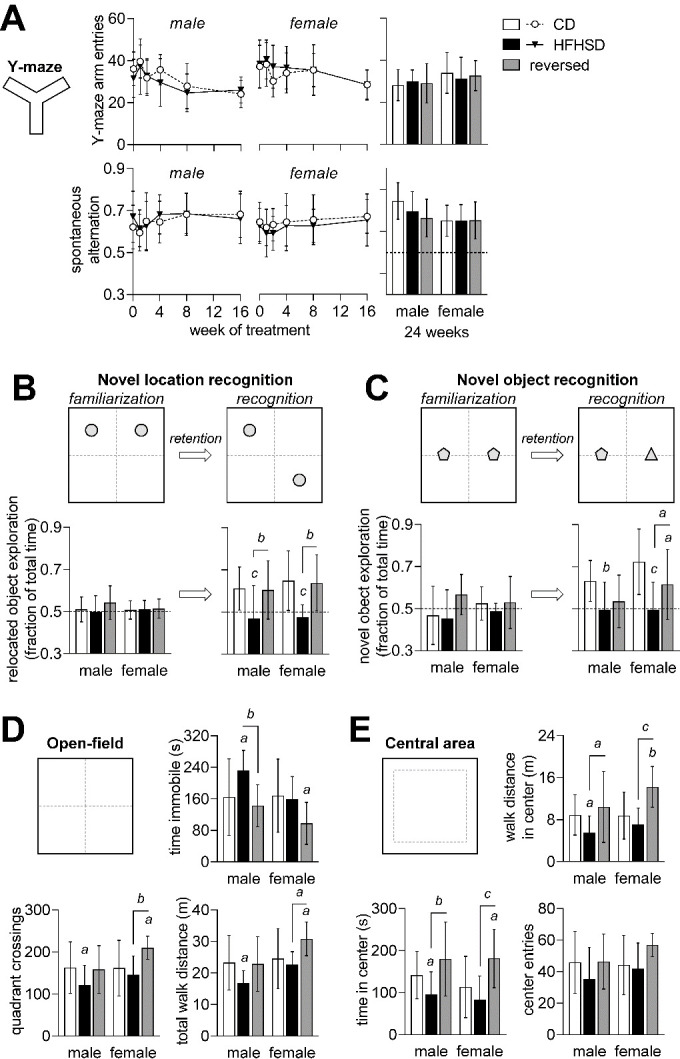
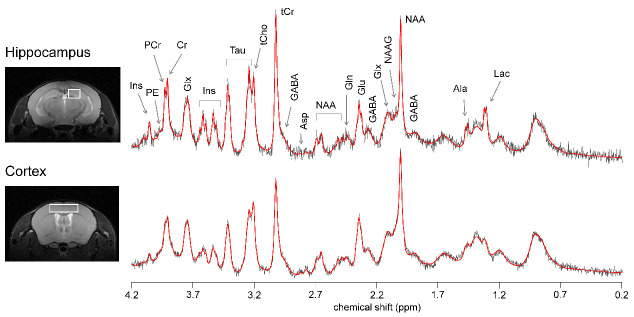
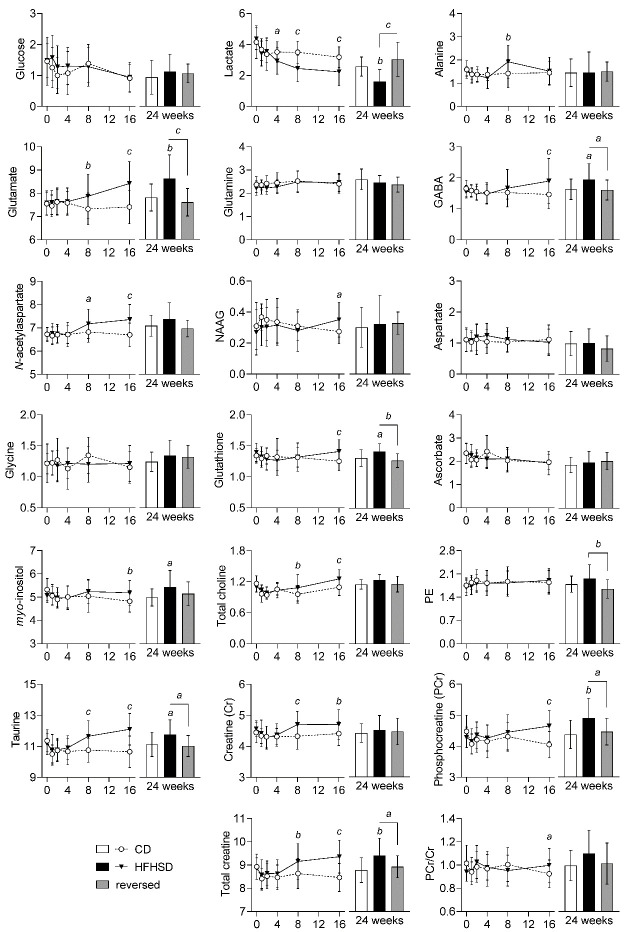
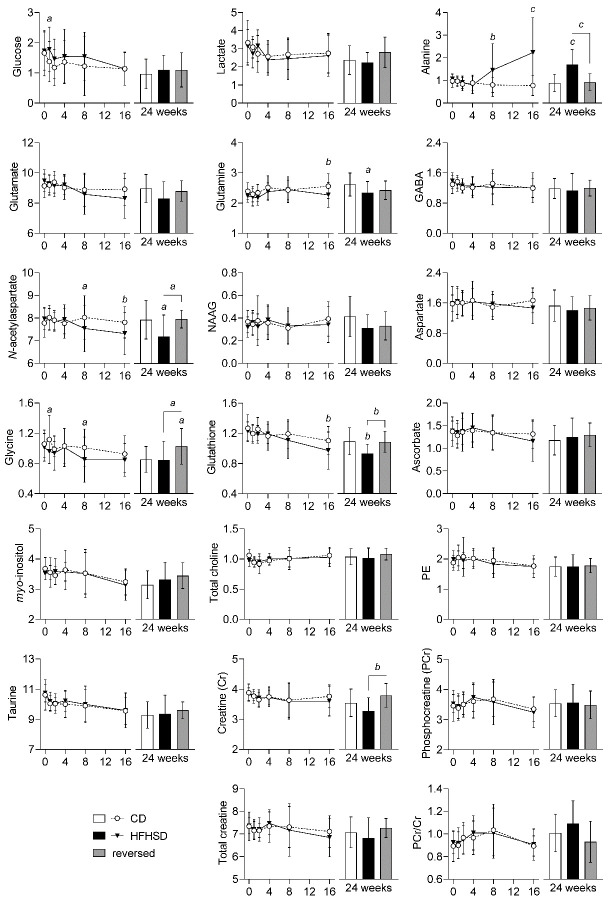
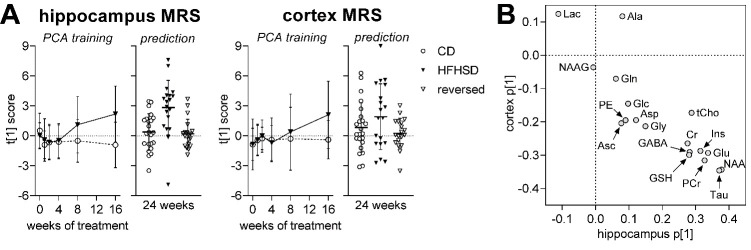
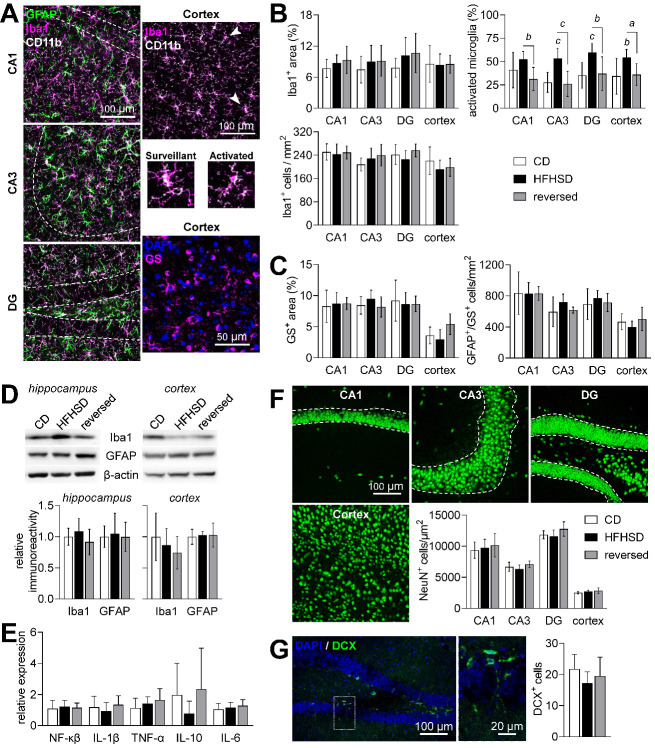
Diabetes impacts on brain metabolism, structure, and function. Alterations in brain metabolism have been observed in obesity and diabetes models induced by exposure to diets rich in saturated fat and/or sugar and have been linked to memory impairment. However, it remains to be determined whether brain dysfunction induced by obesogenic diets results from permanent brain alterations. We tested the hypothesis that an obesogenic diet (high-fat and high-sucrose diet; HFHSD) causes reversible changes in hippocampus and cortex metabolism and alterations in behavior. Mice were exposed to HFHSD for 24 weeks or for 16 weeks followed by 8 weeks of diet normalization. Development of the metabolic syndrome, changes in behavior, and brain metabolite profiles by magnetic resonance spectroscopy (MRS) were assessed longitudinally. Control mice were fed an ingredient-matched low-fat and low-sugar diet. Mice fed the HFHSD developed obesity, glucose intolerance and insulin resistance, with a more severe phenotype in male than female mice. Relative to controls, both male and female HFHSD-fed mice showed increased anxiety-like behavior, impaired memory in object recognition tasks, but preserved working spatial memory as evaluated by spontaneous alternation in a Y-maze. Alterations in the metabolite profiles were observed both in the hippocampus and cortex but were more distinct in the hippocampus. HFHSD-induced metabolic changes included altered levels of lactate, glutamate, GABA, glutathione, taurine, N-acetylaspartate, total creatine and total choline. Notably, HFHSD-induced metabolic syndrome, anxiety, memory impairment, and brain metabolic alterations recovered upon diet normalization for 8 weeks. In conclusion, cortical and hippocampal derangements induced by long-term HFHSD consumption are reversible rather than being the result of permanent tissue damage.

Keywords: anxiety; brain metabolism; diabetes; high-fat; memory; obesity; sucrose.


Conflict of interest statement

Disclosure/conflict of interest The authors declared no potential conflicts of interest with respect to the research, authorship, and publication of this article.

Figures

Figure 1.
Figure 1.
Study design and caloric intake in each month of the treatment. Mice were acclimatized under control diet (CD) at 8 weeks of age and exposed to HFHSD for 4 or 6 months starting at 10 weeks of age (A). A group of mice had the diet reversed to control after 4 months under HFD (reversed). MRS scans took place at baseline, and then at weeks 1, 2, 4, 8, 16 and 24 of the treatment (stars in timeline of panel A). Average caloric intake from increased during HFHSD-feeding (B) due to increased fat and sucrose intake (C). Relative to CD, HFHSD feeding resulted in increased body weight (D) and an over 2-fold larger weight gain from baseline to 6 months of treatment (E), which is fully reversed by diet normalization. Data is mean±SD. Letters over data-points indicate significant differences relative to CD or as indicated (a P<0.05, b P<0.01, c P<0.001) based on Fisher’s LSD post hoc comparison for significant effects of diet or interaction between diet and time, as assessed by ANOVA. Food intake is the cage average (n=3-9).
Figure 2.
Figure 2.
Glycemic regulation in mice from control (CD, open circles), HFHSD (filed triangles) and reversed (open triangles) groups at baseline and after 1, 2, 4, 8, 16 and 24 weeks of the treatment. Glucose clearance (A) in a glucose tolerance test (GTT) was reduced by HFHSD feeding, as evidenced by both increased area under the curve (AUC) of the GTT (B) and increased glycemia 2 hours after the glucose bolus (C). Blood glucose (D), plasma insulin (E) and HOMA-IR (F) after a 6-hour fasting period indicate insulin resistance in HFHSD-fed male mice. Compared to controls, plasma leptin was increased in HFHSD-fed mice and normalized by diet reversal (G). Data is mean±SD. Letters over data-points indicate significant differences relative to CD or as indicated (a P<0.05, b P<0.01, c P<0.001) based on Fisher’s LSD post hoc comparison following presence of significant effects of diet or interaction between diet and time in ANOVA tests.
Figure 3.
Figure 3.
Memory impairment induced by HFHSD exposure. Number of arm entries in the Y-maze and spontaneous alternation (A) were not modified during exposure to HFHSD. After familiarization with 2 objects, both novel location recognition (B) and novel object recognition (C) tasks show that mice exposed to HFHSD for 24 weeks did not display increased exploration of novel location or object. When diet was reversed, mice recovered the ability to recognize novelty in the object displacement task (D) but not in the object replacement task (E). Dashed lines in graphs represent chance (50%). Data is mean±SD. Letters over data-points indicate significant differences relative to CD or as indicated (a P<0.05, b P<0.01, c P<0.001) based on Fisher’s LSD post hoc comparison following presence of significant effects of diet or interaction between diet and time in ANOVA tests.
Figure 4.
Figure 4.
Representative location of the VOIs used for MRS in dorsal hippocampus and cortex, and respective spectra acquired with STEAM at 9.4 T (gray line) and LCModel fitting result (red line). Spectra were acquired with 320 and 192 averages in the hippocampus and cortex, respectively. From right to left: Ala, alanine; Lac, lactate; GABA, γ-aminobutyrate; NAA, N-acetylaspartate; NAAG, N-acetylaspartylglutamate; Glx, glutamate (Glu) + glutamine (Gln); Asp, aspartate; tCr, total creatine = creatine (Cr) + phosphocreatine (PCr); tCho, total choline = phosphorylcholine + glycerophosphorylcholine; Tau, taurine; Ins, myo-inositol; PE, phosphorylethanolamine.
Figure 5.
Figure 5.
Alterations in metabolite concentrations (in µmol/g) triggered by HFHSD feeding in the hippocampus. Data is mean ± SD. Letters over data-points indicate significant differences relative to CD or as indicated (a P<0.05, b P<0.01, c P<0.001) based on Fisher’s LSD post hoc comparison following presence of significant effects of diet or interaction between diet and time in ANOVA tests.
Figure 6.
Figure 6.
Alterations in metabolite concentrations (in µmol/g) triggered by HFHSD feeding in the cortex. Data is mean ± SD. Letters over data-points indicate significant differences relative to CD or as indicated (a P<0.05, b P<0.01, c P<0.001) based on Fisher’s LSD post hoc comparison following presence of significant effects of diet or interaction between diet and time in ANOVA tests.
Figure 7.
Figure 7.
Alterations in the overall metabolite profile in hippocampus and cortex examined using principal component analysis (PCA). The PCA was calculated for the first 16 weeks (A). Trajectories are based on the scores along the first principal component (PC1), describing time-dependent alterations in the metabolite profile. Scores were then estimated from metabolite levels measured at 24 weeks of examination (prediction), revealing a normalization of the metabolite profile after diet reversal. Variation explained by the first principal component (PC1) was 29% in hippocampus and 36% in cortex. (B) Weights for each metabolite along PC1 for hippocampus and cortex. Data is individual data-points or mean ± SD.
Figure 8.
Figure 8.
Neuroinflammation and neurodegeneration analysis in the hippocampus and cortex. (A) Confocal micrographs depicting Iba1-, CD11b- and GFAP-immunolabeled cells in the cornus amonis CA1/CA3 and dentate gyrus (DG) of the hippocampus or in the cortex, and cortical immunolabeling of glutamine synthetase (GS). Typical surveillant and activated microglia (Iba1+ and CD11b+) phenotypes are indicated by the arrowheads, and expanded below the cortex micrograph. (B) HFHSD had no impact on the Iba1+ area or number of microglia cells, but increased the fraction of activated microglia, which was normalized by diet reversal. (C) Astrocytes were considered all GS+ and/or GFAP+ cells. HFHSD had no impact on the area occupied by GS+ cells or number of astrocytes. (D) Total Iba1 and GFAP levels in the hippocampus or cortex were similar across the experimental groups. (E) Expression of NF-κβ and cytokines in the hippocampus, relative to the 60S ribosomal protein L14. (F) NeuN immunolabeling of neuronal somata was used to estimate the number of mature neurons in the cortex and within the granule cell layer of CA1, CA3 and DG. (G) Doublecortin (DCX)-immunolabeling was used to count immature neurons. DCX+ cells are estimated per DG within a stained brain slice. Dashed lines in micrographs define the granule cell layer in CA1, CA3 and DG. Data is plotted as mean±SD of n=6-8 (half of either gender). Letters over data-points indicate significant differences relative to CD or as indicated (a P<0.05, b P<0.01, c P<0.001) based on Fisher’s LSD post hoc comparison following presence of significant effects of diet or interaction between diet and time in ANOVA tests.

References

    1. Popa-Wagner A, Dumitrascu DI, Capitanescu B, Petcu EB, Surugiu R, Fang WH, Dumbrava DA (2020). Dietary habits, lifestyle factors and neurodegenerative diseases. Neural Regen Res, 15(3):394-400. - PMC - PubMed
    1. Askari M, Heshmati J, Shahinfar H, Tripathi N, Daneshzad E (2020). Ultra-processed food and the risk of overweight and obesity: a systematic review and meta-analysis of observational studies. Int J Obes (Lond), 44(10):2080-2091. - PubMed
    1. Frisardi V, Solfrizzi V, Seripa D, Capurso C, Santamato A, Sancarlo D, Vendemiale G, Pilotto A, Panza F (2010). Metabolic-cognitive syndrome: a cross-talk between metabolic syndrome and Alzheimer's disease. Ageing Res Rev, 9(4):399-417. - PubMed
    1. Spauwen PJ, Köhler S, Verhey FR, Stehouwer CD, van Boxtel MP (2013). Effects of type 2 diabetes on 12-year cognitive change: results from the Maastricht Aging Study. Diabetes Care, 36(6):1554-61. - PMC - PubMed
    1. Garcia-Serrano AM, Duarte JMN (2020). Brain Metabolism Alterations in Type 2 Diabetes: What Did We Learn From Diet-Induced Diabetes Models? Front Neurosci. 14:229. - PMC - PubMed

LinkOut - more resources