. 2022 Feb 3:11:e74419.
doi: 10.7554/eLife.74419.

Host-pathogen genetic interactions underlie tuberculosis susceptibility in genetically diverse mice

Affiliations

Host-pathogen genetic interactions underlie tuberculosis susceptibility in genetically diverse mice

Clare M Smith et al. Elife. .

Abstract

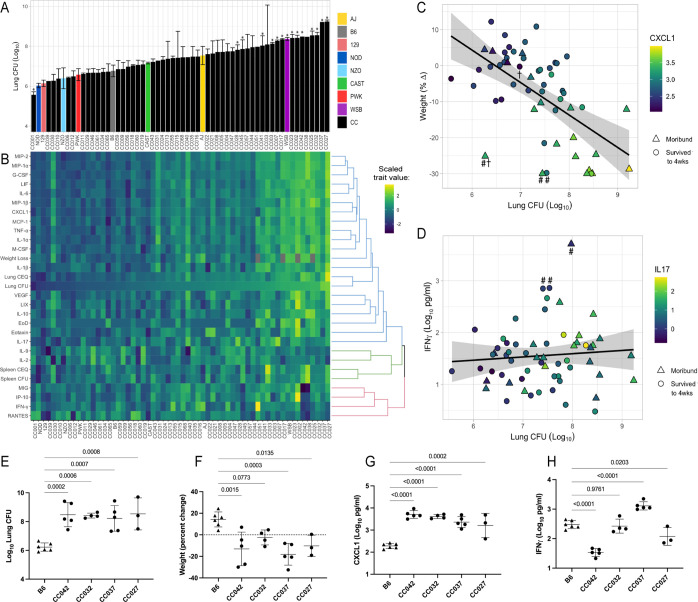
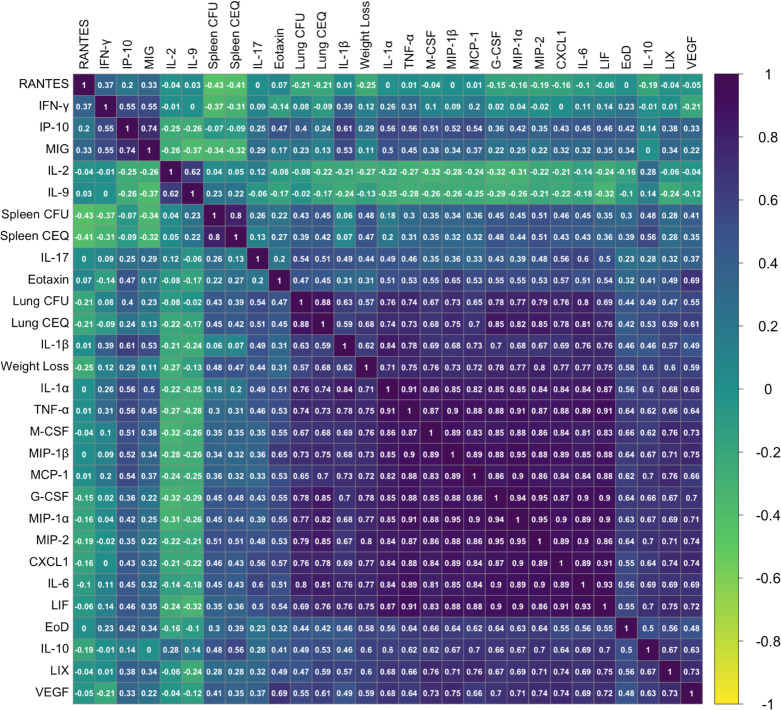
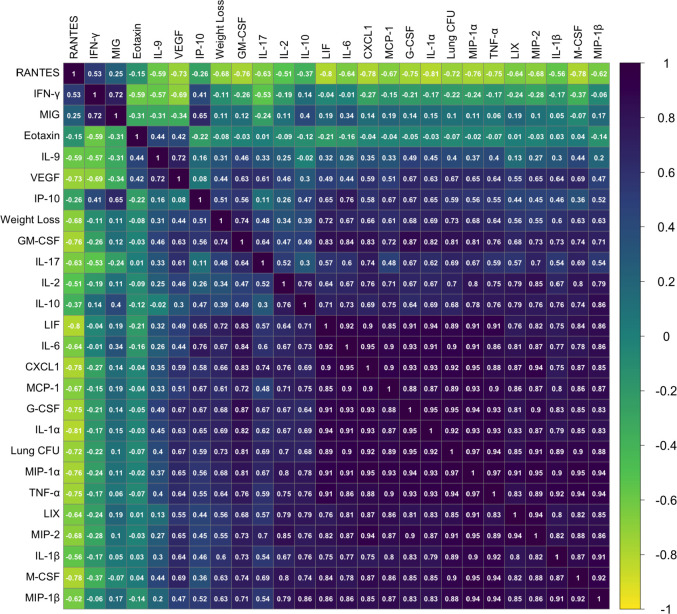
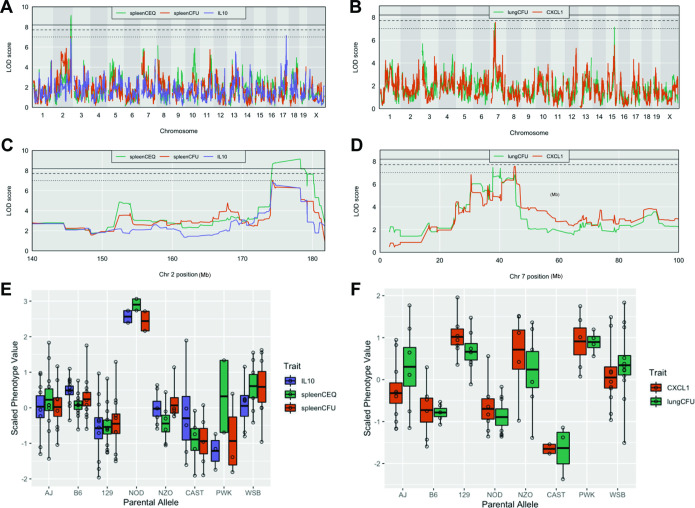
The outcome of an encounter with Mycobacterium tuberculosis (Mtb) depends on the pathogen's ability to adapt to the variable immune pressures exerted by the host. Understanding this interplay has proven difficult, largely because experimentally tractable animal models do not recapitulate the heterogeneity of tuberculosis disease. We leveraged the genetically diverse Collaborative Cross (CC) mouse panel in conjunction with a library of Mtb mutants to create a resource for associating bacterial genetic requirements with host genetics and immunity. We report that CC strains vary dramatically in their susceptibility to infection and produce qualitatively distinct immune states. Global analysis of Mtb transposon mutant fitness (TnSeq) across the CC panel revealed that many virulence pathways are only required in specific host microenvironments, identifying a large fraction of the pathogen's genome that has been maintained to ensure fitness in a diverse population. Both immunological and bacterial traits can be associated with genetic variants distributed across the mouse genome, making the CC a unique population for identifying specific host-pathogen genetic interactions that influence pathogenesis.

Keywords: TnSeq; collaborative cross; genetics; genomics; host-pathogen interactions; infectious disease; microbiology; mouse; mouse models; systems genetics; tuberculosis.


Conflict of interest statement

CS, RB, MP, BM, JL, SP, HL, MK, MB, AO, KM, KP, FB, CR, RM, BH, CL, GS, PH, TB, SE, DS, FP, MF, TI, CS No competing interests declared

Figures

Figure 1.
Figure 1.. he spectrum of M.tuberculosis disease-related traits across the collaborative cross.
(A) Average lung CFU (log10) across the CC panel at 4 weeks post-infection. Bars show mean ± SD for CFU per CC or parental strain; groups of three to six mice per genotype were infected via IV route (infectious dose of 104 in the lungs and 105 in the spleen as quantified by plating CFU 24 hr post-infection). To compare the field standard B6 mouse strain with the diverse CC mouse strains, bars noted with * indicate strains that were statistically different from B6 (p < 0.05; 1-factor ANOVA with Dunnett’s post-test). (B) Heatmap of the 32 disease-related traits (log10 transformed) measured including: lung and spleen colony forming units (CFU); lung and spleen chromosomal equivalents (CEQ); weight loss (% change); cytokines from lung; ‘earliness of death’ (EoD), reflecting the number of days prior to the end of experiment that moribund strains were euthanized. Mouse genotypes are ordered by lung CFU. Scaled trait values were clustered (hclust in R package heatmaply) and dendrogram nodes colored by 3 k-means. Blue node reflects correlation coefficient R > 0.7; green R = 0.3–0.6 and red R < 0.2. Source files of all measured phenotypes are available in Figure 1—source data 1. (C) Correlation of lung CFU and weight (% change) shaded by CXCL1 levels. Genotypes identified as statistical outliers for weight are noted by #; CXCL1 by † (CC030 is triangle with #†;CC040 is triangle with #; AJ is circle with #; CC056 is circle with †). (D) Correlation of lung CFU and IFNγ levels shaded by IL-17. Strains identified as outliers for IFNγ noted by # (CC055 is left circle with #, AJ is right circle with #, CC051 is triangle with #). Each point in (C) and (D) is the average value per genotype. Outlier genotypes were identified after linear regression using studentized residuals. (E–H) Disease traits measured in a validation cohort (B6 vs CC042, CC032, CC037, and CC027) at 4 weeks after post low-dose aerosol infection (E) lung CFU (log10); (F) Weight (percent change relative to uninfected); (G) CXCL1 abundance in lung (log10 pg/mL homogenate); (H) IFNγ (log10 pg/mL homogenate). Bar plots show the mean ± SD. p-Values indicate strains that were statistically different from B6 (1-factor ANOVA with Dunnett’s post-test). Source files of all measured phenotypes in the aerosol validation cohort are available in Figure 1—source data 2. Groups consist of three to six mice per genotype. All mice in the initial CC screen and validation cohort were male.
Figure 1—figure supplement 1.
Figure 1—figure supplement 1.. Phenotypic relationships between TB disease-related traits in the CC IV screen.
Correlation between 32-measured TB traits was determined by Pearson’s correlation and visualized using corrplot version 0.84 (ordered by hclust method ‘complete’) in R version 4.0.3. Violet indicates a positive correlation, and yellow indicates negative correlations. The correlation coefficient for each trait comparison (R value) is noted on each square. EoD (Earliness of Death); CEQ (Chromosomal Equivalents).
Figure 1—figure supplement 2.
Figure 1—figure supplement 2.. Phenotypic relationships between TB disease-related traits in the aerosol validation cohort.
Correlation between 32-measured TB traits was determined by Pearson’s correlation and visualized using corrplot version 0.84 (ordered by hclust method ‘complete’) in R version 4.0.3. Violet indicates a positive correlation, and yellow indicates negative correlations. The correlation coefficient for each trait comparison (R value) is noted on each square.
Figure 2.
Figure 2.. Host loci underlying TB disease-related traits.
(A–B) Whole genome QTL scans of (A) spleen CEQ, spleen CFU and IL-10 (B) lung CFU and CXCL1. (C) Zoom of chromosome two loci. (D) Zoom of chromosome seven loci. Thresholds were determined by permutation analysis; solid line, middle dashed line, and lowest dotted lines represent p = 0.05, p = 0.1, and p = 0.2. (E–F) Scaled phenotype value per haplotype at the QTL peak marker. Each dot represents the mean value for a genotype.
Figure 3.
Figure 3.. An F2 intercross approach to validate QTL underlying lung CFU.
(A) Haplotypes of CC030 and CC029 CC strains at Chr7 (Tip 8) and (B) at Chr15 (Tip10). The F2 population (n = 251) based on these founders were genotyped, infected with Mtb (105 infectious dose by IV route, as per the original CC screen), and lung CFU was quantified at 1 month post-infection. (C) QTL mapping identified genome-wide significant (p < 0.05) loci on Chr7 (LOD = 6.81; peak position on Chr7 at 28.6 Mb) overlapping with Tip8 and a new locus on Chr8 (LOD = 4.08; peak position Ch8:116.1 Mb). Thresholds were determined by permutation analysis; solid line, middle dashed line, and lowest dotted lines represent p = 0.05, p = 0.1, and p = 0.2. Source files of F2 genotypes are available in Figure 3—source data 1; phenotypes are available in Figure 3—source data 1.
Figure 4.
Figure 4.. Mtb genetic requirements vary across diverse hosts.
(A) The number of Mtb genes required for growth or survival in each diverse mouse strain across the panel (Qval ≤0.05). Orange indicates the mutants required for each strain; turquoise shows the cumulative requirement as each new host strain is added. (B) Venn diagram showing the composition of Mtb gene sets required in each category of host (white, largest circle), only required in the CC panel (gray), required in specific immunological KO mice (blue) and genes required in B6 mice (red). Note, 1* is required in B6 and KO. In order to be called ‘essential’ in each mouse strain, Mtb genes had to be significantly over or underrepresented in at least two genotypes. (C) Each box shows log2 fold change (LFC) of individual mutants from the TnSeq screen relative to the input pool in indicated mouse strains (top); log2 fold change of the indicated deletion mutants relative to WT from a pooled mutant validation infection (middle panel); relative fitness calculated from (middle panel) to account for generation differences in each host due to differential growth rate. Bars are the average of 3–6 mice per mutant/genotype ± SD. Statistical differences between mini-pool validation groups was assessed by Welch’s t-test. (D) Lung CFU and spleen CFU from single strain low-dose aerosol infections of ∆bioA mutant or WT H37Rv strain in B6 and CAST mice at 2- or 5 weeks post-infection. Dashed line indicates the limit of detection. Each point indicates the average CFU ± SD of 4–5 mice per group. Statistical differences between groups were assessed by mixed effects models (Tukey’s test). (E) Log2 fold change of selected mutants from the TnSeq screen across the CC panel and immunological KO mice. Each dot represents the average LFC per mouse genotype; KO mouse strains (on a B6 background) dots are shown larger for clarity. All mice in the large CC TnSeq screen were male; mice in the ∆bioA aerosol validation were female; mice in the mini-pool validation studies were male and female with no significant differences detected. Source file of the TnSeq screen is available in Figure 4—source data 1; source count data of the TnSeq validation experiment is available in Figure 4—source data 2.
Figure 4—figure supplement 1.
Figure 4—figure supplement 1.. Sampling additional B6 libraries does not appreciably increase the estimate of genes necessary for growth.
To approximate the experimental design of Figure 4A but for B6 only, six biological replicate TnSeq libraries from 4-week post-infection B6 mice were randomly paired, and genes required for growth or survival in each of the three runs or cumulatively were identified and counted exactly as for Figure 4A. The process was repeated ten times with the results shown. Error bars indicate mean ± SD for the 10 runs. Cumulative gene count stabilizes after two runs.
Figure 5.
Figure 5.. Mtb virulence pathways associate with distinct host immune pressures.
(A) Weighted gene correlation network analysis (WGCNA) of the 679 Mtb genes that significantly vary across the diverse mouse panel. The most representative genes of each module (intramodular connectivity >0.6) are shown. (B) Mouse genotypes were clustered based on the relative abundance of the 679 variable Mtb mutants. The six major clusters (Cluster A-F) were associated with both CFU and the relative abundance of mutants in each bacterial module (1-20; right hand-side with known functions). Statistical analysis is described in Methods. Yellow shading indicates clusters associated with lung CFU. * indicate modules significantly associated with specific mouse clusters (p < 0.05).
Figure 5—figure supplement 1.
Figure 5—figure supplement 1.. Module-trait associations.
Rows correspond to modules, columns to clinical traits. Numbers in each cell give the Pearson correlation between the module eigengene and the trait values across the 60 mouse panel (p-values in parentheses). Cells are colored by correlation as shown in the color legend (right).
Figure 6.
Figure 6.. Identification of ‘Host Interacting with Pathogen’ QTL mapping (HipQTL).
(A) Manhattan plot of single Mtb mutant QTL mapping across the mouse genome. Each dot represents an individual Mtb mutant plotted at the chromosomal location of its maximum LOD score. Red dashed line indicates p < 0.01; Blue p < 0.05. (B) Chromosome 10 QTL (in Mb) corresponding to Mtb eigentraits identified in network analysis in Figure 5. Module 3 (Type VII secretion, ESX1 operon; orange), Module 4 (Mycobactin synthesis, mbt; green) and Module 16 (Cholesterol uptake, mce4; purple) are shown. Solid and dotted lines indicated p = 0.05 and p = 0.1, respectively. Chromosomal position is in megabase units (Mb). (C–E) QTL mapping of single Mtb mutants corresponding to the (C) ESX1 module, (D) mbt module and (E) mce4 modules. Coincidence of multiple QTL was assessed by the NL-method of Neto et al., 2012. Thresholds shown are for N = 9, N = 8, and N = 6 for panels C, D, and E, respectively. Chromosomal position is in megabase units (Mb). (F) Parental founder effects underlying Module 3, 4, and 16 QTL. Allele effects were calculated at the peak LOD score marker on chromosome 10. (G) Distribution of log2 fold change (LFC) of representative single mutants from each module; eccCa1 (ESX1 module), mbtE (mbt module), and mce4F (mce4 module) relative to in vitro. Each dot is the LFC of the specified mutant in each CC mouse strain. Box and whiskers plots of each trait indicate the median and interquartile range. (H) Spleen CEQ and Spleen CFU for CC strains (box plots as in G). Mouse values are grouped by the parental haplotype allele series underlying the chromosome 10 Hip42 locus (NOD/WSB vs AJ/B6/NZO). Each dot represents the average CFU/CEQ of each CC genotype. Statistical differences in disease-associated traits and distinct haplotypes groups were assessed by t-test. LOD, logarithm of the odds; LFC, log2 fold change; CEQ, chromosomal equivalents; CFU, colony-forming units.
Figure 7.
Figure 7.. Visual representation of all Tip and HipQTL mapped in the CC TnSeq infection screen.
Tuberculosis ImmunoPhenotypes (Tip) QTL (QTL mapped by disease-associated traits in CC mice), are shown in green. TipQTL mapped by separate traits that share similar founder effects were considered to be the same QTL and were named accordingly. Host Interacting with Pathogen (Hip) QTL, (QTL mapped by individual TnSeq mutant relative abundance profiles), are shown in purple. After WGCNA mutant clustering and mapping with representative eigengenes from each module, QTL mapped by module eigengenes are shown in magenta.

Comment in

References

    1. Abel L, Fellay J, Haas DW, Schurr E, Srikrishna G, Urbanowski M, Chaturvedi N, Srinivasan S, Johnson DH, Bishai WR. Genetics of human susceptibility to active and latent tuberculosis: present knowledge and future perspectives. The Lancet. Infectious Diseases. 2018;18:e64–e75. doi: 10.1016/S1473-3099(17)30623-0. - DOI - PMC - PubMed
    1. Adams LA, Möller M, Nebel A, Schreiber S, van der Merwe L, van Helden PD, Hoal EG. Polymorphisms in MC3R promoter and CTSZ 3’UTR are associated with tuberculosis susceptibility. European Journal of Human Genetics. 2011;19:676–681. doi: 10.1038/ejhg.2011.1. - DOI - PMC - PubMed
    1. Ahmed M, Thirunavukkarasu S, Rosa BA, Thomas KA, Das S, Rangel-Moreno J, Lu L, Mehra S, Mbandi SK, Thackray LB, Diamond MS, Murphy KM, Means T, Martin J, Kaushal D, Scriba TJ, Mitreva M, Khader SA. Immune correlates of tuberculosis disease and risk translate across species. Science Translational Medicine. 2020;12:eaay0233. doi: 10.1126/scitranslmed.aay0233. - DOI - PMC - PubMed
    1. Altare F, Durandy A, Lammas D, Emile JF, Lamhamedi S, Le Deist F, Drysdale P, Jouanguy E, Döffinger R, Bernaudin F, Jeppsson O, Gollob JA, Meinl E, Segal AW, Fischer A, Kumararatne D, Casanova JL. Impairment of mycobacterial immunity in human interleukin-12 receptor deficiency. Science (New York, N.Y.) 1998;280:1432–1435. doi: 10.1126/science.280.5368.1432. - DOI - PubMed
    1. Amaral EP, Riteau N, Moayeri M, Maier N, Mayer-Barber KD, Pereira RM, Lage SL, Kubler A, Bishai WR, D’Império-Lima MR, Sher A, Andrade BB. Lysosomal Cathepsin Release Is Required for NLRP3-Inflammasome Activation by Mycobacterium tuberculosis in Infected Macrophages. Frontiers in Immunology. 2018;9:1427. doi: 10.3389/fimmu.2018.01427. - DOI - PMC - PubMed

Publication types

Associated data