. 2022 Apr;9(12):e2103675.
doi: 10.1002/advs.202103675. Epub 2022 Feb 3.

Single Cell RNA Sequencing Identifies a Unique Inflammatory Macrophage Subset as a Druggable Target for Alleviating Acute Kidney Injury

Affiliations

Single Cell RNA Sequencing Identifies a Unique Inflammatory Macrophage Subset as a Druggable Target for Alleviating Acute Kidney Injury

Weijian Yao et al. Adv Sci (Weinh). 2022 Apr.

Abstract

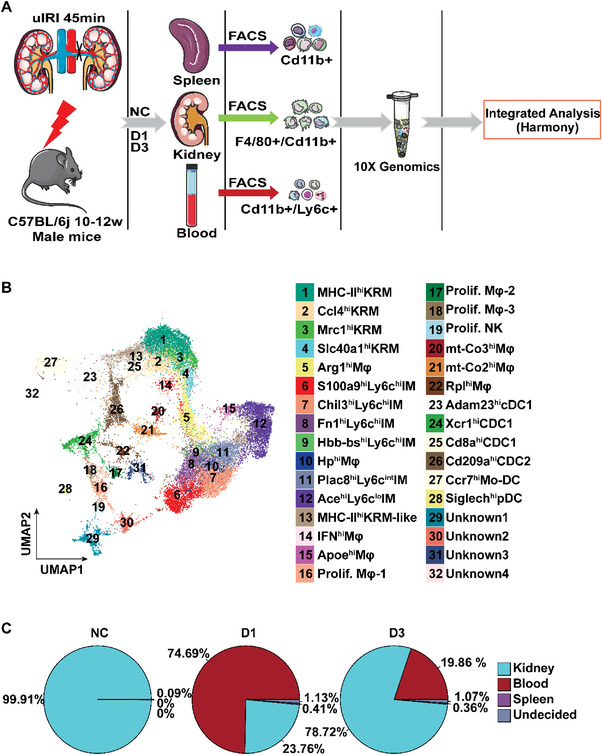
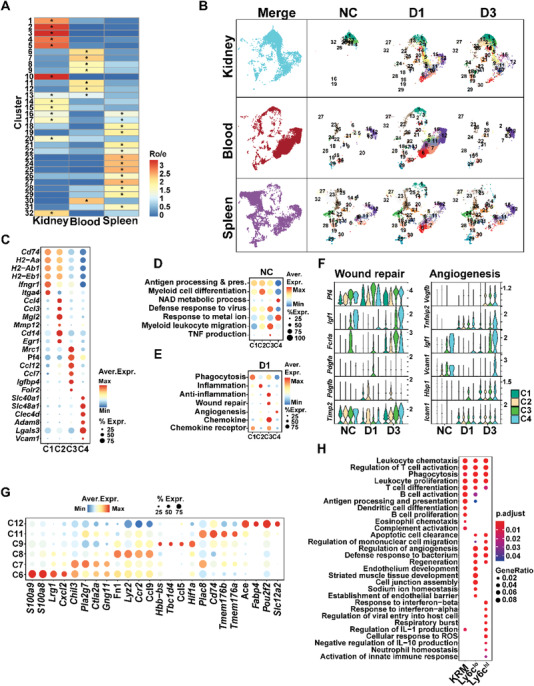
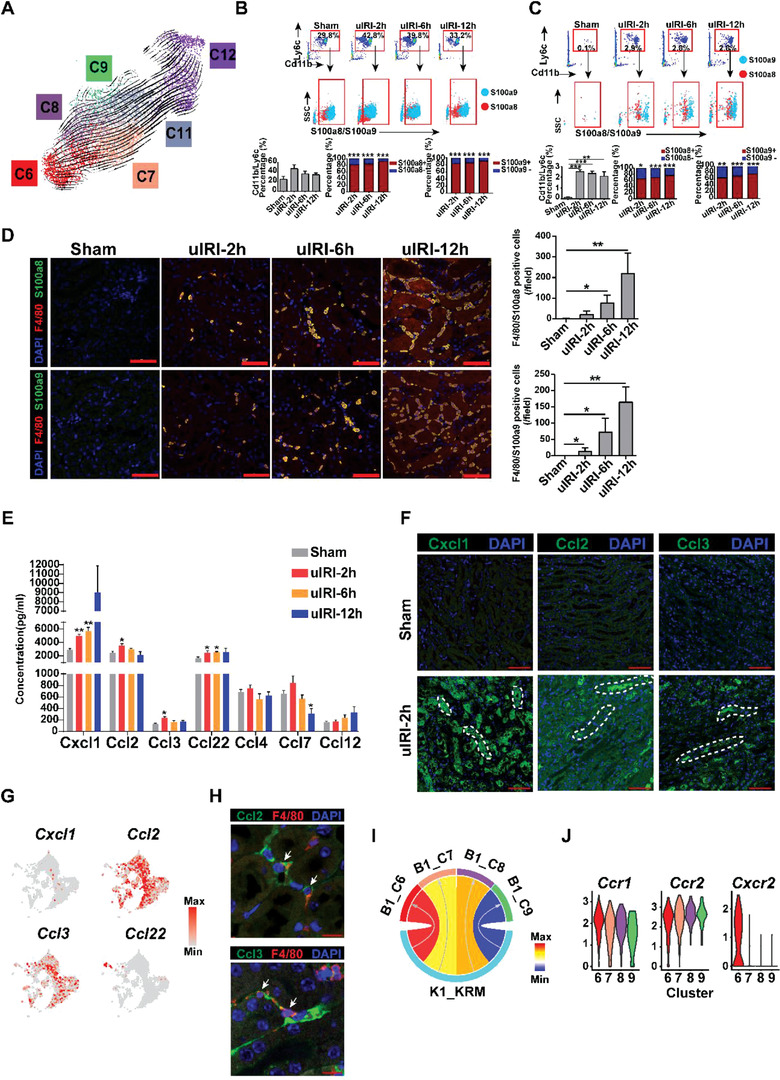
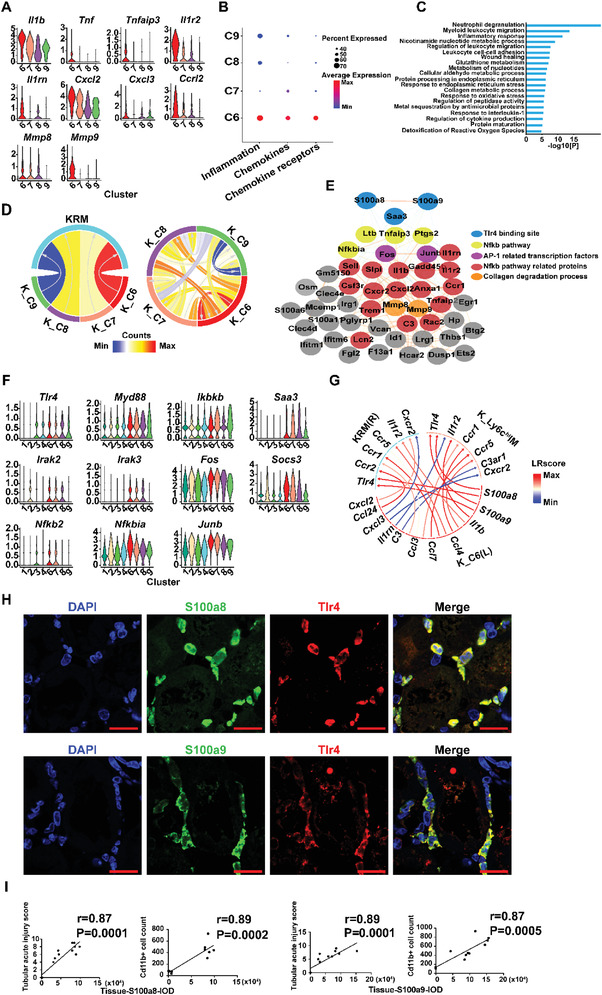
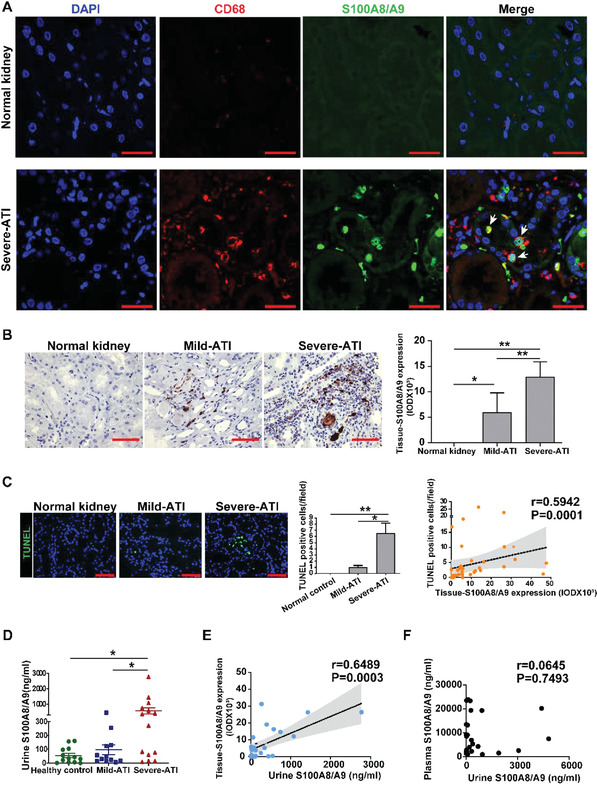
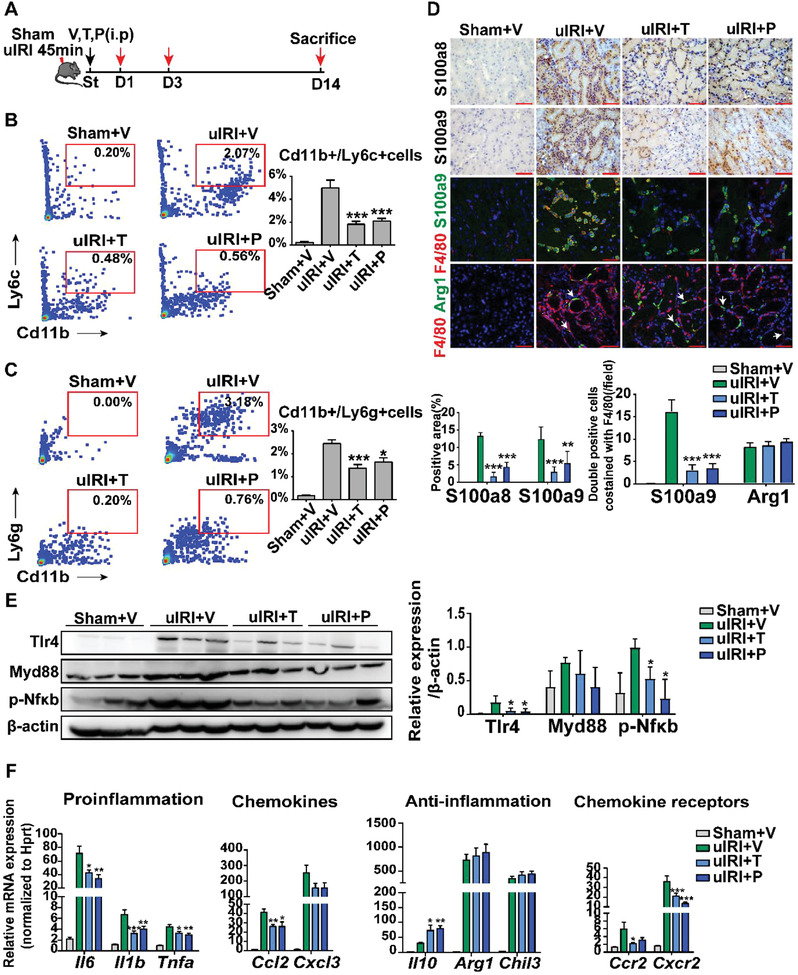
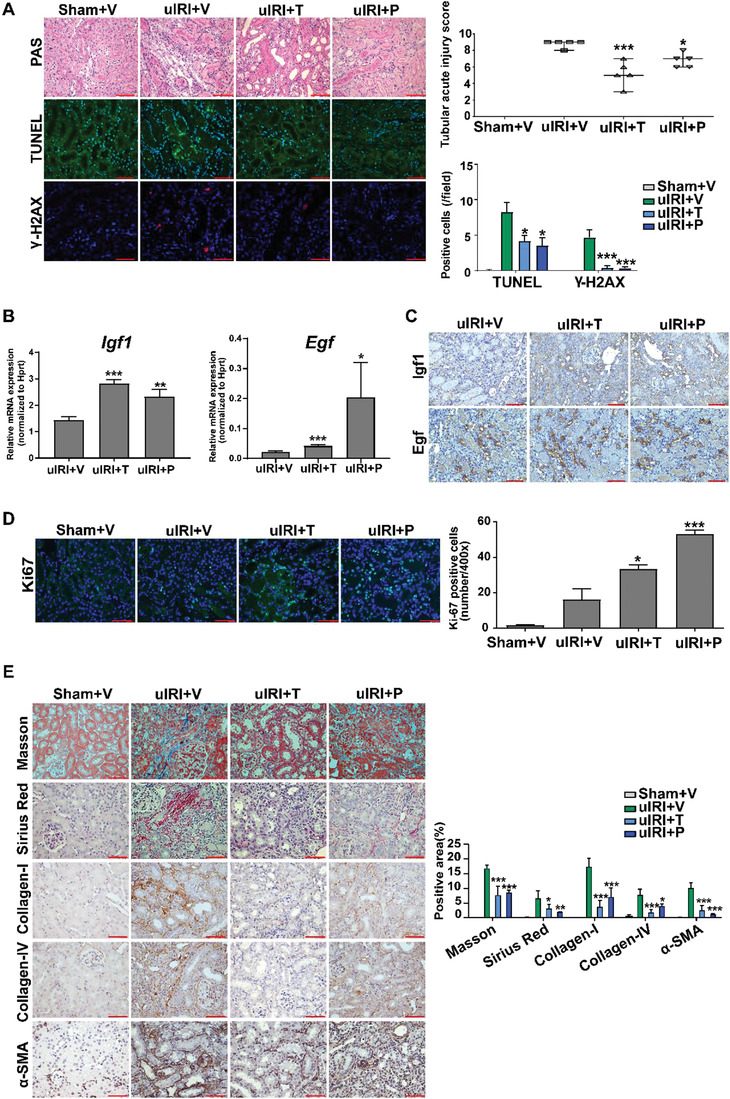
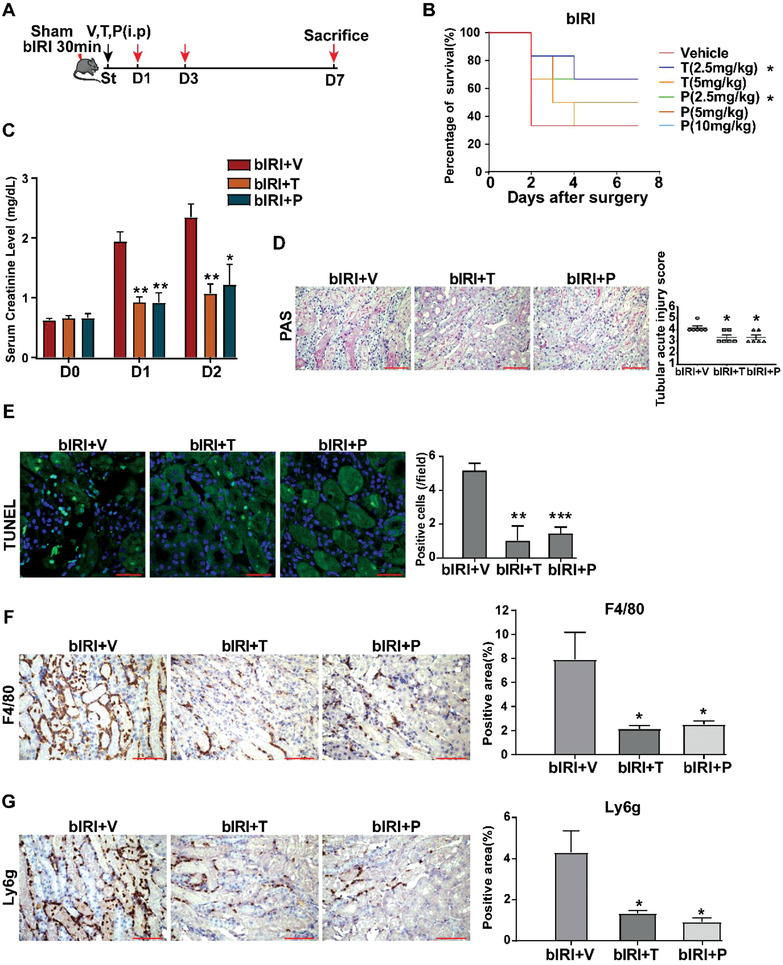
Acute kidney injury (AKI) is a complex clinical disorder associated with poor outcomes. Targeted regulation of the degree of inflammation has been a potential strategy for AKI management. Macrophages are the main effector cells of kidney inflammation. However, macrophage heterogeneity in ischemia reperfusion injury induced AKI (IRI-AKI) remains unclear. Using single-cell RNA sequencing of the mononuclear phagocytic system in the murine IRI model, the authors demonstrate the complementary roles of kidney resident macrophages (KRMs) and monocyte-derived infiltrated macrophages (IMs) in modulating tissue inflammation and promoting tissue repair. A unique population of S100a9hi Ly6chi IMs is identified as an early responder to AKI, mediating the initiation and amplification of kidney inflammation. Kidney infiltration of S100A8/A9+ macrophages and the relevance of renal S100A8/A9 to tissue injury is confirmed in human AKI. Targeting the S100a8/a9 signaling with small-molecule inhibitors exhibits renal protective effects represented by improved renal function and reduced mortality in bilateral IRI model, and decreased inflammatory response, ameliorated kidney injury, and improved long-term outcome with decreased renal fibrosis in the unilateral IRI model. The findings support S100A8/A9 blockade as a feasible and clinically relevant therapy potentially waiting for translation in human AKI.

Keywords: S100a9; acute kidney injury; inflammation; macrophage; single-cell RNA-seq; therapeutic target.


Conflict of interest statement

The authors declare no conflict of interest.

Figures

Figure 1
Figure 1
Single‐cell transcriptomics profiling of MPCs from kidney, blood, and spleen at hemostasis (NC) and day one (D1), day three (D3) after uIRI. A) The flow chart of experimental design. n = 6 mice at each time point. The flow chart materials was taken from the Servier Medical Art (https://smart.servier.com/). B) UMAP plot colored by MPC clusters depicting the MPC annotation. C) Pie graphs displaying the proportion of identified kidney MPCs ontogeny at each timepoint.
Figure 2
Figure 2
Functional heterogeneity of KRMs and IMs in the acute phase of AKI. A) Heatmap of Ro/e value showing the distribution of each MPC cluster in kidney, blood, and spleen. B) UMAP plots demonstrating the MPC cluster distribution at each timepoint and in each organ. C) Dot plot displaying the representative maker genes of the four KRM clusters. D) Dot plot showing the score comparison of GOBP terms related to KRM functions in the Normal Control (NC) group. E) The score comparison of typical functions among the four KRM clusters on day one post injury (D1). F) Representative genes related to typical functions in each KRM cluster before (NC) and day one (D1), day three (D3) after uIRI. G) Dot plot displaying the representative maker genes of the six IM clusters. H) Dot plot displaying the representative differentially enriched GOBP terms between KRMs, Ly6chiIMs, and Ly6clowIMs.
Figure 3
Figure 3
Dynamic functional plasticity of infiltrated Ly6chiIMs. A) Volcano plot displaying the DEGs between blood Ly6chi monocytes and kidney Ly6chi IMs on day one post injury. B) Dot graph showing the score comparison of typical functions between blood Ly6chi monocytes and kidney Ly6chi IMs. C) UMAP plot of kidney macrophage clusters Arg1hiC5 and Ly6chiIM C6‐C9 developmental transition as revealed by RNA velocity. D) Heatmap showing genes that significantly changed along the pseudotime in kidney macrophage clusters C5‐9 and their enrichment based on the kinetic trend of pseudo‐temporal expression pattern. E) Bar diagram displaying the enriched GOBP terms of the three gene modules. F) UMAP plot of KRM clusters C1‐C4 and Arg1hiC5 demonstrating their developmental transition as revealed by RNA velocity on day one post injury. G) UMAP plots of KRM clusters C1‐C4 and Arg1hiC5 demonstrating their developmental transition as revealed by RNA velocity on day three post injury. H) Stack violin plot demonstrating the expression of representative KRM genes in Arg1hiC5 on day one and day three post injury. I) Representative images of arginase‐1 immunohistochemical staining of sham, D1, and D3 post injury kidney tissues. Scale bar, 50 µm.
Figure 4
Figure 4
S100a9hiLy6chi monocytes infiltration in response to kidney injury signal. A) UMAP plot of circulating monocyte clusters C6‐9, C11, C12 in the blood demonstrating their developmental transition as revealed by RNA velocity on day one post injury. B) Flow cytometry gating of Cd11b+/Ly6c+ and S100a8+, S100a9+ cells in the blood at various time points after surgery. n = 3. Bar graph showing the percentage of S100a8/S100a9 positive cells and S100a8/S1009 negative cells at each time point. *** P < 0.001, Student's t test. C) Flow cytometry gating of Cd11b+/Ly6c+ and S100a8+, S100a9+ cells in the kidney at various time points after surgery. n = 3. Bar graph showing the percentage of S100a8/S100a9 positive cells and S100a8/S1009 negative cells at each time point. * P < 0.05, ** P < 0.01, *** P < 0.001, Student's t test. D) Representative immunofluorescent images of F4/80, S100a8, S100a9 costaining of sham or 2, 6, 12 h post injury kidney tissues. n = 3. *P < 0.05, **P < 0.01, compared to sham, Student's t test. E) Quantification of renal chemokine concentrations at different time points after injury. n = 3. *P < 0.05, **P < 0.01, compared to sham, Student's t test. F) Representative immunofluorescence images of Cxcl1, Ccl2, Ccl3 staining of sham or 2 h post injury kidney tissues. White dots circle renal tubules. G) Feature plots showing the representative chemokine expression in renal MPCs. H) Representative immunofluorescence images of Ccl2, Ccl3, and F4/80 costaining of 2 h post injury kidney tissues. Arrows indicate macrophages with specific chemokine secretion. I) Chord diagram demonstrating the intercellular communication between KRMs and the four clusters (C6, C7, C8, C9) of blood Ly6chi monocytes on day 1 post injury. J) Violin plots demonstrating chemokine receptors Ccr1, Ccr2, and Cxcr2 expression in the four clusters of Ly6chi monocytes. All scale bar, 50 µm.
Figure 5
Figure 5
Characteristics of monocyte‐derived S100a9hiLy6chi macrophages. A) The expression of inflammation‐related genes in the four clusters (C6, C7, C8, C9) of kidney Ly6chiIMs on day one post injury. B) Dot plot of scores of inflammation, chemokines, and chemokine receptors in the four clusters (C6, C7, C8, C9) of kidney Ly6chiIMs on day one post injury. C) Top 20 GOBP and KEGG items in kidney Ly6chi IMs on day one post injury. D) Chord diagrams demonstrating the intercellular communication from kidney Ly6chiIM clusters (C6, C7, C8, C9) to KRMs, and among the four kidney Ly6chiIM clusters (C6, C7, C8, C9) on day one post injury. E) PPI enrichment analyses in kidney S100a9hiLy6chi IMs on day one post injury using the STRING‐db. F) The expression of genes in Tlr4‐dependent inflammatory signaling pathways in KRMs (C1, C2, C3, C4) and kidney Ly6chiIMs (C6, C7, C8, C9) on day one post injury. G) Chord diagram displaying the significant representative ligand‐receptor pairs from ligands in kidney S100a9hiLy6chi C6 to receptors in KRMs and kidney Ly6chiIMs, respectively, on day one post injury. H) Representative immunofluorescent images of S100a8, S100a9, and Tlr4 costaining. Scale bar, 50 µm. I) The correlation analysis between kidney S100a8, S100a9 expression, and renal tubular acute injury score and the number of Cd11b+ cells, n = 11.
Figure 6
Figure 6
S100A8/A9+ macrophages in human kidney with acute tubular injury (ATI). A) The representative images of S100A8/A9 and CD68 immunofluorescence costaining in normal kidney and severe ATI kidney. Arrows indicate S100A8/A9 positive macrophages. B) The representative images of S100A8/A9 immunohistochemistry in normal kidney and kidney biopsy specimens with different levels of ATI and semi‐quantitative analysis. * P < 0.05, ** P < 0.01, Student's t test. C) TUNEL assay in patients with different ATI severity and its correlation with tissue S100A8/A9 expression. * P < 0.05, ** P < 0.01, Student's t test. D) The urine S100A8/A9 concentrations of healthy control (n = 13) and patients with mild‐ATI (n = 12) and severe‐ATI (n = 14). * P<0.05. E) Correlation analysis of the expression levels of tissue S100A8/A9 and urine S100A8/A9. F) Correlation analysis of the expression levels of tissue S100A8/A9 and plasma S100A8/A9. All scale bar, 50 µm.
Figure 7
Figure 7
Targeting S100a8/a9 signaling in unilateral IRI (uIRI) mouse model. A) Flow charts of drug treatments in uIRI animal models. V: vehicle; T: tasquinimod; P: paquinimod. B,C), Flow cytometry showing the number of kidney IMs (B) and neutrophils (C) in each treatment group. D) Representative images of kidney S100a8, S100a9 immunohistochemistry; S100a9, arginase 1 and F4/80 immunofluorescence costaining on day one after treatment. Arrows indicate Arg1 positive macrophages. E) Western blots of kidney Tlr4, Myd88, phospho‐Nfκb, and the quantification of expression on day one after treatment. F) Relative mRNA levels of representative genes in the kidney one day after treatment. n = 5 in each group. * P < 0.05, ** P < 0.01, *** P < 0.001 compared to uIRI+V group, Student's t test. All scale bar, 50 µm.
Figure 8
Figure 8
Targeting S100a8/a9 signaling in uIRI mouse model alleviated kidney injury. A) Representative images of PAS staining, TUNEL assay, and γ‐H2AX staining of kidney sections one day after treatment. * P < 0.05, *** P < 0.001 compared to uIRI+V group, Student's t test. B) Relative mRNA levels of Igf1 and Egf in the kidney one day after treatment. n = 5 in each group. * P < 0.05, ** P < 0.01, *** P < 0.001 compared to uIRI+V group, Student's t test. C) Representative images of Igf1 and Egf staining of kidney sections one day after treatment. D) Ki67 immunofluorescence staining of kidney sections on three days after treatment and semi‐quantitative analysis in each group. n = 5. * P < 0.05, *** P < 0.001 compared to uIRI+V group, Student's t test. E) Representative images of Masson, Sirius Red, collagen‐I, collagen‐IV, and α‐SMA staining of kidney sections on fourteen days after treatment and semi‐quantitative analysis in each group. n = 5. * P < 0.05, ** P < 0.01, *** P < 0.001 compared to uIRI+V, Student's t test. V: vehicle; T: tasquinimod; P: paquinimod. All scale bar, 50 µm.
Figure 9
Figure 9
Targeting S100a8/a9 signaling in bIRI (bIRI) mouse model. A) Flow charts of drug treatments in bIRI animal models. V: vehicle; T: tasquinimod; P: paquinimod. B) Survival curve of mice treated with different doses of tasquinimod (T) and paquinimod (P) in bIRI mouse model. The survival curve of 10mg/kg paquinimod treatment is overlapped with the survival curve of vehicle treatment. n = 6 in each group. * P < 0.05 compared to vehicle group, Log‐rank(Mantel‐Cox) test. C) The serum creatinine level after drug treatments in bIRI mouse model. n = 4 in each group on each day. * P < 0.05, ** P < 0.01 compared to bIRI+V group, Student's t test. D) Representative images of PAS staining on kidney sections one day after treatment in bIRI mouse model. n = 6 in each group. * P < 0.05 compared to bIRI+V group, Mann‐Whitney U test. E) Representative images of TUNEL assay of kidney sections one day after treatment. n = 6 in each group. ** P < 0.01, *** P < 0.001 compared to bIRI+V group, Student's t test. F,G) Representative images of kidney F4/80 and Ly6g immunohistochemistry on kidney sections one day after treatment. n = 6 in each group. * P < 0.05, compared to bIRI+V group, Student's t test. All scale bar, 50 µm.

References

    1. Ronco C., Bellomo R., Kellum J. A., Lancet 2019, 394, 1949. - PubMed
    1. Varrier M., Forni L. G., Ostermann M., Crit. Care 2015, 19, 102. - PMC - PubMed
    1. Bonventre J. V., Yang L., J. Clin. Invest. 2011, 121, 4210. - PMC - PubMed
    1. Zuk A., Bonventre J. V., Annu. Rev. Med. 2016, 67, 293. - PMC - PubMed
    1. Jang H. R., Rabb H., Nat. Rev. Nephrol. 2015, 11, 88. - PubMed

LinkOut - more resources